A retail analytics team is drowning in copy jobs. Their clickstream lives as Parquet in an S3 data lake behind a Hive metastore, their slowly-changing dimension tables were migrated to Apache Iceberg last quarter for time-travel and schema evolution, and the authoritative customer and order records still sit in an operational PostgreSQL instance the application team will not let anyone touch directly. Today every “join clicks to orders” question means a nightly Spark job that lands a third copy of the data, and analysts wait until tomorrow for an answer that is already stale. The ask from the head of data is blunt: “Let me write one SQL query that joins all three, today, without moving the data.” That is exactly what Trino’s federated query engine does — and this guide deploys it properly on Kubernetes, with a coordinator, an autoscaling worker pool, and three live catalogs, so the join runs in seconds against the data where it already lives.
We will use the official trinodb/charts Helm chart, because hand-rolling coordinator and worker Deployments leaves you maintaining config-map plumbing and discovery wiring that the chart already gets right. By the end you will have a working cluster you can query from the Trino CLI, a Hive catalog over object storage, an Iceberg catalog sharing the same metastore, a PostgreSQL catalog over the live OLTP database, horizontal pod autoscaling on the workers, SSO through Okta federated to Entra ID, and database credentials injected by HashiCorp Vault instead of baked into a manifest.
In a nutshell
Trino is a distributed SQL engine that queries data where it already lives — and joins across many systems in a single query. It stores nothing itself. You point it at your data sources, and it lets you write ordinary SQL over all of them at once. That “one query across many systems” trick is called federated query, and it is the whole reason this lesson exists: instead of copying clickstream, dimensions, and orders into one warehouse every night, you leave each dataset where it is and let Trino borrow it at query time.
A useful mental model: Trino is a SQL brain you bolt onto data you do not want to move. Give it an address book of systems, and it reaches out to each one, pulls back only the rows it needs, and stitches the answer together in memory. The clickstream stays as Parquet in the lake, the customer dimension stays in Iceberg, the orders stay in the live PostgreSQL — and a single JOIN spans all three.
Two ideas unlock everything else in this lesson:
- Coordinator vs workers. A Trino cluster has exactly one coordinator (the brain: it parses your SQL, plans the work, and hands out assignments) and many workers (the muscle: they read from the sources and do the actual crunching, in parallel). On Kubernetes the coordinator is one Deployment and the workers are a second Deployment you scale up and down — which is exactly why Trino and Kubernetes fit so well together.
- Connector vs catalog. A connector is a plugin that knows how to talk to one kind of system — there is a Hive connector, an Iceberg connector, a PostgreSQL connector, a Kafka connector, and dozens more. A catalog is a named, configured instance of a connector: the catalog named
postgresqluses the PostgreSQL connector and points at your orders database. You address any table ascatalog.schema.table—postgresql.public.orders,iceberg.analytics.dim_customer,hive.web.clickstream. That three-part name is the mechanism by which one query reaches three different systems.
Level: Advanced, with a beginner on-ramp · Time: ~45 min · You should already be comfortable with Deployments, Services, Helm, and the HPA — see Helm fundamentals and Kubernetes autoscaling: HPA, KEDA, Karpenter if either is fuzzy.
After this lesson you will be able to:
- Explain how a single SQL query is planned, split, and executed across a pool of Trino workers.
- Deploy a coordinator + autoscaling worker cluster on Kubernetes with the official Helm chart.
- Configure Hive, Iceberg, and PostgreSQL catalogs and know which pushdowns each connector supports.
- Run a three-way federated join with no data movement and prove the engine pushed work down.
- Partition the cluster with resource groups so ETL cannot starve interactive BI.
- Reason about the hard parts: fault-tolerant execution, memory and spill, scale-to-zero, and catalog-level access control.
Prerequisites
- A Kubernetes cluster, 1.28+, with at least 4 schedulable worker nodes (8 vCPU / 32 GiB each is a sane starting point for the worker pool). EKS, AKS, and GKE all work; node-group autoscaling should already be enabled.
kubectlandhelmv3.14+ on your workstation,kubectlcontext pointed at the target cluster.- The Trino CLI (
trino-cli-<version>-executable.jar) for validation. - An existing Hive Metastore reachable from the cluster (Thrift on
9083), or accept the bundled metastore note in Step 4. Both Hive and Iceberg catalogs share it. - Object storage for the lake (S3, ADLS Gen2, or GCS) and a credential or workload-identity binding for it.
- A reachable PostgreSQL instance (host, port, a read-only role).
- A namespace you can deploy into and
cluster-adminor equivalent RBAC to install the chart and an HPA. - The metrics-server installed in the cluster (the HPA depends on it).
Target topology
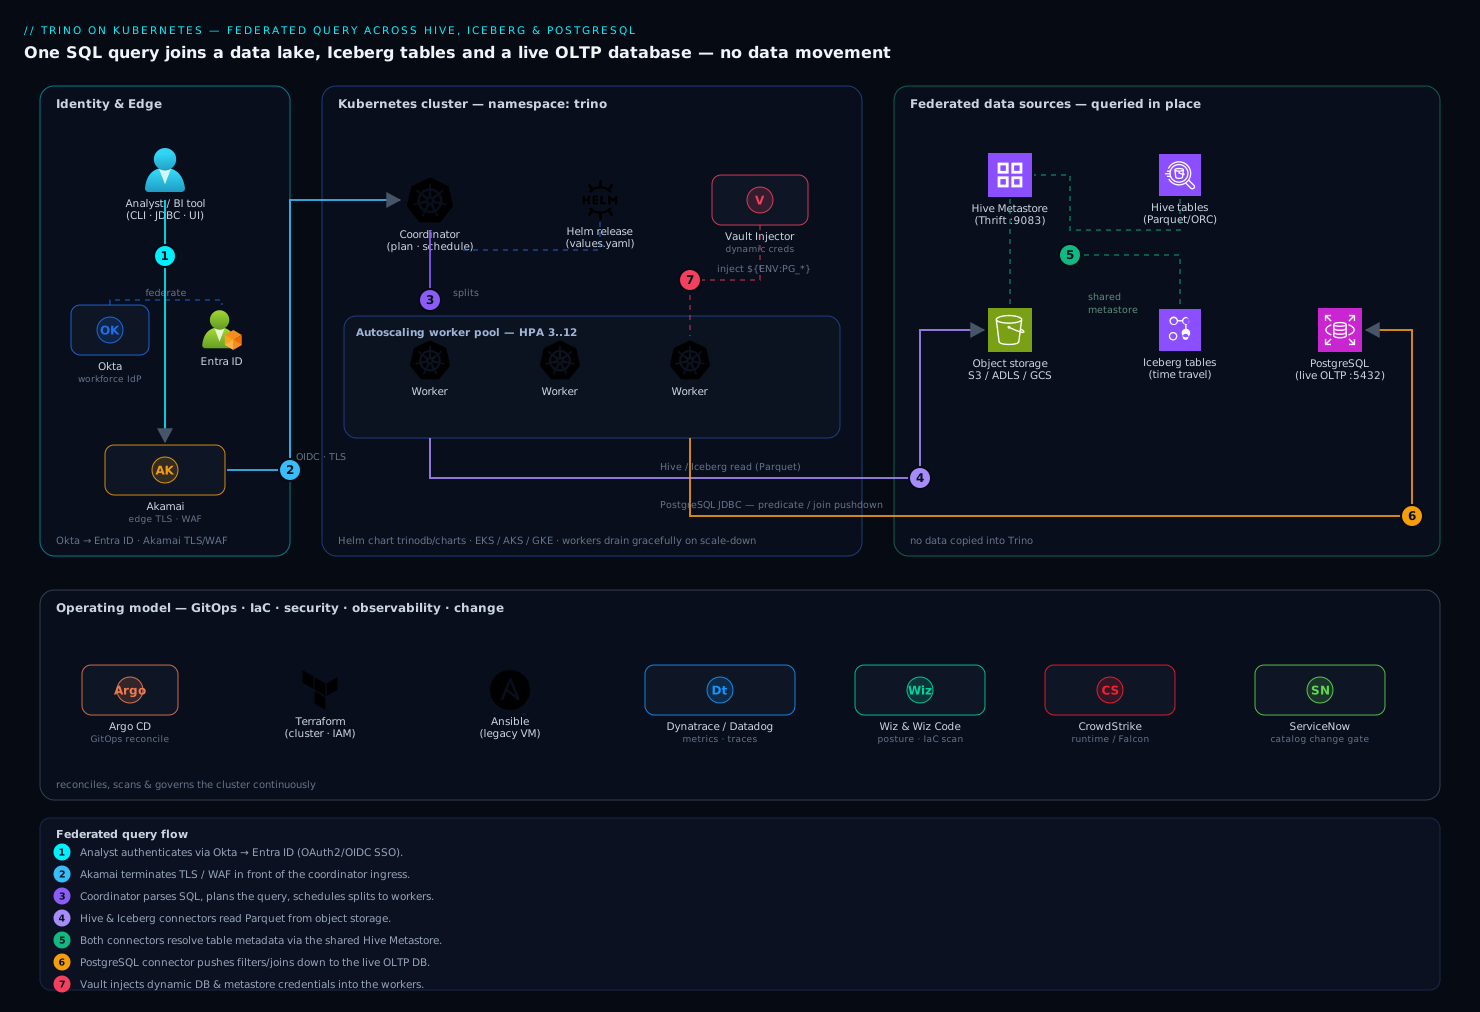
Reading the diagram left to right: a client authenticates once at the single coordinator, which parses the SQL and fans splits out across the autoscaling worker pool; each worker reaches through the Hive, Iceberg, and PostgreSQL connectors to read the three sources in place and streams partial results back for assembly — while Okta/Entra, Vault, Akamai, and Dynatrace wrap the engine as the operating model.
The cluster is a single coordinator Deployment and a pool of stateless worker Deployments. A client — BI tool, the CLI, or an application — authenticates at the coordinator, which parses the SQL, builds a distributed plan, and schedules splits across the workers. Each worker opens connections directly to the underlying systems through connectors: the Hive and Iceberg connectors read Parquet/ORC from object storage and resolve table metadata through the shared Hive Metastore; the PostgreSQL connector pushes filters down to the live OLTP database over JDBC. Nothing is copied into Trino — it is a query engine, not a store — so a three-way join streams partial results from three sources and assembles them in worker memory.
Around that core sits the operating model the platform team actually runs: Okta is the workforce IdP, federated to Microsoft Entra ID, so analysts get OAuth2 SSO into the coordinator UI and JDBC. HashiCorp Vault holds the PostgreSQL and metastore credentials and injects them as files via the Vault Agent sidecar, so no secret is ever written into a Helm value or a plain Kubernetes Secret. Akamai terminates TLS and provides WAF in front of the coordinator’s ingress. Dynatrace (or Datadog where a team standardizes there) scrapes the JMX/Prometheus metrics and traces query latency. Wiz and Wiz Code scan the cluster posture and the Terraform/Helm definitions in CI, CrowdStrike Falcon runs runtime protection on the nodes, ServiceNow is the change gate for catalog onboarding, and Argo CD reconciles the whole thing from Git, with Terraform owning the cluster and IAM and Ansible configuring any non-Kubernetes virtual appliances (a legacy metastore VM, for instance). We deploy the engine first, then layer those in.
How Trino plans and runs a federated query
Before the hands-on, understand what actually happens when you press Enter on a query — it is the difference between using Trino and operating it.
The lifecycle of one query. You submit SQL to the coordinator (CLI, JDBC, or the Web UI). The coordinator walks it through a pipeline:
- Parse — the SQL text becomes an abstract syntax tree.
- Analyze — every
catalog.schema.tablename and column is resolved against the connectors’ metadata (this is when a typo’d catalog fails fast), and types are checked. - Plan — a logical plan of relational operators (scan, filter, join, aggregate) is built.
- Optimize — a cost-based optimizer rewrites the plan: it reorders joins, prunes unused columns, and — crucially for federation — pushes work down into each source (more on this below).
- Distribute & schedule — the plan is cut into stages, and the coordinator schedules tasks onto workers.
- Execute — workers process splits in parallel, exchanging intermediate data, and stream results back to the coordinator, which returns them to the client.
The distribution hierarchy — stage → task → split → driver. This vocabulary is what the Web UI shows you and what every performance conversation uses:
- A stage is one phase of the distributed plan — for example “scan and filter the orders table,” or “hash-join the two inputs,” or “compute the final aggregate.” Stages form a tree; data flows up from leaf stages (which read sources) to the root stage (which returns to the client).
- A task is one stage running on one worker. A single stage usually runs as many tasks — one per participating worker — which is how a stage parallelizes.
- A split is a slice of a task’s input: a byte range of a Parquet file in S3, or a chunk of rows from a PostgreSQL scan. Splits are the atomic unit of parallelism; more splits (up to a point) means more workers can help.
- A driver runs a pipeline of operators (TableScan → Filter → Project → …) over the splits assigned to a task. This is the innermost loop where CPU is actually spent.
Exchanges move data between stages. When one stage’s output must feed the next — say, repartitioning both sides of a join so matching keys land on the same worker — Trino performs an exchange. Exchanges are broadcast (send a small table to every worker), partitioned (hash-shuffle both sides on the join key), or gather (funnel everything to one node for a final step). Exchanges are where network and memory pressure show up, and — as you will see in Going deeper — where fault-tolerant execution changes the game.
Pushdown is the federation superpower. The optimizer’s most important federation trick is to make each source do as much work as it can before the data ever reaches Trino. If you write ... FROM postgresql.public.orders WHERE order_total > 1000, Trino does not drag the whole table across the network and filter it — it hands order_total > 1000 to PostgreSQL as a WHERE clause and gets back only matching rows. The pushdowns that matter:
| Pushdown | What it does | Lake connectors (Hive/Iceberg) | JDBC connectors (PostgreSQL) |
|---|---|---|---|
| Projection | Read only the needed columns | Yes — columnar files skip other columns | Yes — narrow SELECT column list |
| Predicate | Apply WHERE at the source |
Partition + file/stat pruning | Yes — WHERE sent to PostgreSQL |
| Aggregation | COUNT/SUM/GROUP BY at the source |
Partial, via file statistics | Yes — GROUP BY pushed down |
| LIMIT / TopN | Stop early | Partial | Yes |
| JOIN | Join inside the source | Only within the same catalog | Yes, same catalog (join-pushdown.enabled=true) |
| Cross-catalog JOIN | Join across sources | Never pushed — done in Trino | Never pushed — done in Trino |
That last row is the single most important sentence in this lesson: a join between two different catalogs is always assembled inside Trino. The art of a fast federated join is therefore to push filters and projections down hard so each source returns as few, as narrow rows as possible, leaving Trino a small in-memory join instead of a cross-network table drag.
Who does what — coordinator vs worker. Keep this split straight and the rest of the lesson (autoscaling, graceful shutdown, HA) follows naturally:
| Coordinator | Worker | |
|---|---|---|
| How many | Exactly one active | Many; stateless; scale 0→N |
| Parse / analyze / plan SQL | Yes | No |
| Schedule tasks and splits | Yes | No |
| Read data through connectors | No (by default) | Yes |
| Run the joins and aggregations | Orchestrates only | Yes — the real compute |
| Serve the Web UI, JDBC, OAuth2 | Yes | No |
| Kubernetes object | One Deployment, replicas: 1 |
One Deployment + HPA/KEDA |
| Safe to lose mid-query? | No — the query fails | Yes, if it drains gracefully |
Trace the validation query through this model. The three-way join you will run at the end (hive.web.clickstream ⋈ iceberg.analytics.dim_customer ⋈ postgresql.public.orders) becomes three leaf stages — one reading each source, each with its predicates and projections pushed down — feeding join stages connected by partitioned exchanges on customer_id, then a partial aggregate on many workers, a final aggregate gathered onto fewer, and finally the sorted output streamed to the coordinator and back to you. No copy of any source table is ever materialized; only the narrow, filtered rows travel.
The three connectors, side by side
Steps 3–5 configure three connectors that look similar in the values file but behave very differently at runtime. Knowing the differences is how you predict performance and avoid nasty surprises:
| Aspect | Hive connector | Iceberg connector | PostgreSQL connector |
|---|---|---|---|
| Where the data lives | Object storage (Parquet/ORC) | Object storage (Parquet/ORC/Avro) | The live PostgreSQL database |
| Table metadata from | Hive Metastore (Thrift) | Metastore / REST / Glue / Nessie | PostgreSQL system catalogs over JDBC |
| How reads work | File listing + partition-directory pruning | Manifest-based file pruning, hidden partitioning | Rows over JDBC with predicate/join pushdown |
| Writes | INSERT/CTAS (directory commit) |
ACID: snapshots, MERGE, row-level delete |
INSERT/UPDATE/DELETE if the role allows |
| Time travel | No | Yes — FOR TIMESTAMP AS OF, $snapshots |
No |
| Schema evolution | Limited (add columns) | Full (add/drop/rename/reorder) | Whatever the source defines |
| Best for | Legacy lake tables, append-heavy logs | Modern lakehouse tables needing ACID + evolution | Small/medium operational data joined in place |
| Watch out for | Small-file and metastore-listing overhead | Writers and readers must share one catalog | Never table-scan the OLTP primary; keep the role read-only |
The key takeaway: Hive and Iceberg are two different lenses on files in object storage (which is why they can share one Hive Metastore, as Step 4 explains), while PostgreSQL is a live database you must treat gently — its throughput, not your worker count, caps how fast that leg of a join goes, and an un-pushed predicate can turn a friendly lookup into a table scan against production. For the operational database itself, Run PostgreSQL on Kubernetes with an operator covers keeping that source healthy and highly available.
1. Create the namespace and add the chart repo
Keep Trino in its own namespace so quotas, network policy, and RBAC are scoped cleanly.
kubectl create namespace trino

helm repo add trino https://trinodb.github.io/charts
helm repo update
helm search repo trino/trino --versions | head
Pin a chart version rather than tracking latest, so a helm upgrade is a deliberate act. Check what server image the chart defaults to and override it explicitly:
helm show values trino/trino | grep -A2 '^image:'
2. Author the base values file
The chart is driven by a values.yaml. Start with the coordinator/worker shape and resource requests; catalogs and autoscaling come next. Create trino-values.yaml:
image:
  repository: trinodb/trino
  tag: "447"            # pin a known-good Trino release

server:
  workers: 3            # initial floor; the HPA will manage the ceiling
  config:
    query.max-memory: "60GB"          # cluster-wide, across all workers
    query.max-memory-per-node: "12GB" # must be < worker JVM -Xmx

coordinator:
  jvm:
    maxHeapSize: "16G"
  resources:
    requests: { cpu: "2",  memory: "20Gi" }
    limits:   { cpu: "4",  memory: "20Gi" }

worker:
  jvm:
    maxHeapSize: "20G"
  resources:
    requests: { cpu: "6",  memory: "28Gi" }
    limits:   { cpu: "8",  memory: "28Gi" }

service:
  type: ClusterIP        # front it with an Ingress + Akamai, not a public LB
Two rules that bite people: set the JVM heap below the pod memory limit (leave headroom for off-heap and the OS, here 20 GiB heap under a 28 GiB limit), and keep query.max-memory-per-node comfortably under the worker heap. Mismatches here surface as OOMKilled workers under load, not as a clean error. If the chart’s values structure is unfamiliar, Helm fundamentals — charts, templates, values, releases is the primer.
3. Wire the Hive catalog (object storage over the metastore)
Catalogs are .properties files; the chart materializes them from a catalogs: map. Add the Hive catalog pointing at your metastore and lake. Append to trino-values.yaml:
catalogs:
  hive: |
    connector.name=hive
    hive.metastore.uri=thrift://hive-metastore.data.svc.cluster.local:9083
    fs.native-s3.enabled=true
    s3.region=ap-south-1
    s3.path-style-access=false
    hive.recursive-directories=true
    hive.storage-format=PARQUET
For S3, prefer the cluster’s workload identity (IRSA on EKS, Workload Identity on GKE/AKS) over static keys so there is no access key in the file at all. Where a static key is unavoidable, it comes from Vault, not from this YAML — see Step 8. If your lake is ADLS Gen2, swap the fs.native-s3.* lines for fs.native-azure.enabled=true and the Azure auth properties; for GCS use fs.native-gcs.enabled=true.
Line by line: connector.name=hive selects the connector (the value in the catalogs: map key, hive, is the catalog name you query); hive.metastore.uri is the Thrift address the connector calls to resolve table locations; fs.native-s3.enabled=true turns on the built-in S3 filesystem; hive.recursive-directories=true lets it walk partition subdirectories; hive.storage-format sets the default write format. None of these move data — they teach the connector where and how to read it.
4. Wire the Iceberg catalog (same metastore, table format that matters)
Iceberg gets its own catalog even though it shares the Hive Metastore — the connector is different and brings snapshot isolation, hidden partitioning, and time travel. Add to the catalogs: map:
  iceberg: |
    connector.name=iceberg
    iceberg.catalog.type=hive_metastore
    hive.metastore.uri=thrift://hive-metastore.data.svc.cluster.local:9083
    fs.native-s3.enabled=true
    s3.region=ap-south-1
    iceberg.file-format=PARQUET
Now a single Trino instance exposes the same physical metastore twice: hive.* reads the legacy Hive tables, iceberg.* reads the migrated Iceberg tables with FOR TIMESTAMP AS OF time-travel and $snapshots metadata. If you have no external metastore at all, the chart can deploy a bundled one for non-production, but for anything real run a dedicated metastore backed by its own database — a single shared metastore is the contract that lets both connectors agree on table locations. (iceberg.catalog.type can instead be rest, glue, or nessie if you run one of those Iceberg catalogs rather than a Hive Metastore — the rest of the connector is unchanged.)
5. Wire the PostgreSQL catalog (the live OLTP source)
This is the federation payoff — querying the operational database in place. Add to catalogs::
  postgresql: |
    connector.name=postgresql
    connection-url=jdbc:postgresql://orders-db.internal:5432/orders
    connection-user=${ENV:PG_USER}
    connection-password=${ENV:PG_PASSWORD}
    join-pushdown.enabled=true
    postgresql.array-mapping=AS_ARRAY
The ${ENV:...} references read environment variables the Vault sidecar will set (Step 8) — credentials never sit in the file. Use a read-only PostgreSQL role scoped to the tables analysts need; Trino’s predicate and join pushdown means it will hand WHERE clauses and even some joins back to PostgreSQL, so a misconfigured query will not table-scan your OLTP primary if you keep the role least-privileged and the application’s connection pool isolated. join-pushdown.enabled=true is the switch that lets Trino ask PostgreSQL to perform a join between two of its own tables at the source; a join to hive or iceberg, being cross-catalog, still assembles in Trino no matter what this flag says.
6. Install the chart and bring the cluster up
With the values complete, install:
helm install trino trino/trino \
  --namespace trino \
  --version 0.34.0 \
  --values trino-values.yaml

kubectl -n trino rollout status deploy/trino-coordinator --timeout=180s
kubectl -n trino get pods -l app.kubernetes.io/name=trino
You should see one coordinator pod and three worker pods Running. Confirm the coordinator registered all the workers and loaded the catalogs from inside the cluster:
kubectl -n trino exec -it deploy/trino-coordinator -- \
  trino --execute "SELECT * FROM system.runtime.nodes"

kubectl -n trino exec -it deploy/trino-coordinator -- \
  trino --execute "SHOW CATALOGS"
SHOW CATALOGS must list hive, iceberg, postgresql, plus the built-in system, jmx, and tpch. If a catalog is missing, a properties file failed to parse — check the coordinator logs with kubectl -n trino logs deploy/trino-coordinator | grep -i catalog.
7. Enable autoscaling on the worker pool
Workers are stateless, which makes them a clean fit for the Horizontal Pod Autoscaler. The chart can render an HPA, but be deliberate: scaling Trino workers is not like scaling a web app, because a worker that disappears mid-query kills the splits assigned to it. Enable graceful shutdown so a scaled-down worker drains in-flight work first. Add to trino-values.yaml:
server:
  workerExtraConfig: |
    shutdown.grace-period=2m   # drain running splits before exit

worker:
  terminationGracePeriodSeconds: 150  # must exceed shutdown.grace-period

autoscaling:
  enabled: true
  minReplicas: 3
  maxReplicas: 12
  targetCPUUtilizationPercentage: 65
Apply it and verify the HPA is live and reading metrics:
helm upgrade trino trino/trino -n trino \
  --version 0.34.0 --values trino-values.yaml

kubectl -n trino get hpa trino-worker
The TARGETS column must show a real percentage, not <unknown> — <unknown> means metrics-server is missing or the pods declared no CPU requests. For bursty, query-depth-driven scaling rather than blunt CPU, many teams later replace this HPA with a KEDA ScaledObject reading the queued-query count from Trino’s JMX, but CPU-based HPA is the correct, simple starting point. The Going deeper section shows both the tuned-scale-down HPA and the KEDA scale-to-zero variant.
8. Inject credentials with Vault (no secrets in YAML)
The PostgreSQL user and password, and any static lake key, come from HashiCorp Vault via the Vault Agent Injector — they are mounted as files and exported into the catalog’s environment, so nothing sensitive lives in trino-values.yaml or a plain Secret. Assuming the Vault Agent Injector is installed and a Kubernetes auth role trino is bound to the workers’ service account, annotate the worker pods:
worker:
  annotations:
    vault.hashicorp.com/agent-inject: "true"
    vault.hashicorp.com/role: "trino"
    vault.hashicorp.com/agent-inject-secret-pg: "database/creds/orders-ro"
    vault.hashicorp.com/agent-inject-template-pg: |
      {{- with secret "database/creds/orders-ro" -}}
      export PG_USER="{{ .Data.username }}"
      export PG_PASSWORD="{{ .Data.password }}"
      {{- end -}}
Using Vault’s database secrets engine (database/creds/orders-ro) means the PostgreSQL credential is dynamic and short-lived — Vault creates a role in PostgreSQL on demand and revokes it on lease expiry, so a leaked credential is useless within the hour. The rendered file is sourced before Trino starts, populating the ${ENV:PG_USER} / ${ENV:PG_PASSWORD} references from Step 5. Roll the workers after applying:
helm upgrade trino trino/trino -n trino --version 0.34.0 --values trino-values.yaml
kubectl -n trino rollout restart deploy/trino-worker
The mechanics of the Kubernetes auth role and dynamic database secrets are covered end to end in Configure Vault with OIDC/JWT Kubernetes auth for workload secrets.
9. Put SSO and TLS in front of the coordinator
Analysts should not share a static password. Enable OAuth2 on the coordinator and federate identity through Okta → Entra ID: Okta is the workforce IdP analysts already log into, federated to Microsoft Entra ID so the coordinator validates a standard OIDC token and group claims map to Trino roles. Configure the coordinator and front it with TLS:
coordinator:
  additionalExposedPorts: {}
  jvm:
    maxHeapSize: "16G"

server:
  coordinatorExtraConfig: |
    http-server.authentication.type=oauth2
    web-ui.authentication.type=oauth2
    http-server.authentication.oauth2.issuer=https://login.microsoftonline.com/<tenant-id>/v2.0
    http-server.authentication.oauth2.client-id=${ENV:OIDC_CLIENT_ID}
    http-server.authentication.oauth2.client-secret=${ENV:OIDC_CLIENT_SECRET}
    http-server.authentication.oauth2.scopes=openid,profile,email
    http-server.process-forwarded=true
TLS terminates at the ingress, with Akamai in front for WAF and edge TLS, so the coordinator trusts X-Forwarded-Proto (http-server.process-forwarded=true). The OIDC client secret is, again, a Vault-injected env var, never a literal. Map Entra group claims to Trino access with a file-based access-control or, at scale, Apache Ranger, so an analyst’s group decides which catalogs and schemas they can query — the Going deeper section builds that authorization layer out.
Resource groups: fair scheduling across teams
Out of the box, every query competes for the same worker capacity on a first-come basis — so one sprawling ETL aggregation can consume all the concurrency and memory and leave interactive BI dashboards spinning. Resource groups fix this by partitioning the cluster into named buckets with their own concurrency, memory, and queue limits, and routing each query to a bucket by who ran it or how it was tagged.
Resource-group decisions are made on the coordinator only (it is the scheduler), so this is coordinator configuration. It is two files: a small properties file that selects the file-based manager, and a JSON file that defines the groups and the selectors that route queries into them.
{
  "rootGroups": [
    {
      "name": "global",
      "softMemoryLimit": "80%",
      "hardConcurrencyLimit": 100,
      "maxQueued": 1000,
      "schedulingPolicy": "weighted_fair",
      "subGroups": [
        { "name": "bi",  "softMemoryLimit": "40%", "hardConcurrencyLimit": 40, "maxQueued": 200, "schedulingWeight": 3 },
        { "name": "etl", "softMemoryLimit": "50%", "hardConcurrencyLimit": 10, "maxQueued": 500, "schedulingWeight": 1 }
      ]
    }
  ],
  "selectors": [
    { "group": "global.etl", "source": "etl-pipeline" },
    { "group": "global.etl", "user": "svc_airflow" },
    { "group": "global.bi",  "userGroup": "bi_analysts" },
    { "group": "global.bi" }
  ]
}
Read it top-down: the global root caps the whole cluster at 100 concurrent queries and 80% of memory; underneath, bi gets a higher scheduling weight (3 vs 1) and more concurrency (40 vs 10) so interactive dashboards stay snappy, while etl is allowed a deep queue (500) because batch jobs tolerate waiting. Selectors are evaluated in order, first match wins — anything from the etl-pipeline source or the svc_airflow user lands in global.etl, members of the bi_analysts group land in global.bi, and the trailing catch-all sweeps everything else into bi.
Wire both files onto the coordinator through the chart. The exact value key is chart-version specific — confirm with helm show values trino/trino — but the current chart renders extra coordinator config files from a map:
coordinator:
  additionalConfigFiles:
    resource-groups.properties: |
      resource-groups.configuration-manager=file
      resource-groups.config-file=/etc/trino/resource-groups.json
    resource-groups.json: |
      {
        "rootGroups": [
          {
            "name": "global",
            "softMemoryLimit": "80%",
            "hardConcurrencyLimit": 100,
            "maxQueued": 1000,
            "schedulingPolicy": "weighted_fair",
            "subGroups": [
              { "name": "bi",  "softMemoryLimit": "40%", "hardConcurrencyLimit": 40, "maxQueued": 200, "schedulingWeight": 3 },
              { "name": "etl", "softMemoryLimit": "50%", "hardConcurrencyLimit": 10, "maxQueued": 500, "schedulingWeight": 1 }
            ]
          }
        ],
        "selectors": [
          { "group": "global.etl", "source": "etl-pipeline" },
          { "group": "global.etl", "user": "svc_airflow" },
          { "group": "global.bi",  "userGroup": "bi_analysts" },
          { "group": "global.bi" }
        ]
      }
After a helm upgrade, a client’s session tag drives its group — for example the Trino CLI’s --source etl-pipeline (or an equivalent JDBC source property) routes into global.etl. Confirm routing with the built-in metadata table:
SELECT query_id, resource_group_id, state
FROM   system.runtime.queries
ORDER BY created DESC
LIMIT 10;
The resource_group_id column tells you exactly which bucket caught each query — the fastest way to debug a selector that is not matching.
Validation
Prove federation actually works — the whole point is one query across three sources. From the Trino CLI against the coordinator:
trino --server https://trino.internal.example.com --catalog iceberg --schema analytics
Run a three-way federated join: Iceberg dimension, Hive clickstream fact, live PostgreSQL orders, no data movement:
SELECT  d.customer_segment,
        count(*)              AS sessions,
        sum(ord.order_total)  AS revenue
FROM        hive.web.clickstream        c
JOIN        iceberg.analytics.dim_customer d  ON c.customer_id = d.customer_id
JOIN        postgresql.public.orders       ord ON ord.customer_id = d.customer_id
WHERE   c.event_date = DATE '2026-06-10'
GROUP BY    d.customer_segment
ORDER BY    revenue DESC;
Then confirm the engine pushed work down rather than dragging everything into Trino — check the plan and the per-source split counts:
EXPLAIN (TYPE DISTRIBUTED)
SELECT * FROM postgresql.public.orders WHERE order_total > 1000;
You want to see the order_total > 1000 predicate appear as a pushed-down filter on the PostgreSQL TableScan, not a full scan filtered in Trino. Finally, scale the workers under load and watch the HPA react:
kubectl -n trino get hpa trino-worker -w
# in another shell, run a heavy aggregation; REPLICAS should climb toward maxReplicas
For golden-path monitoring, point Dynatrace (OneAgent on the node pool, or the Prometheus scrape of Trino’s /metrics) — or Datadog with its Trino integration where a team standardizes there — at the coordinator. Track query latency, queued-query count, worker count, and failed-query rate. A guardrail breach (a query spilling to disk, a sustained 5xx on the coordinator) auto-raises a ServiceNow incident so on-call gets a ticket, not just a log line.
Going deeper
Fault-tolerant execution and exchange spooling
By default Trino runs queries pipelined: intermediate results stream directly worker-to-worker and are never persisted, which is fast but brittle — lose one worker mid-query (a spot reclaim, an OOM, a node drain) and the entire query fails and must be retried from scratch. For long ETL queries that is expensive. Fault-tolerant execution (FTE) trades a little latency for resilience: intermediate data is checkpointed to an external exchange manager (a “spooling” store like S3), so if a task dies the coordinator reschedules just that task from the last checkpoint instead of failing the whole query.
You choose a retry-policy:
retry-policy=QUERY— retry the whole query on failure. Good for many short, interactive queries.retry-policy=TASK— retry individual failed tasks against the spooled exchange data. This is what makes long queries survive worker loss, and it is the policy that pairs with spot workers.
TASK mode requires an exchange manager. The chart renders exchange-manager.properties from its values; again, confirm the exact keys with helm show values:
server:
  coordinatorExtraConfig: |
    retry-policy=TASK
  workerExtraConfig: |
    retry-policy=TASK
  exchangeManager:
    name: filesystem
    baseDir: s3://trino-exchange-spooling
additionalExchangeManagerProperties:
  - "exchange.s3.region=ap-south-1"
  - "exchange.encryption-enabled=true"
The trade-offs to weigh: spooling to S3 adds I/O and latency, so FTE is a win for expensive batch/ETL queries and often not worth it for sub-second dashboard queries — many teams run a separate FTE-enabled cluster for ETL and a pipelined cluster for BI, or split the policy across clusters serving different resource groups. Encrypt the exchange (exchange.encryption-enabled=true) because intermediate data can contain the same sensitive rows as your tables. And note that FTE makes aggressive worker autoscaling and spot instances genuinely safe — a reclaimed worker costs a task retry, not a failed query.
Memory management and spill
Every worker’s Java heap is a hard budget, and Trino tracks two kinds of memory: user memory (what a query’s operators reserve — join hash tables, aggregation state) and system memory (buffers, exchanges). The knobs from Step 2 draw the boundaries:
query.max-memory-per-node— the ceiling a single query may use on one worker. Must sit comfortably below the worker heap.query.max-memory— the ceiling a single query may use across the whole cluster.memory.heap-headroom-per-node— memory reserved off-budget for the JVM itself (GC, code cache). If you forget this, workers OOM even though Trino thinks it is under budget.
When a query would exceed its per-node limit, Trino has three responses: fail it, kill it under the low-memory killer policy, or — for blocking operators like joins, aggregations, and sorts — spill the overflow to local disk and continue more slowly:
worker:
  additionalVolumes:
    - name: trino-spill
      emptyDir: {}
  additionalVolumeMounts:
    - name: trino-spill
      mountPath: /data/trino/spill
  workerExtraConfig: |
    spill-enabled=true
    spiller-spill-path=/data/trino/spill
    memory.heap-headroom-per-node=6GB
    spill-compression-codec=LZ4
Spill turns “query failed: exceeded memory limit” into “query ran slower” — a good trade for the occasional heavy report, a bad one as a steady-state crutch (disk is orders of magnitude slower than RAM). On Kubernetes, back spiller-spill-path with a fast local volume — an emptyDir on NVMe-backed nodes, or a local PV — never a networked volume, whose latency defeats the purpose. And keep the query.low-memory-killer.policy (default total-reservation-on-blocked-nodes) so that when the cluster genuinely runs out, Trino kills the one greediest query rather than letting every query thrash.
Worker autoscaling and scale-to-zero
Step 7’s CPU HPA is the correct starting point, but Trino’s stateless workers invite two refinements. First, shape the scale-down so the autoscaler never yanks capacity faster than queries can drain — a raw autoscaling/v2 HPA with a behavior block removes at most one worker every two minutes and waits out a five-minute stabilization window:
apiVersion: autoscaling/v2
kind: HorizontalPodAutoscaler
metadata:
  name: trino-worker
  namespace: trino
spec:
  scaleTargetRef:
    apiVersion: apps/v1
    kind: Deployment
    name: trino-worker
  minReplicas: 3
  maxReplicas: 12
  metrics:
    - type: Resource
      resource:
        name: cpu
        target:
          type: Utilization
          averageUtilization: 65
  behavior:
    scaleDown:
      stabilizationWindowSeconds: 300
      policies:
        - type: Pods
          value: 1
          periodSeconds: 120
Second, CPU is a lagging signal for a query engine — a queue of heavy queries can form before CPU climbs. Teams that want capacity to track actual demand replace the HPA with a KEDA ScaledObject driven by Trino’s own queued-query metric, which also unlocks scale-to-zero for dev, batch, or off-hours clusters:
apiVersion: keda.sh/v1alpha1
kind: ScaledObject
metadata:
  name: trino-worker
  namespace: trino
spec:
  scaleTargetRef:
    apiVersion: apps/v1
    kind: Deployment
    name: trino-worker
  minReplicaCount: 0          # scale the pool to zero when no queries are queued
  maxReplicaCount: 12
  cooldownPeriod: 300         # wait 5m after the last query before scaling in
  pollingInterval: 15
  triggers:
    - type: prometheus
      metadata:
        serverAddress: http://prometheus-operated.monitoring.svc:9090
        query: sum(trino_execution_QueryManager_QueuedQueries)
        threshold: "1"
        activationThreshold: "0"
Scale-to-zero has one honest caveat: with no warm workers, the first query after an idle period must wait for a worker pod to schedule, pull its image, and register — seconds to a minute. Mitigate it by keeping the image pre-pulled on a warm node, setting a modest activationThreshold, or floating a single always-on worker for latency-sensitive clusters while letting the burst pool go to zero. (The metric name depends on how your Prometheus JMX exporter maps Trino’s QueryManager MBean — confirm the exact series in your Prometheus before trusting the trigger.) For the full autoscaling picture — HPA vs KEDA vs Karpenter node scaling — see Kubernetes autoscaling: HPA, KEDA, Karpenter.
Access control and catalog-level authorization
Authentication (Step 9) proves who a user is; authorization decides what they may touch. Trino’s built-in file-based access control maps users and their IdP groups to catalog-, schema-, and table-level rules — the natural companion to the Entra group claims you wired into OAuth2. Enable it on the coordinator and point it at a rules file:
# added to the coordinator's config.properties
access-control.name=file
security.config-file=/etc/trino/access-control.json
{
  "catalogs": [
    { "user": "admin",          "catalog": ".*",           "allow": "all" },
    { "group": "data_platform", "catalog": ".*",           "allow": "all" },
    { "group": "bi_analysts",   "catalog": "hive|iceberg", "allow": "read-only" },
    { "group": "bi_analysts",   "catalog": "postgresql",   "allow": "read-only" }
  ],
  "schemas": [
    { "group": "bi_analysts", "catalog": "postgresql", "schema": "public", "owner": false }
  ]
}
Rules are evaluated top-down, first match wins, and default to deny: an analyst in bi_analysts gets read-only on the lake catalogs and the public schema of PostgreSQL, and nothing else — they cannot INSERT into the OLTP source even though the connector technically could. This is defense in depth on top of the read-only PostgreSQL role from Step 5: even a compromised query path is boxed in by the engine’s own rules. When rule sprawl outgrows a JSON file — column masking, row filtering, audited policy changes across many teams — graduate to Apache Ranger via the Ranger access-control plugin, which externalizes the same decisions into a governed, audited policy store. Because Trino evaluates access control at plan time, an unauthorized catalog reference fails the query before a single split runs.
Rollback and teardown
Because Trino stores nothing itself, rollback is clean — there is no engine data to lose, only configuration. To revert a bad config change to the previous Helm release:
helm history trino -n trino
helm rollback trino <previous-revision> -n trino
kubectl -n trino rollout status deploy/trino-coordinator --timeout=180s
To tear the whole engine down without touching any underlying source data (the lake, the metastore, and PostgreSQL are all external and untouched):
helm uninstall trino -n trino
kubectl delete namespace trino
Revoke the Vault role and its leases as part of decommissioning so no dynamic PostgreSQL credential outlives the cluster:
vault lease revoke -prefix database/creds/orders-ro
In a GitOps setup the durable rollback is reverting the commit and letting Argo CD reconcile, with Terraform removing any cluster-level IAM it created; that keeps the change auditable instead of a one-off helm command nobody recorded.
Common pitfalls
- Heap larger than the pod limit. If JVM
-Xmxmeets or exceeds the container memory limit, workers get OOMKilled mid-query with no clean error. Keep heap well below the limit (we used 20 GiB heap under a 28 GiB limit). - Workers scaled down mid-query. Without
shutdown.grace-periodand a matchingterminationGracePeriodSeconds, the HPA kills a worker that still owns splits and the query fails. Always pair them. - Catalog file typos. A malformed
.propertiesvalue drops the catalog silently — it just will not appear inSHOW CATALOGS. Grep the coordinator log for the parse error. - Missing metrics-server. The HPA shows
<unknown>targets and never scales. Install metrics-server and confirm every Trino pod declares CPU requests. - No DNS/network path to the metastore or PostgreSQL. A connector that cannot reach its backend leaves queries hanging until timeout, not failing fast. Validate
9083and5432reachability from a worker pod before blaming Trino. - One metastore per connector. Pointing Hive and Iceberg at different metastores breaks the shared-table-location assumption; both must use the same Thrift URI.
- Predicate pushdown disabled. If you forget
join-pushdown.enabled=true, federated joins pull whole tables into Trino — slow, and hard on the OLTP source. Verify withEXPLAIN.
Common beginner mistakes
These are misconceptions rather than symptoms — get the mental model right and a whole class of problems never appears:
- “Trino stores my data.” It does not. Trino is a query engine, not a database — it persists nothing between queries. If every worker pod vanished, you would lose zero data, only in-flight queries. The mental model is a SQL brain that borrows data at query time and hands it back.
- “A connector and a catalog are the same thing.” A connector is the reusable plugin for a kind of system; a catalog is one configured use of it. You can run two PostgreSQL catalogs —
orders_dbandbilling_db— from the same PostgreSQL connector, each pointing at a different server. Naming a catalog after its connector (postgresql) is convention, not a rule. - “A cross-catalog join gets pushed into the database.” No. Only same-catalog joins push down. A
hive⋈postgresqljoin is always assembled inside Trino. The performance lever is pushing filters and projections down so each source returns few, narrow rows for Trino to join cheaply. - “More workers always means faster queries.” Only if the query actually parallelizes and is not bottlenecked elsewhere. A leg that scans PostgreSQL is capped by that database’s throughput; a final aggregation or
ORDER BYmay gather onto a single node. Doubling workers does nothing for a query whose slow part is one JDBC source. - “The coordinator does the heavy lifting.” The coordinator plans and schedules; the workers read data and run the joins and aggregations. Size and scale accordingly — one modest-but-reliable coordinator, a fleet of elastic workers.
- “A bigger heap means fewer OOMKills.” Only up to the pod’s memory limit. Set
-Xmxat or above the container limit and the Linux kernel OOM-kills the JVM regardless of what Trino thinks. Heap must sit below the limit, withmemory.heap-headroom-per-nodereserved for the JVM itself. - “Hive and Iceberg each need their own metastore.” For tables you want both connectors to agree on, they should share one Hive Metastore — that shared metadata is the contract that lets
hive.*andiceberg.*resolve the same table locations. - “Autoscaling workers is just like autoscaling a web app.” A web pod can be killed instantly; a Trino worker owns query splits. Without
shutdown.grace-periodand a matchingterminationGracePeriodSeconds, scaling in kills running queries. Workers must drain before they exit.
Security notes
The cluster is identity-gated by construction: OAuth2 through Okta federated to Entra ID, no shared passwords, and group-claim-driven access control (file-based, or Apache Ranger at scale) deciding which catalogs and schemas each analyst can touch. Database and lake credentials come exclusively from HashiCorp Vault — dynamic, short-lived, and never written into a manifest or plain Secret. The PostgreSQL role is read-only and least-privileged so federation cannot mutate the OLTP source. Akamai provides edge TLS and WAF in front of the coordinator ingress; in-cluster, enable internal TLS and a NetworkPolicy that only permits coordinator↔worker and worker↔backend traffic. Wiz runs continuous cluster posture and sensitive-data-exposure scanning while Wiz Code scans the Terraform and Helm definitions in the pull request before they merge; CrowdStrike Falcon sensors on the node pool provide runtime threat detection feeding the SOC; and every new catalog passes a ServiceNow change approval before it goes live, giving data governance a documented gate. Where a legacy virtual appliance still fronts the Hive Metastore, Ansible hardens and patches it on the same cadence as the rest of the estate.
Cost notes
Trino’s economics come from not copying data — you delete the nightly ETL jobs and the duplicate storage they produced, and you query the lake and the OLTP database in place. The dominant running cost is the worker compute, which is exactly why the HPA matters: floor the pool at a modest minReplicas for steady interactive load and let it burst to maxReplicas only under heavy aggregation, then scale back. On cloud node groups, schedule workers on spot/preemptible instances — they are stateless and the shutdown.grace-period already handles eviction gracefully (and fault-tolerant execution makes the reclaim a task retry, not a failed query) — for a large discount on the burst capacity, while the coordinator stays on on-demand. Right-size the JVM heaps to the node so you are not paying for memory the workers never use, and tune query.max-memory so a single runaway query cannot force the whole cluster to scale. Pipe worker-count and query-cost telemetry to Dynatrace or Datadog for a chargeback view, and let Argo CD plus Terraform keep the footprint declared in Git so an idle environment can be scaled to zero between business hours instead of running an empty cluster overnight.
Practice challenges
Work these against your own cluster. Each solution says what to run and, in one line, why.
1. (Beginner) Confirm the cluster is healthy and list every catalog. Prove the coordinator sees its workers and loaded all three catalogs.
<details> <summary>Solution</summary>
SELECT count(*) FROM system.runtime.nodes WHERE state = 'active';
SHOW CATALOGS;
system.runtime.nodes is Trino’s self-describing view of the cluster; SHOW CATALOGS must list hive, iceberg, postgresql plus the built-ins system, jmx, and tpch. Why: a missing catalog here means a .properties file failed to parse — check the coordinator log.
</details>
2. (Beginner) Add a MySQL catalog alongside the existing three. A new team keeps reference data in MySQL; expose it without touching the running catalogs.
<details> <summary>Solution</summary>
Append to the catalogs: map in trino-values.yaml and helm upgrade:
  mysql: |
    connector.name=mysql
    connection-url=jdbc:mysql://refdata.internal:3306
    connection-user=${ENV:MYSQL_USER}
    connection-password=${ENV:MYSQL_PASSWORD}
Why: every connector follows the same connector.name + connection-properties shape, so adding a source is additive config, not a redeploy of the engine.
</details>
3. (Intermediate) Prove predicate pushdown into PostgreSQL.
Show that a WHERE on a PostgreSQL table is executed at the source, not in Trino.
<details> <summary>Solution</summary>
EXPLAIN (TYPE DISTRIBUTED)
SELECT * FROM postgresql.public.orders WHERE order_total > 1000;
Look for the predicate attached to the PostgreSQL TableScan (a pushed-down constraint / narrowed row estimate) rather than a FilterNode sitting above a full scan. Why: if the filter shows up in Trino instead of on the scan, you are dragging the whole table over JDBC — verify pushdown before blaming query speed.
</details>
4. (Intermediate) Keep ETL from starving interactive BI. Route batch jobs and dashboard users into separate resource groups so a heavy ETL query cannot consume all concurrency.
<details> <summary>Solution</summary>
Configure file-based resource groups with a high-weight bi subgroup and a deep-queue etl subgroup, and select on user/source (the JSON in Resource groups: fair scheduling across teams above). Verify routing:
SELECT query_id, resource_group_id, state
FROM system.runtime.queries ORDER BY created DESC LIMIT 10;
Why: per-group concurrency and memory limits turn “one query hogs the cluster” into “each workload gets a guaranteed slice.” </details>
5. (Advanced) Make a long query survive a worker dying mid-flight. A nightly ETL query keeps failing when spot workers are reclaimed. Make individual task failures recoverable.
<details> <summary>Solution</summary>
Enable fault-tolerant execution with retry-policy=TASK and an S3 exchange manager (the Going deeper values). Now a lost worker triggers a task retry from spooled exchange data instead of a whole-query failure. Why: TASK retries plus spooling are precisely what make spot/preemptible workers safe for long queries.
</details>
6. (Advanced) Scale the worker pool to zero when idle — and explain the first-query cost. An off-hours reporting cluster should cost nothing when no one is querying.
<details> <summary>Solution</summary>
Replace the CPU HPA with a KEDA ScaledObject (Prometheus trigger on queued queries, minReplicaCount: 0, cooldownPeriod: 300). Caveat to state: with zero warm workers the first query waits for a pod to schedule, image-pull, and register — seconds to a minute. Mitigate with a pre-pulled image, an activationThreshold, or one always-on worker. Why: queued-query scaling tracks real demand (CPU lags), and scale-to-zero eliminates idle spend at the cost of a cold start on the first query.
</details>
Glossary
- Trino — an open-source distributed SQL query engine (formerly PrestoSQL). Runs SQL over many data sources; stores no data of its own.
- Federated query — a single query that reads (and joins) data from multiple independent systems without first copying it into one place.
- Coordinator — the single “brain” node: parses SQL, plans and optimizes, schedules work, and serves the Web UI / JDBC / results.
- Worker — a stateless “muscle” node that reads from sources through connectors and runs the joins and aggregations in parallel. Scaled 0→N on Kubernetes.
- Connector — a plugin that teaches Trino how to talk to one kind of system (Hive, Iceberg, PostgreSQL, Kafka, …).
- Catalog — a named, configured instance of a connector (e.g. the
postgresqlcatalog points the PostgreSQL connector at your orders DB). Tables are addressed ascatalog.schema.table. - Schema — a namespace within a catalog (often a database or dataset); the middle part of
catalog.schema.table. - Split — an atomic slice of a table’s data (a file range, a row chunk) that one worker processes. The unit of parallelism.
- Stage — one phase of a distributed query plan (scan, join, aggregate). Stages form a tree joined by exchanges.
- Task — one stage running on one worker; a stage parallelizes as many tasks.
- Driver / operator — the innermost execution units inside a task; operators (TableScan, Filter, Join…) run in a pipeline over splits.
- Exchange — the movement of intermediate data between stages/workers: broadcast, partitioned (hash-shuffle), or gather.
- Pushdown — having a source do work (filter, project, aggregate, join, limit) before data reaches Trino. The core federation optimization.
- Hive Metastore — a metadata service (Thrift, port 9083) that maps table names to their file locations and schemas; shared by the Hive and Iceberg connectors here.
- Iceberg — an open table format over object storage adding ACID snapshots, time travel, hidden partitioning, and full schema evolution.
- Parquet — a columnar file format that lets connectors read only the columns a query needs (projection pushdown).
- Resource group — a named bucket of concurrency/memory/queue limits that queries are routed into by user or source, for fairness across workloads.
- Fault-tolerant execution (FTE) — a mode (
retry-policy=TASK/QUERY) that checkpoints intermediate data to an exchange manager so failed work is retried instead of failing the whole query. - Exchange manager / spooling — the external store (e.g. S3) that FTE writes intermediate exchange data to.
- Spill — writing a query’s overflow memory (joins, aggregations, sorts) to local disk to finish a query that would otherwise exceed its memory limit.
- Graceful shutdown / drain — letting a worker finish its in-flight splits (
shutdown.grace-period) before it exits, so scaling in or eviction does not fail queries. - HPA / KEDA — the Horizontal Pod Autoscaler scales on CPU/memory; KEDA scales on external/event metrics (like queued queries) and enables scale-to-zero.
- JDBC — the Java database connection protocol Trino’s relational connectors (PostgreSQL, MySQL) use to reach a source, and one way clients reach Trino.
- OAuth2 / OIDC — the token-based SSO standard the coordinator uses to authenticate analysts via Okta federated to Entra ID.
- Dynamic secret (Vault) — a short-lived, on-demand credential Vault creates in the source (e.g. a temporary PostgreSQL role) and auto-revokes on lease expiry.
- IRSA / Workload Identity — cloud mechanisms that give a pod’s service account IAM permissions (to object storage) without static keys.