Every engineer eventually meets the wall. A metric dashboard is glowing amber — CPU at 80%, latency doubled, disk busy — and it tells you that the box is unwell without a single clue as to why. What you do not have is the one function, the one syscall, the one disk that is actually eating the machine. Restarting the service sometimes helps and teaches you nothing; adding more logging means a deploy, and the problem is happening now. This is the exact gap that deep observability closes: the ability to ask a running kernel a precise question — “which process is opening files fastest?”, “what is the distribution of disk-I/O latency?” — and get a quantified answer in seconds, live, without recompiling or restarting anything.
For most of Linux’s history this was a dark art reserved for kernel developers with printk and a serial console. Two things changed that. First, the kernel grew rich, stable event sources — tracepoints, kprobes, perf events — that expose almost everything it does. Second, eBPF turned the kernel into a safe, programmable data plane: you can now load a tiny, verified program that runs in kernel context at one of those events, aggregates the answer in-kernel, and streams back a finished histogram — at a few percent overhead, on a production box, without the risk of a kernel panic. The tools in this lesson — perf, ftrace, bcc, and especially bpftrace — are the interfaces to that machinery.
This is an expert lesson and it assumes you have already lived the pain — process states, top/ps, and the idea that a load average is a queue, not a percentage. What you leave with is not a tour but a method: the mental model of what the kernel exposes and which tool reads it, the fluency to drive perf and bpftrace from memory, and a repeatable drill-down — a perf top glance, to a targeted bcc tool, to a bespoke bpftrace one-liner — that takes you from “the box is slow” to “this function, on this device, for this reason” faster than you can open a ticket. And one warning will repeat, because it matters: tracing is not free, and a careless probe on a hot path is itself an outage. We always scope tightly and measure.
Why this matters: metrics tell you what, tracing tells you why
There are three classic pillars of observability, and beginners routinely reach for the wrong one. Metrics are cheap, pre-aggregated numbers over time — CPU%, requests/sec, queue depth. They are perfect for detection (“something changed at 02:14”) and useless for root cause (they cannot tell you which code path caused it). Logs are discrete events your software chose to emit; they are only as good as the log line someone remembered to write, and the one you need is never there. Tracing — the subject of this lesson — is the ability to record events the software did not choose to emit, by instrumenting the running system itself: every open(), every scheduler switch, every disk completion, every call to a specific kernel function, with its arguments and latency.
The distinction is the entire reason this lesson exists. When a metric goes bad, you do not add a metric — you trace to find the cause, fix it, and then maybe add a metric to catch it next time. Here is the mental model laid out side by side:
| Pillar | What it is | Answers | Cost | Cardinality | When you reach for it |
|---|---|---|---|---|---|
| Metrics | Pre-aggregated numbers over time (counters, gauges, histograms) | What changed, and when | Very low (constant) | Low — labels must be bounded | Detection, alerting, dashboards, SLOs |
| Logs | Discrete, timestamped events the app emits | What the app decided to tell you | Medium–high (per event) | High but only what’s logged | Audit trails, errors with context |
| Tracing (this lesson) | Events captured by instrumenting the running system | Why — the exact code path, arg, latency | Low–high (you control scope) | Arbitrary — you choose the key | Root cause, “what is this box doing?” |
| Distributed tracing | Spans stitched across services (OpenTelemetry) | Where in a request path the time went | Medium (sampled) | Per-request | Latency across microservices |
Tracing here means system tracing — kernel and application events on a single host — not the distributed request-tracing of OpenTelemetry (a related idea covered elsewhere in the observability world). They complement each other: distributed tracing tells you which service is slow; system tracing tells you why that service, on that box, is slow.
The tracing toolmap: Brendan Gregg’s landscape
The single most useful orientation to Linux tracing is the “toolmap” popularised by Brendan Gregg — a diagram of the kernel with each tracing tool drawn where it plugs in. You do not need the picture memorised; you need its lesson: the classic tools each read one narrow slice, while perf and eBPF span the whole board. Keep this table as your map of the territory:
| Tool | Era / mechanism | Observes | Overhead | Best at |
|---|---|---|---|---|
vmstat / iostat / mpstat / sar |
Counter readers (/proc, /sys) |
Per-resource summary counters | Negligible | The 60-second first glance |
top / htop / pidstat |
/proc samplers |
Per-process CPU/mem | Negligible | Which process, roughly |
strace |
ptrace syscall interception |
One process’s syscalls, verbatim | Very high (10–100×) | Debugging one process, not production |
ltrace |
Library-call interception | Library/function calls of one process | Very high | App-level call debugging |
perf |
Sampling + tracepoints + PMCs | CPU profiles, counters, events (whole system) | Low (sampling) | Profiling, flame graphs, PMCs |
ftrace |
Built-in function/event tracer | Kernel function flow & tracepoints | Low–medium | “What did the kernel do, in order” |
| bcc / bpftrace (eBPF) | Verified in-kernel programs | Almost anything, aggregated in-kernel | Low (you scope it) | Custom questions, latency histograms |
⚠️ Note the row that ends careers: strace multiplies a process’s syscall cost by ten to a hundred times because every syscall traps out to the tracer twice. It is a superb debugging tool on a test box and a loaded gun on production — a single strace -f -p <pid> on a busy database has caused the very outage it was meant to diagnose. The eBPF equivalents (bpftrace, bcc’s syscount, trace) exist precisely so you can ask the same questions at a fraction of the cost.
The event sources: what the kernel actually exposes
Every tool above ultimately hooks one of a small, finite set of event sources. Internalising this list is the highest-leverage thing in the lesson, because once you know what the kernel exposes, every tool becomes “just an interface to these,” and you stop memorising tools and start composing them.
There are two families. Static instrumentation is placed by developers and is stable: the maintainers promise the event exists and its fields do not change — these are tracepoints (in the kernel) and USDT probes (in user programs). Dynamic instrumentation is placed by you, at runtime, anywhere: kprobes can attach to (almost) any kernel function, and uprobes to any user-space function, with no prior cooperation from the code — but nothing promises that function will still exist in the next kernel. The trade is stability versus reach.
| Event source | Static/Dynamic | Where it fires | Attach by | Stable API? | Example |
|---|---|---|---|---|---|
| Tracepoint | Static | Curated points in kernel code | Name | Yes — maintained | sched:sched_switch, syscalls:sys_enter_openat |
| kprobe | Dynamic | Entry of (almost) any kernel function | Function name | No — can vanish | kprobe:vfs_read, kprobe:tcp_sendmsg |
| kretprobe | Dynamic | Return of a kernel function | Function name | No | kretprobe:vfs_read → capture retval/latency |
| uprobe | Dynamic | Entry of a user-space function | Binary path + symbol | No | uprobe:/bin/bash:readline |
| uretprobe | Dynamic | Return of a user-space function | Binary + symbol | No | uretprobe:libc:malloc |
| USDT | Static | Dev-placed markers in user binaries | Provider:name | Yes (if shipped) | usdt:libc:..., usdt:/usr/bin/mysqld:query__start |
| perf event (PMC) | Hardware | CPU performance counters | Event name | Firm | cycles, instructions, cache-misses, LLC-load-misses |
| perf event (software) | Kernel | Kernel-maintained counters | Event name | Yes | context-switches, page-faults, cpu-clock |
| Timed sample | perf/eBPF | A timer, N times/sec per CPU | Frequency | Yes | profile:hz:99 — the basis of CPU flame graphs |
A few things become obvious once this is in your head. Prefer tracepoints over kprobes whenever a suitable one exists — they are the stable, documented contract, so your bpftrace script keeps working across kernel upgrades; drop to a kprobe only when no tracepoint covers what you need. kretprobes are how you measure latency: you stamp the time at the kprobe (entry) and subtract at the kretprobe (return). Sampling at 99 Hz (not 100) is a deliberate trick — an odd frequency avoids sampling in lockstep with periodic kernel activity that runs at round numbers, which would bias your profile. And the whole reason fentry/fexit probes were added in kernel 5.5 is that they attach to function entry/exit like kprobes but through a BPF trampoline that is dramatically cheaper — the modern default when available.
To list what a given kernel actually offers, you enumerate the sources directly:
# Every tracepoint the running kernel exposes (there are thousands)
sudo ls /sys/kernel/tracing/events/ | head
#   block  cgroup  ext4  irq  kmem  net  sched  syscalls  tcp  timer  ...

# List probes the way bpftrace sees them (wildcards allowed)
sudo bpftrace -l 'tracepoint:syscalls:sys_enter_open*'
#   tracepoint:syscalls:sys_enter_open
#   tracepoint:syscalls:sys_enter_openat
#   tracepoint:syscalls:sys_enter_openat2

# Which kernel functions can I kprobe? (filter with grep)
sudo bpftrace -l 'kprobe:tcp_*' | head
#   kprobe:tcp_sendmsg
#   kprobe:tcp_recvmsg
#   kprobe:tcp_retransmit_skb
#   ...
The scheduler tracepoints (sched:sched_switch, sched:sched_wakeup) deserve special mention because they underpin the two most valuable questions in performance work — why is a task not running? (off-CPU analysis) and how long did it wait in the run queue? (scheduler latency). Those questions connect directly to process states: a task in R is on or waiting for CPU, a task in D is blocked in the kernel on I/O. If the R/D/S state model is not yet reflexive, the Processes & Jobs: ps, top, signals & kill lesson is the prerequisite that makes scheduler tracing make sense.
perf: the Swiss Army knife of profiling
perf ships in the kernel tree and is the tool you reach for first, because it answers the most common question — “where is CPU time going?” — better than anything else, and it needs no eBPF. Install it and confirm it can talk to the counters:
# Debian / Ubuntu — perf is versioned to your kernel
sudo apt install linux-tools-common linux-tools-$(uname -r)
# RHEL / Fedora / Rocky
sudo dnf install perf

perf --version    # perf version 6.8.0
perf is really a suite of subcommands. You will use five constantly; the rest are specialist:
| Subcommand | What it does | Canonical invocation |
|---|---|---|
perf stat |
Count events (PMCs, software) for a command or the system | perf stat -d ./app |
perf top |
Live, top-style sampling profiler — hottest functions now |
perf top -g |
perf record |
Sample and write events to perf.data |
perf record -F 99 -a -g -- sleep 30 |
perf report |
Interactive/textual analysis of perf.data |
perf report --stdio |
perf script |
Dump raw samples (feeds flame-graph tooling) | perf script > out.perf |
perf list |
Enumerate every event this CPU/kernel supports | perf list |
perf trace |
strace-like syscall tracer, far cheaper |
perf trace -p <pid> |
perf sched |
Scheduler latency analysis | perf sched record / perf sched latency |
perf lock / perf mem / perf c2c |
Lock contention, memory access, cache-line sharing | specialist |
perf stat: counters and the IPC verdict
perf stat is the fastest way to characterise what kind of slow you have. It reads the CPU’s performance-monitoring counters and prints them for the run:
# Count core counters for a single command
perf stat -d gzip -9 bigfile.tar
 Performance counter stats for 'gzip -9 bigfile.tar':

          3,204.61 msec task-clock                #    0.999 CPUs utilized
                17      context-switches          #    5.305 /sec
                 1      cpu-migrations            #    0.312 /sec
               182      page-faults               #   56.79 /sec
    11,438,209,911      cycles                    #    3.569 GHz
     9,014,573,022      instructions              #    0.79  insn per cycle
     1,872,004,551      branches                  #  584.16 M/sec
        61,209,338      branch-misses             #    3.27% of all branches
     2,051,884,004      L1-dcache-loads           #  640.29 M/sec
       142,880,101      L1-dcache-load-misses     #    6.96% of all L1-dcache accesses
        18,204,551      LLC-load-misses           #  cache thrash if high

       3.207805241 seconds time elapsed
The number that teaches you the most is IPC — instructions per cycle (here 0.79). Modern CPUs can retire several instructions per cycle; an IPC below ~1.0 means the core is stalling — usually waiting on memory (cache misses) or mispredicted branches — rather than doing useful work. High IPC with high CPU means you are genuinely compute-bound and the fix is a better algorithm; low IPC means the fix is data layout, cache behaviour, or fewer branch mispredicts. The supporting counters name the culprit:
| Counter | What it measures | Healthy | Red flag → look at |
|---|---|---|---|
instructions / cycles = IPC |
Work done per cycle | > 1.0 (often 1–4) | < 0.7 → stalls (memory/branches) |
cache-misses, LLC-load-misses |
Last-level cache misses | Low relative to references | High → memory-bound; fix data locality |
branch-misses |
Mispredicted branches | < ~2% | > 5% → unpredictable branching |
context-switches |
Task switches | Low for compute work | High → contention/oversubscription |
cpu-migrations |
Task bounced between cores | ~0 | High → cache cold on every hop; pin with taskset |
page-faults |
Virtual-memory faults | Low after warm-up | Growing → memory pressure, mmap churn |
stalled-cycles-frontend |
Cycles the frontend starved | Low | High → I-cache / decode bound |
⚠️ You may see <not supported> or <not counted> for some events — that means the counter is unavailable (common inside a VM or container without the right passthrough) or that too many events were multiplexed onto too few physical counter slots. Ask for fewer events, or run on bare metal, before you trust a partially-counted number.
perf top and perf record: finding the hot function
perf top is your instant “what is on-CPU right now?” It samples the instruction pointer across the whole system and shows the hottest functions live, updating like top:
# Live system-wide profile; -g adds call graphs (who called the hot function)
sudo perf top -g
Samples: 240K of event 'cpu-clock', 4000 Hz
Overhead  Shared Object        Symbol
  18.42%  [kernel]             [k] _raw_spin_unlock_irqrestore
  11.07%  libc.so.6            [.] __memmove_avx_unaligned_erms
   7.93%  postgres             [.] heap_page_prune
   5.16%  [kernel]             [k] copy_user_enhanced_fast_string
   ...
For a profile you can analyse offline and turn into a flame graph, you record to a file and then report:
# Sample all CPUs at 99 Hz for 30 seconds, capturing call stacks
sudo perf record -F 99 -a -g -- sleep 30
#   [ perf record: Woken up 8 times to write data ]
#   [ perf record: Captured and wrote 6.114 MB perf.data (~267k samples) ]

# Analyse: a tree of where time went, most-expensive first
sudo perf report --stdio | head -30
The -g (call-graph) capture has a crucial subtlety. To walk the stack, perf needs frame pointers, and many distro binaries are compiled with -fomit-frame-pointer, which breaks stack walking and gives you broken or truncated stacks. The fix is to choose an explicit unwind method:
--call-graph mode |
How it walks the stack | Cost | When to use |
|---|---|---|---|
fp (frame pointer) |
Follows the frame-pointer chain | Cheapest | Only if binaries keep frame pointers |
dwarf |
Copies stack, unwinds with DWARF debuginfo | Higher (larger perf.data) |
Default when frame pointers are omitted |
lbr |
Intel Last Branch Record hardware | Low, shallow depth | Recent Intel CPUs, shallow stacks |
# When stacks look broken, force DWARF unwinding (needs debuginfo)
sudo perf record -F 99 -a --call-graph dwarf -- sleep 30
Flame graphs: reading a profile at a glance
A flame graph turns thousands of sampled stacks into one picture. It is the single most valuable artifact in performance work, and reading it is a skill worth ten minutes. The classic toolchain is Brendan Gregg’s FlameGraph scripts; modern perf can also emit one directly.
# Classic pipeline: record → dump → fold identical stacks → render SVG
git clone https://github.com/brendangregg/FlameGraph
sudo perf record -F 99 -a -g -- sleep 30
sudo perf script > out.perf
./FlameGraph/stackcollapse-perf.pl out.perf > out.folded
./FlameGraph/flamegraph.pl out.folded > flame.svg   # open in a browser
The reading rules are simple and unintuitive until stated:
| Axis / feature | What it means | Common mistake |
|---|---|---|
| Width of a box | Fraction of samples where that function was on the stack — i.e. on-CPU time | Thinking width is call count (it is not) |
| Y-axis (height) | Stack depth: parent below, child above | Reading top-to-bottom as time order |
| X-axis (order) | Alphabetical / merge order — not time | Reading left-to-right as a timeline |
| Plateaus (wide flat tops) | Functions burning CPU directly | Ignoring a wide leaf because its name is dull |
| Colour | Usually just hue for contrast (warm palette) | Reading meaning into colour by default |
The technique: scan across the top for the widest plateaus — those are the functions actually spending CPU. A tall, narrow tower is a deep call chain that costs little; a short, wide box near the top is where your machine lives. On-CPU flame graphs answer “where is CPU going?”; the mirror image, an off-CPU flame graph (built from scheduler tracepoints via eBPF), answers “where is my thread blocked and waiting?” — the two together explain almost every latency problem.
ftrace: the kernel’s built-in tracer
perf samples; ftrace traces — it can record every entry into every kernel function, in order, with timing. It is built into the kernel and driven entirely through a virtual filesystem, so it needs nothing installed. That filesystem is tracefs, mounted at /sys/kernel/tracing (older systems expose it under /sys/kernel/debug/tracing).
# tracefs is the whole interface — everything is a file you echo into
sudo -i
cd /sys/kernel/tracing

cat available_tracers
#   timerlat osnoise hwlat blk mmiotrace function_graph wakeup_dl wakeup_rt wakeup function nop

# Turn on the function tracer, look, then turn it OFF again
echo function > current_tracer
cat trace | head
echo nop > current_tracer          # ⚠️ ALWAYS reset to nop when done
⚠️ Two ftrace footguns bite hard. First, the plain function tracer instruments every kernel function and can add serious overhead system-wide — always narrow it with set_ftrace_filter and always set current_tracer back to nop when finished, or you leave a permanent tax on the box. Second, reading trace gives a static snapshot while trace_pipe consumes the live stream (and blocks) — mixing them up is why “my trace is empty” or “my terminal hung.” Here are the control files that matter:
| tracefs file | Purpose |
|---|---|
current_tracer |
Which tracer is active (function, function_graph, nop, …) |
available_tracers |
List of tracers this kernel supports |
set_ftrace_filter |
Restrict function tracing to matching functions (e.g. vfs_*) |
set_ftrace_pid |
Trace only a specific PID |
set_graph_function |
For function_graph: trace only this call subtree |
trace |
Static snapshot of the ring buffer (read repeatedly) |
trace_pipe |
Live, consuming stream (blocks until events arrive) |
tracing_on |
1/0 master switch to pause/resume without reconfiguring |
events/<subsys>/<event>/enable |
Turn an individual tracepoint on/off |
available_filter_functions |
Every function you may filter/trace |
The function_graph tracer is the one that produces something beautiful — an indented, C-like call graph with per-function durations, so you can see not just what the kernel called but how long each call took:
echo function_graph > current_tracer
echo vfs_read > set_graph_function     # only the vfs_read subtree
cat trace | head -20
echo nop > current_tracer              # reset
 CPU  DURATION                  FUNCTION CALLS
  0)               |  vfs_read() {
  0)               |    rw_verify_area() {
  0)   0.312 us    |      security_file_permission();
  0)   0.945 us    |    }
  0)   2.104 us    |    __vfs_read() {
  0)   1.560 us    |      ext4_file_read_iter();
  0)   4.220 us    |    }
  0)   7.918 us    |  }
trace-cmd: ftrace without the file wrangling
Echoing into a dozen tracefs files is error-prone. trace-cmd is the friendly front-end that does it for you and records to a trace.dat file you can analyse or move to another machine:
# Debian/Ubuntu: sudo apt install trace-cmd   |   RHEL/Fedora: sudo dnf install trace-cmd

# Record the vfs_read call subtree with function_graph for 1 second
sudo trace-cmd record -p function_graph -g vfs_read sleep 1
sudo trace-cmd report | head

# Record specific tracepoints across the whole system
sudo trace-cmd record -e sched:sched_switch -e block:block_rq_issue sleep 5
sudo trace-cmd report | head
trace-cmd command |
What it does |
|---|---|
trace-cmd list |
List available tracers, events, and plugins |
trace-cmd record -p <tracer> |
Record with a tracer (function, function_graph) |
trace-cmd record -e <event> |
Record one or more tracepoints |
trace-cmd record -g <fn> |
Limit function_graph to a function subtree |
trace-cmd report |
Human-readable dump of trace.dat |
trace-cmd start / stop / reset |
Control an in-place ftrace session |
kernelshark |
GUI to visualise a trace.dat timeline |
Where does ftrace fit next to perf and eBPF? Use ftrace/trace-cmd when you want to see the ordered flow of kernel function calls and their durations — “what did the kernel do, step by step, when I ran this?” Use perf for statistical profiling and counters. Use eBPF when you want to aggregate a custom answer in-kernel — a histogram, a per-process count — rather than a firehose of individual events.
eBPF, explained properly
Here is the idea that changed Linux observability. eBPF (extended Berkeley Packet Filter) lets you load a small program into the running kernel that executes at an event source — a tracepoint, a kprobe, a perf sample — runs in kernel context at native speed, and communicates results back to user space through maps. It is a safe, sandboxed virtual machine inside the kernel that you can program on the fly. That one capability is why the same technology now underpins observability and high-performance networking and runtime security.
The reason it is safe enough to run on production — and the reason it is not just “kernel modules with extra steps” — is the verifier. When you load a program, the kernel does not trust it. An in-kernel verifier statically analyses every possible path through the program before it is allowed to run and proves a set of safety properties: the program terminates (originally: no loops at all; since kernel 5.3, bounded loops are permitted), it never reads uninitialised memory, it never accesses memory outside the regions it is granted, and it stays within an instruction budget (1 million since 5.2). A program that fails any check is rejected at load time and never executes. Only a verified program is then JIT-compiled to native machine code and attached to its hook. This is why a buggy trace cannot panic or hang the kernel — a guarantee no kernel module can make.
The flow from “you type a command” to “you see a histogram” is worth seeing as a picture, because every eBPF tool — bcc, bpftrace, Cilium, Parca — is a variation on it.
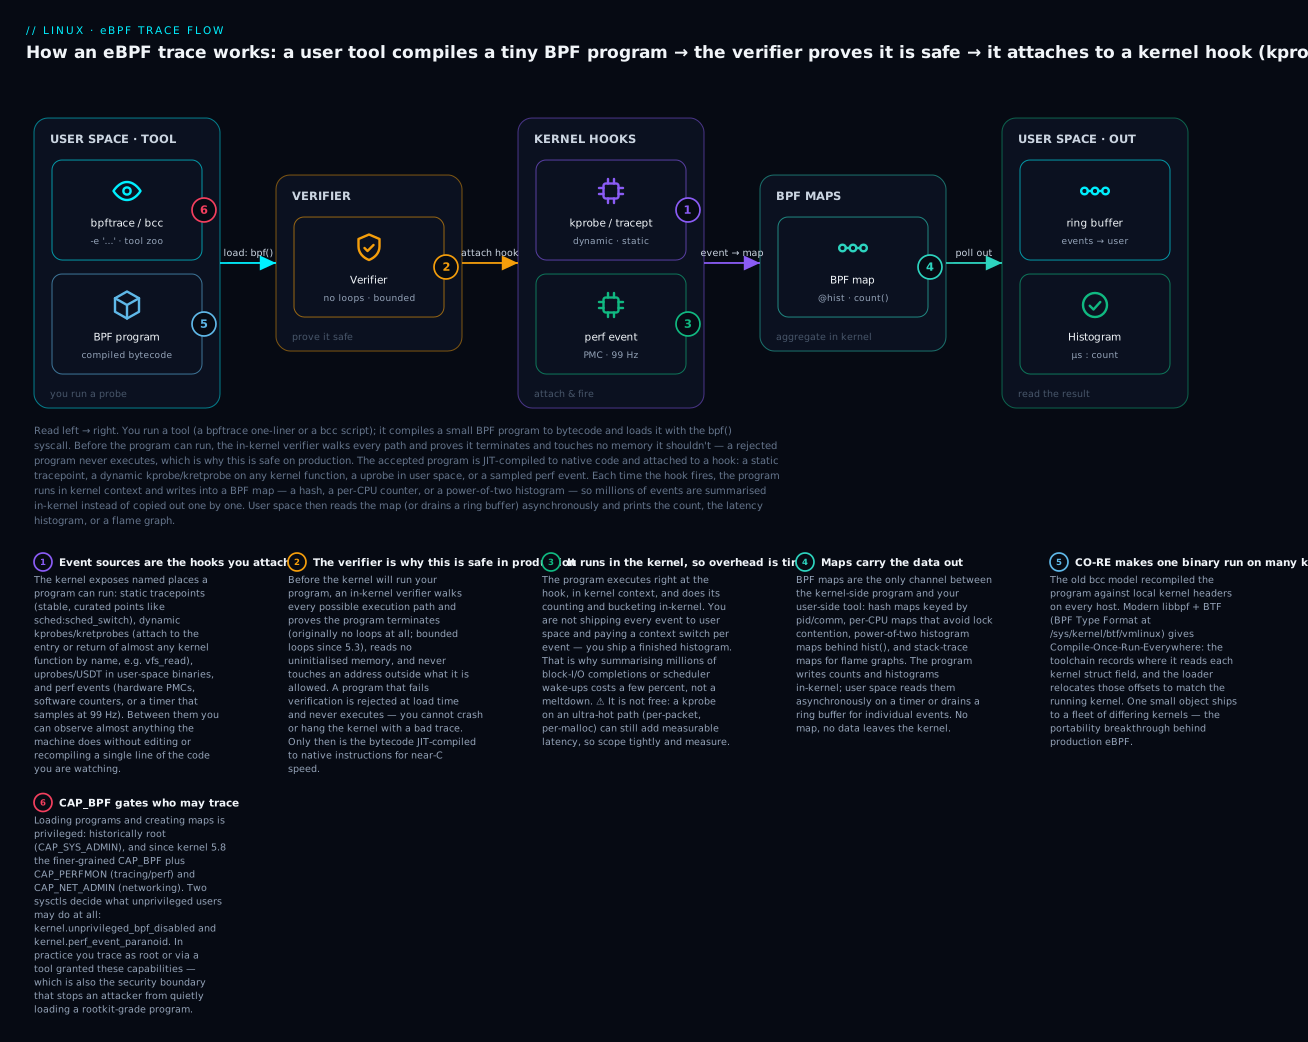
Reading it left to right: your tool compiles a tiny program and hands it to the kernel with the bpf() syscall; the verifier proves it safe and the kernel JITs it; it attaches to a hook; every time the hook fires, the program runs in kernel context and updates a map — a hash keyed by PID, a per-CPU counter, a histogram — so millions of events become one compact summary without leaving the kernel; and user space reads that map on a timer (or drains a ring buffer) to print the answer. The genius is aggregation-in-kernel: you pay for one finished histogram, not a context switch per event.
Two concepts make the rest of the ecosystem legible. Program types determine what a program may attach to and what context it receives; map types determine how it stores and shares data.
| eBPF program type | Attaches to | Typical use |
|---|---|---|
kprobe / kretprobe |
Kernel function entry/return | Latency, argument capture (bcc/bpftrace) |
tracepoint / raw_tracepoint |
Static kernel tracepoints | Stable-API tracing |
fentry / fexit |
Function entry/exit via trampoline (5.5+) | Cheaper kprobe replacement |
perf_event |
perf PMCs / timed samples | CPU profiling, PMC-driven tracing |
uprobe / usdt |
User-space functions/markers | App-level tracing |
xdp |
Earliest RX in the NIC driver | DDoS drop, load-balancing (Katran) |
tc (sched_cls) |
Traffic-control ingress/egress | Policy, shaping (Cilium) |
cgroup_* |
cgroup hooks | Per-container network/resource policy |
lsm |
Linux Security Module hooks (5.7+) | Runtime security enforcement |
sk_* / sockops |
Socket lifecycle | Socket-level redirection, observability |
| eBPF map type | Shape | Used for |
|---|---|---|
BPF_MAP_TYPE_HASH |
Key → value hash | Per-PID / per-key aggregation |
BPF_MAP_TYPE_ARRAY |
Index → value | Fixed slots, config, counters |
PERCPU_HASH / PERCPU_ARRAY |
One copy per CPU | Lock-free high-frequency counting |
BPF_MAP_TYPE_HISTOGRAM (via helpers) |
Power-of-two buckets | Latency/size histograms (hist()) |
STACK_TRACE |
Stack-id → stack | Flame graphs, off-CPU stacks |
PERF_EVENT_ARRAY |
Per-CPU perf channel | Streaming events to user space (pre-5.8) |
RINGBUF |
Shared ring buffer (5.8+) | Efficient, ordered event streaming |
LRU_HASH |
Hash with eviction | Bounded-memory tracking |
What the verifier rejects — worth knowing, because you will hit it when you write your own programs, and the error messages are famously cryptic:
| The verifier rejects | Why | How you hit it |
|---|---|---|
| Unbounded loops | Must prove termination | A while with a runtime bound the verifier can’t prove |
| Out-of-bounds memory | Safety of kernel memory | Indexing an array without a bounds check first |
| Uninitialised stack reads | No leaking kernel data | Reading a variable before assigning it |
| Reading arbitrary pointers | Kernel memory safety | Dereferencing without bpf_probe_read |
| Too many instructions | Bounded runtime | Program exceeds the 1M-instruction budget |
| Unprivileged pointer leaks | Info-leak prevention | Returning a pointer value to user space |
Finally, the feature that made eBPF deployable across a real fleet: CO-RE (Compile Once, Run Everywhere). Early bcc shipped C source and recompiled it on every host against that host’s kernel headers, dragging a full LLVM/Clang toolchain onto production. Modern libbpf + BTF (BPF Type Format, the kernel’s own type information at /sys/kernel/btf/vmlinux) records where the program reads each kernel struct field and relocates those offsets at load time to match the running kernel — so one small compiled object runs unchanged across kernel versions. That is what turned eBPF from a lab tool into infrastructure. A short timeline of the milestones you will hear referenced:
| Kernel | Year | Milestone |
|---|---|---|
| 3.18 | 2014 | eBPF core + bpf() syscall |
| 4.1–4.9 | 2015–16 | kprobes, uprobes, tracepoints, stack traces, profiling |
| 4.18 | 2018 | BTF introduced (foundation for CO-RE) |
| 5.2–5.3 | 2019 | 1M-instruction limit; bounded loops allowed |
| 5.5 | 2020 | fentry/fexit BPF trampolines (cheap function tracing) |
| 5.7 | 2020 | BPF LSM (runtime security enforcement) |
| 5.8 | 2020 | CAP_BPF; ring buffer map (BPF_MAP_TYPE_RINGBUF) |
bcc: the eBPF tool zoo
You rarely write eBPF C by hand. bcc (the BPF Compiler Collection) ships a large collection of ready-made, single-purpose tools — most named <thing>snoop or <thing>latency or <thing>stat — that each answer one sharp question. Install the collection and note the naming quirk:
# Debian / Ubuntu — tools are SUFFIXED with -bpfcc and live on $PATH
sudo apt install bpfcc-tools linux-headers-$(uname -r)
execsnoop-bpfcc        # note the suffix

# RHEL / Fedora / Rocky — package bcc-tools, unprefixed, in /usr/share/bcc/tools
sudo dnf install bcc-tools
/usr/share/bcc/tools/execsnoop
The essential dozen — commit these to memory, because they cover most real investigations:
| bcc tool | Question it answers | Event source |
|---|---|---|
execsnoop |
What new processes are being exec’d (and by whom)? | execve tracepoint |
opensnoop |
What files is everything opening (and which fail)? | open/openat |
biolatency |
What is the distribution of block-I/O latency? | block tracepoints |
biosnoop |
Per-I/O: which process, which disk, how long? | block tracepoints |
tcpconnect |
Who is making outbound TCP connections, to where? | tcp_v4_connect kprobe |
tcpaccept |
Who is receiving inbound TCP connections? | inet_csk_accept |
tcpretrans |
Which connections are retransmitting (network pain)? | tcp_retransmit_skb |
runqlat |
How long do tasks wait in the run queue (scheduler latency)? | sched tracepoints |
profile |
Where is CPU time going? (samples stacks → flame graph) | perf timed samples |
offcputime |
Where are threads blocked off-CPU and for how long? | sched_switch |
cachestat |
What is the page-cache hit/miss ratio? | mm functions |
ext4slower / xfsslower |
Which filesystem ops exceeded N ms? | fs functions |
Two produce output you will read constantly. execsnoop is a live feed of every process launched — the fastest way to catch a cron job, a runaway fork, or a mystery subprocess:
sudo execsnoop-bpfcc
PCOMM            PID    PPID   RET ARGS
sh               21982  21981    0 /bin/sh -c /opt/app/backup.sh
tar              21983  21982    0 /usr/bin/tar czf /backup/app.tgz /srv/app
gzip             21984  21983    0 /usr/bin/gzip
node             21990  1442     0 /usr/bin/node /srv/app/worker.js
biolatency aggregates disk-I/O latency into a power-of-two histogram in-kernel — the canonical demonstration of why eBPF matters, because it summarises thousands of I/Os into one compact picture at trivial cost:
sudo biolatency-bpfcc 10 1 # 10-second window, 1 sample
     usecs               : count     distribution
       128 -> 255         : 3        |                                        |
       256 -> 511         : 45       |***                                     |
       512 -> 1023        : 380      |*****************                       |
      1024 -> 2047        : 602      |****************************************|
      2048 -> 4095        : 189      |************                            |
      4096 -> 8191        : 44       |**                                      |
A tidy single hump near 1–2 ms is a healthy SSD; a second hump out at tens of milliseconds is the signature of a device that occasionally stalls — a saturated queue or a failing disk. When you need a broader menu than the fixed tools, bcc ships multi-tools that point the same machinery at arbitrary functions:
| bcc multi-tool | What it does |
|---|---|
funccount |
Count how often a function/tracepoint fires |
funclatency |
Histogram of how long a function takes |
stackcount |
Count unique stack traces reaching a function |
trace |
Print custom per-event lines with args (a targeted mini-strace) |
argdist |
Summarise a function’s argument or return-value distribution |
bpftrace: the awk of tracing
bcc tools are pre-built. bpftrace is the language you use when the question is yours — an awk-like, one-line-to-one-screen tracing language that compiles your script to eBPF on the spot. It is the tool you will reach for most, because a useful investigation is often a single line you type from memory. The anatomy of a bpftrace program mirrors awk: a probe (where to attach), an optional filter (/predicate/), and an action ({ ... }) that usually updates a map named with a leading @.
probe /filter/ { action }

kprobe:vfs_read /comm == "nginx"/ { @count = count(); }
└── probe ────┘ └── filter ─────┘ └── action ──────┘
The probe types you attach to are exactly the event sources from earlier, in bpftrace syntax:
| bpftrace probe | Fires on |
|---|---|
kprobe:fn / kretprobe:fn |
Kernel function entry / return |
tracepoint:subsys:event |
Static kernel tracepoint |
uprobe:/path:fn / uretprobe:... |
User-space function entry / return |
usdt:/path:provider:name |
USDT marker in a user binary |
profile:hz:99 |
Timed sample, 99×/sec per CPU (profiling) |
interval:s:1 |
Once per second (for periodic printing) |
software:faults:1 / hardware:cache-misses:... |
perf software / hardware events |
BEGIN / END |
Program start / end (setup, final print) |
Inside an action you have a set of builtins — the runtime context of the event. These are the vocabulary of every one-liner:
| Builtin | Meaning |
|---|---|
pid / tid |
Process / thread ID |
uid / gid |
User / group ID |
comm |
Process name (e.g. nginx) |
nsecs |
Nanoseconds since boot (for latency: stamp and subtract) |
elapsed |
Nanoseconds since the program started |
cpu |
Current CPU number |
curtask |
Pointer to the current task_struct |
arg0, arg1, … |
Kprobe function arguments (raw) |
args |
Tracepoint arguments, as named fields (args->filename) |
retval |
Return value (in a kretprobe/kretfunc) |
kstack / ustack |
Kernel / user-space stack trace |
probe |
Full name of the firing probe |
func |
Name of the function being probed |
username |
Resolves uid to a name |
And the map functions — the aggregations that run in-kernel, which is what keeps bpftrace cheap:
| Map function | Produces |
|---|---|
count() |
A running count |
sum(v) / avg(v) / min(v) / max(v) |
Arithmetic aggregates |
hist(v) |
Power-of-two histogram (log2 buckets) |
lhist(v, min, max, step) |
Linear histogram with fixed-width buckets |
stats(v) |
Count, average and total together |
delete(@map[key]) |
Remove one entry (essential for latency maps) |
clear(@map) / zero(@map) |
Reset a map |
print(@map) |
Print a map on demand |
One-liners that earn their keep
Here are six that solve real problems. Type them, watch them, adapt them — this is the fluency the lesson is really teaching.
# 1. Which processes make the most syscalls? (system call pressure)
sudo bpftrace -e 'tracepoint:raw_syscalls:sys_enter { @[comm] = count(); }'
@[sshd]: 47
@[bash]: 112
@[node]: 18340
@[postgres]: 204817          # postgres dominates — investigate it next
# 2. Which files are being opened, live, with the opening process
sudo bpftrace -e 'tracepoint:syscalls:sys_enter_openat {
    printf("%-16s %s\n", comm, str(args->filename)); }'
nginx            /var/www/html/index.html
nginx            /var/www/html/favicon.ico
node             /srv/app/config.json
node             /srv/app/node_modules/.../huge-lib.js   # a hot require loop?
# 3. Distribution of VFS read latency (kprobe entry + kretprobe return)
sudo bpftrace -e '
  kprobe:vfs_read { @start[tid] = nsecs; }
  kretprobe:vfs_read /@start[tid]/ {
      @ns = hist(nsecs - @start[tid]); delete(@start[tid]); }'
@ns:
[256, 512)          812 |@@@@@@@@@                                            |
[512, 1K)          2451 |@@@@@@@@@@@@@@@@@@@@@@@@@@@@                          |
[1K, 2K)           4210 |@@@@@@@@@@@@@@@@@@@@@@@@@@@@@@@@@@@@@@@@@@@@@@@@@@@@@@ |
[2K, 4K)           1120 |@@@@@@@@@@@@@                                        |
[4K, 8K)             98 |@                                                    |
# 4. TCP retransmits by process — the fingerprint of network trouble
sudo bpftrace -e 'kprobe:tcp_retransmit_skb { @[comm] = count(); }'

# 5. Block-I/O size distribution — are you doing tiny random or big sequential I/O?
sudo bpftrace -e 'tracepoint:block:block_rq_issue { @bytes = hist(args->bytes); }'

# 6. New process executions with their command line (a live audit log)
sudo bpftrace -e 'tracepoint:syscalls:sys_enter_execve {
    printf("%s[%d] -> %s\n", comm, pid, str(args->filename)); }'
The latency-histogram pattern in #3 is the one to internalise, because it generalises to anything: stamp nsecs into a per-thread map at the entry probe, subtract at the return probe, feed the delta to hist(), and delete() the entry so the map does not grow without bound. Swap vfs_read for tcp_sendmsg, a filesystem function, or a uprobe on your own application function, and you have a bespoke latency profiler in one line.
⚠️ The warnings that keep this safe on production. A probe on an extremely hot path — kprobe:__kmalloc, a per-packet function, uretprobe on malloc in a busy allocator — fires millions of times a second and its own overhead can slow or destabilise the box. Attaching a uprobe to a shared library like libc instruments every process using it, not just the one you care about. Always start with a filter (/comm == "..."/ or /pid == .../), prefer counts and histograms (aggregated in-kernel) over per-event printf (which streams every event to user space), and test on a canary before you trace the primary. Reach for tightly-scoped tracepoints before broad kprobes.
A methodology: “what is this box doing, and why is it slow?”
Tools are worthless without a method, or you flail. The discipline that separates a five-minute diagnosis from a two-hour one is to work top-down by resource, let the numbers name a single bottleneck, and only then drill into it with the sharpest tool. Two frameworks structure this.
The USE method (Brendan Gregg) says: for every resource, check Utilization, Saturation, and Errors. The RED method (services) says: for every service, check Rate, Errors, and Duration. USE finds which resource is the problem; RED describes how the service feels. This lesson’s contribution is the third column — the tracing tool that answers each cell when the cheap counter is not enough:
| Resource | Utilization (cheap) | Saturation (cheap) | Deep tool when you need why |
|---|---|---|---|
| CPU | mpstat, top %us/%sy |
run-queue length, runqlat |
perf top / perf record → flame graph |
| Memory | free -h available |
swap in/out (vmstat si/so) |
perf record -e page-faults, cachestat |
| Disk | iostat -xz %util |
iostat aqu-sz, biolatency |
biolatency, biosnoop, ext4slower |
| Network | sar -n DEV |
tcpretrans, drops |
tcpconnect, tcplife, tcpretrans |
| Scheduler | load average | runqlat tail |
offcputime, perf sched latency |
The full “USE across CPU, memory, disk and network, change one thing, re-measure” workflow — the cheap-counter layer that sits above this tracing layer — is the subject of the Performance Analysis & Tuning: CPU, Memory, Disk I/O, the USE Method, tuned & sysctl lesson. Deep tracing is where you go when USE has pointed at a resource but the counters cannot say which code path.
The move that makes you fast is the drill-down ladder: never start deep. Start with a system glance, descend one rung only when the current rung points somewhere specific, and stop the moment you have the answer.
| Rung | Tool | You learn | Descend when |
|---|---|---|---|
| 1. Glance | uptime, top, vmstat 1 |
Is it CPU, memory, I/O, or waiting? | A resource is clearly hot |
| 2. Per-resource | mpstat, iostat -xz, sar -n DEV |
Which device/CPU/interface | One stands out |
| 3. Profile | perf top → perf record → flame graph |
Which function burns CPU | A function dominates but you need context |
| 4. Targeted trace | bcc tool (biolatency, execsnoop, runqlat) |
The distribution/culprit for that resource | You need a custom cut |
| 5. Bespoke | bpftrace one-liner |
The exact answer to your question | — (bottom of the ladder) |
A concrete walk. The pager fires: API p99 latency has tripled. Rung 1, top shows CPU only 40% busy but load high — something is waiting, not computing. Rung 2, iostat -xz 1 shows one NVMe device at 95% %util with a deep queue. Rung 3 is skipped (not on-CPU). Rung 4, biolatency-bpfcc shows a bimodal histogram — most I/O at 1 ms, a fat tail at 20–40 ms. Rung 5, biosnoop (or bpftrace on block_rq_issue/block_rq_complete) names the process behind the slow I/O — a nightly report job doing synchronous random reads against the API database’s disk. You did not guess once; each rung pointed at the next, and you stopped with a name. This drill-down is one branch of the broader outage playbook in Systematic Linux Troubleshooting: a repeatable method for boot, disk, network & permission failures — performance is one of its branches, and tracing is how you resolve it.
The reference you will actually keep open mid-incident — which tool answers which question:
| The question | Reach for | One-liner / invocation |
|---|---|---|
| Where is CPU going right now? | perf top |
sudo perf top -g |
| Where is CPU going, as a picture? | perf record → flame graph |
perf record -F 99 -a -g -- sleep 30 |
| Why is my thread not running? | offcputime (bcc) |
sudo offcputime-bpfcc 5 |
| How long do tasks wait to run? | runqlat (bcc) |
sudo runqlat-bpfcc |
| What new processes are spawning? | execsnoop (bcc) |
sudo execsnoop-bpfcc |
| What files are being opened / failing? | opensnoop (bcc) |
sudo opensnoop-bpfcc |
| What is disk-I/O latency? | biolatency (bcc) |
sudo biolatency-bpfcc 10 1 |
| Which process/file causes slow I/O? | biosnoop (bcc) |
sudo biosnoop-bpfcc |
| Who connects to whom over TCP? | tcpconnect (bcc) |
sudo tcpconnect-bpfcc |
| Is the network retransmitting? | tcpretrans (bcc) |
sudo tcpretrans-bpfcc |
| Which process makes the most syscalls? | bpftrace |
bpftrace -e 't:raw_syscalls:sys_enter{@[comm]=count();}' |
| Latency of any function? | bpftrace |
entry/return hist(nsecs - @start[tid]) |
| Kernel function call flow + timing? | ftrace / trace-cmd |
trace-cmd record -p function_graph -g <fn> |
| Is the CPU stalling (IPC)? | perf stat |
perf stat -d <cmd> |
Permissions, overhead and the eBPF ecosystem
Two operational realities gate all of this. First, privilege: loading eBPF programs and reading most perf events is not something an unprivileged user may do, for the obvious reason that a program running in the kernel is a security boundary. Historically you needed root (CAP_SYS_ADMIN); since kernel 5.8 the capability is split more finely, and two sysctls decide what is possible at all:
| Control | Governs | Typical value | Notes |
|---|---|---|---|
CAP_BPF |
Loading programs, creating maps | granted to tracing tools/root | Split out of CAP_SYS_ADMIN in 5.8 |
CAP_PERFMON |
perf events, kprobes, profiling | with CAP_BPF for tracing |
The “observe” capability |
CAP_NET_ADMIN |
Networking programs (XDP/tc) | for network eBPF | Separate from tracing |
kernel.unprivileged_bpf_disabled |
Whether non-root may load any BPF | 1/2 (disabled) on most distros |
sysctl — hardening default |
kernel.perf_event_paranoid |
How much perf unprivileged users get | 2 mainline; higher on Debian/Ubuntu |
Lower = more access; -1 = all |
kernel.kptr_restrict |
Whether /proc/kallsyms shows addresses |
1/2 |
Symbol resolution for stacks |
In practice you trace as root (or sudo), or you run a tool that has been granted CAP_BPF+CAP_PERFMON. On a locked-down box you may need to lower kernel.perf_event_paranoid to profile as a normal user — a change you make deliberately and revert, because it widens what any local user can observe. These knobs are kernel tunables set through sysctl and /etc/sysctl.d/, the persistent-versus-live distinction that governs every kernel parameter: sysctl -w changes the running kernel now, a file under /etc/sysctl.d/ makes it survive reboot.
Second, overhead and safety — the discipline that lets you do this on production at all:
| Tool / pattern | Typical overhead | Production caution |
|---|---|---|
perf stat |
Negligible | Safe; counters are free |
perf record -F 99 |
Low (a few %) | Fine; higher -F costs more |
strace / ltrace |
10–100× on the target | ⚠️ Never on a hot production process |
bpftrace count/hist() |
Low (in-kernel aggregation) | Safe when scoped |
bpftrace per-event printf |
Scales with event rate | ⚠️ A hot probe floods user space |
| kprobe on a hot path | Can be significant | ⚠️ __kmalloc, per-packet → measure first |
uprobe on libc |
Hits every user of the lib | ⚠️ Scope by binary/pid |
ftrace function (unfiltered) |
System-wide tax | ⚠️ Filter, and reset to nop |
Finally, the wider ecosystem, because eBPF long ago outgrew ad-hoc tracing and now runs production networking and security. You will meet these names:
| Project | Domain | What it is |
|---|---|---|
| Cilium | Networking | eBPF-based Kubernetes CNI: L3–L7 policy, load-balancing, no iptables |
| Hubble | Observability | Cilium’s network-flow visibility layer |
| Pixie | Observability | Auto-instrumented, no-code app observability via eBPF |
| Parca | Profiling | Continuous, always-on fleet-wide CPU profiling |
| Falco | Security | Runtime threat detection from syscall/eBPF events |
| Katran | Networking | Meta’s XDP-based L4 load balancer |
| Tetragon | Security | eBPF runtime enforcement and observability |
| bpftop | Observability | Live top-style view of loaded BPF programs and their cost |
| bpftool | Tooling | The kernel’s own CLI to inspect/load programs and maps |
bpftop deserves a special mention: it shows every eBPF program currently loaded and how much CPU each is costing — how you audit whether your own tracing, or someone else’s agent, is adding overhead. bpftool prog show and bpftool map dump are the low-level equivalents.
Hands-on lab
This lab runs on any Linux VM or WSL2 with a recent kernel (5.8+ recommended). ⚠️ Prefer a throwaway VM, not a production box. In Docker you need --privileged and a host kernel that exposes tracefs, so a real VM is simpler. Everything here is read-only observation — nothing is destroyed — but you are loading kernel programs, so use a machine you can reboot without consequence.
Step 1 — Install the toolchain.
# Debian / Ubuntu
sudo apt update
sudo apt install -y linux-tools-common linux-tools-$(uname -r) \
    bpfcc-tools bpftrace trace-cmd linux-headers-$(uname -r)
# RHEL / Fedora / Rocky
# sudo dnf install -y perf bcc-tools bpftrace trace-cmd kernel-devel
What just happened: you installed perf, the bcc tool zoo, bpftrace, and trace-cmd. On Debian the bcc tools carry a -bpfcc suffix.
Step 2 — Confirm the kernel is eBPF/BTF-ready.
ls /sys/kernel/btf/vmlinux && echo "BTF present — CO-RE will work"
uname -r
sudo bpftrace -e 'BEGIN { printf("bpftrace works\n"); exit(); }'
What just happened: the presence of /sys/kernel/btf/vmlinux confirms the kernel ships BTF; the bpftrace line proves you can load a program. If the last command errors with a permission or paranoid message, note it — Step 9 addresses it.
Step 3 — Characterise a workload with perf stat.
# Generate CPU work and read the counters
perf stat -d openssl speed -seconds 3 aes-256-cbc 2>/dev/null
What just happened: you saw cycles, instructions and IPC. A crypto benchmark is compute-bound, so IPC should be high (often > 2) — contrast that later with a memory-bound workload where IPC drops below 1.
Step 4 — Find the hot function live.
# In one terminal, create sustained CPU load
yes > /dev/null &
# In another, watch the profile
sudo perf top -g
#   ... press 'q' to quit; then:
kill %1
What just happened: perf top showed you the hottest on-CPU symbols in real time — yes and the kernel write path should dominate.
Step 5 — Capture a profile and fold it toward a flame graph.
sudo perf record -F 99 -a -g -- sleep 10
sudo perf report --stdio | head -25
# Optional flame graph:
# git clone https://github.com/brendangregg/FlameGraph
# sudo perf script | ./FlameGraph/stackcollapse-perf.pl | ./FlameGraph/flamegraph.pl > flame.svg
What just happened: you recorded 10 seconds of system-wide samples and read the call-graph report. The optional two lines turn it into an SVG flame graph you open in a browser.
Step 6 — Trace kernel function flow with ftrace via trace-cmd.
sudo trace-cmd record -p function_graph -g do_sys_openat2 sleep 1
sudo trace-cmd report | head -20
What just happened: you captured the timed call subtree under the openat path — the kernel’s own step-by-step flow with per-function durations.
Step 7 — Run three bcc tools.
sudo execsnoop-bpfcc &        # watch new processes; run some commands in another shell
sleep 5; kill %1
sudo opensnoop-bpfcc -d 3     # 3 seconds of file opens
sudo biolatency-bpfcc 5 1     # 5-second disk-latency histogram (generate I/O: sudo dd if=/dev/zero of=/tmp/t bs=1M count=200 oflag=direct)
What just happened: you saw live process launches, the files everything opens (watch the ERR column for failures), and a real in-kernel latency histogram of your disk. ⚠️ dd ... oflag=direct writes a 200 MB temp file; delete it afterward with rm /tmp/t.
Step 8 — Write your own bpftrace one-liners.
# Syscall pressure by process
sudo bpftrace -e 'tracepoint:raw_syscalls:sys_enter { @[comm] = count(); }'   # Ctrl-C to print

# Your own latency histogram of vfs_read
sudo bpftrace -e '
  kprobe:vfs_read { @s[tid] = nsecs; }
  kretprobe:vfs_read /@s[tid]/ { @us = hist((nsecs - @s[tid]) / 1000); delete(@s[tid]); }'
What just happened: you built two custom tracers from nothing — a per-process syscall counter and a microsecond latency histogram — the exact pattern you will adapt to real incidents.
Step 9 — Inspect what is loaded, and the permission knobs.
sudo bpftool prog show | head          # every BPF program currently attached
sysctl kernel.unprivileged_bpf_disabled kernel.perf_event_paranoid
# If unprivileged profiling is blocked and you accept the risk on this VM:
# sudo sysctl kernel.perf_event_paranoid=1      # live only; revert or persist via /etc/sysctl.d/
What just happened: you listed loaded programs with bpftool and read the two sysctls that gate access. You saw the live-versus-persistent split that governs every kernel tunable.
Step 10 — Clean up.
# Make sure no ftrace tracer is left running (belt-and-braces)
echo nop | sudo tee /sys/kernel/tracing/current_tracer
rm -f /tmp/t
What just happened: you reset ftrace to nop so no residual tracing overhead is left on the box — the single most important cleanup habit in this whole lesson.
Common mistakes and troubleshooting
| Symptom | Likely cause | Fix |
|---|---|---|
perf record -g stacks are broken/[unknown] |
Binaries built with -fomit-frame-pointer |
Use --call-graph dwarf (needs debuginfo) or lbr on Intel |
perf stat shows <not supported>/<not counted> |
PMCs unavailable (VM/container) or event multiplexing | Run on bare metal; request fewer events |
bpftrace: ERROR: Permission denied / paranoid |
Not root, or perf_event_paranoid too high |
sudo; lower kernel.perf_event_paranoid deliberately |
bcc tool: Unable to find kernel headers |
linux-headers / kernel-devel not installed |
Install headers matching uname -r (bcc only) |
| bpftrace one-liner runs but prints nothing | Wrong probe name, or an over-strict filter | List with bpftrace -l 'pattern'; relax the /filter/ |
| The box got slower when you started tracing | A kprobe on a hot path, or per-event printf |
Scope by pid/comm; switch to count()/hist(); detach |
| ftrace “empty” or the terminal hangs | Read trace (snapshot) vs trace_pipe (blocking) |
Use trace for a snapshot; trace_pipe streams live |
| Tracing overhead persisted after you quit | Left current_tracer as function |
echo nop > /sys/kernel/tracing/current_tracer |
str(args->filename) shows garbage |
Reading a user pointer without a safe copy | In tracepoints use str(args->...); for kprobes copy properly |
| Symbols show as raw addresses | kptr_restrict/missing symbols |
Check kernel.kptr_restrict; install debuginfo |
The three gotchas that cause the most lost time deserve prose.
Broken stacks are a build problem, not a perf bug. A flame graph that is a flat sea of [unknown] boxes almost always means the profiled code was compiled without frame pointers, so perf cannot walk the stack the cheap way. The fix is not more flags on the workload — it is telling perf to unwind differently: --call-graph dwarf unwinds using DWARF debug information (install the -dbgsym/-debuginfo packages), or --call-graph lbr uses Intel’s hardware branch records. The industry is slowly shifting back to shipping frame pointers by default because this cost so many people so much time; until then, reach for dwarf.
The tracer can be the outage. Worth saying twice: a probe on a sufficiently hot function fires so often that the instrumentation itself consumes the machine. strace on a busy process is the classic; a naive bpftrace -e 'kprobe:__kmalloc { @[comm] = count(); }' on an allocation-heavy server is the modern equivalent. The discipline is to estimate the event rate first (a quick funccount of the tracepoint), always filter to the one process you care about, and prefer in-kernel aggregation so you are not paying a user-space round trip per event — with bpftop showing you, live, what your own program costs.
Snapshot versus stream in ftrace. Beginners echo a tracer into current_tracer, cat trace, see nothing, and conclude ftrace is broken. Usually the events already scrolled past, or they wanted the live stream. trace is a static snapshot of the ring buffer you can read again and again; trace_pipe is a live, consuming stream that blocks until events arrive and empties the buffer as you read. Choose deliberately: trace to inspect what just happened, trace_pipe to watch it happen — and reset current_tracer to nop when done, or a forgotten function tracer becomes a silent, system-wide tax that outlives your session.
Cheat-sheet
| Command | What it does |
|---|---|
perf stat -d <cmd> |
Counters + IPC + cache stats for a command |
perf top -g |
Live system-wide profiler with call graphs |
perf record -F 99 -a -g -- sleep 30 |
Sample all CPUs 30 s with stacks → perf.data |
perf record --call-graph dwarf ... |
Record with DWARF stack unwinding |
perf report --stdio |
Textual analysis of perf.data |
perf script | stackcollapse-perf.pl | flamegraph.pl > f.svg |
Build a flame graph |
perf list |
Every event this CPU/kernel supports |
perf trace -p <pid> |
Cheap strace-like syscall trace |
cd /sys/kernel/tracing |
Enter tracefs (ftrace’s interface) |
echo function_graph > current_tracer |
Turn on the call-graph tracer |
echo nop > current_tracer |
⚠️ Turn tracing OFF — always do this |
trace-cmd record -p function_graph -g <fn> sleep 1 |
Record a function subtree |
trace-cmd record -e <subsys:event> sleep 5 |
Record tracepoints |
execsnoop-bpfcc |
Live new-process feed |
opensnoop-bpfcc |
Live file-open feed (watch ERR) |
biolatency-bpfcc 10 1 |
Disk-I/O latency histogram |
biosnoop-bpfcc |
Per-I/O: process, disk, latency |
runqlat-bpfcc |
Scheduler run-queue latency histogram |
offcputime-bpfcc 5 |
Where threads block off-CPU |
tcpconnect-bpfcc / tcpretrans-bpfcc |
TCP connections / retransmits |
profile-bpfcc -F 99 30 |
CPU profiler (bcc) → flame graph |
bpftrace -l 'pattern' |
List matching probes |
bpftrace -e 't:raw_syscalls:sys_enter{@[comm]=count();}' |
Syscalls by process |
bpftrace -e 'k:fn{@s[tid]=nsecs;} kr:fn/@s[tid]/{@=hist(nsecs-@s[tid]);delete(@s[tid]);}' |
Latency histogram of any function |
bpftool prog show / bpftool map dump |
Inspect loaded programs / maps |
bpftop |
Live cost of loaded BPF programs |
sysctl kernel.perf_event_paranoid |
Read the perf-access gate |
Interview and exam questions
Q: What is the fundamental difference between metrics and tracing, and why can’t you fix a performance problem with metrics alone? A: Metrics are pre-aggregated numbers over time — they are excellent at detecting that something changed and when, but they discard the per-event detail needed to explain why. Tracing captures individual events (syscalls, function calls, I/O) by instrumenting the running system, so it can attribute a problem to a specific code path, argument, or device. You detect with metrics and diagnose with tracing.
Q: Explain the eBPF verifier and why it makes eBPF safe to run in production. A: Before the kernel runs a loaded eBPF program, the verifier statically analyses every possible execution path and proves the program terminates (no unbounded loops; bounded loops since 5.3), reads no uninitialised memory, accesses no memory outside its granted regions, and stays within an instruction budget. A program failing any check is rejected at load time and never executes, so a buggy trace cannot panic or hang the kernel — a guarantee a kernel module cannot make. Verified programs are then JIT-compiled to native code.
Q: You run perf stat and see an IPC of 0.6. What does that tell you, and what do you check next?
A: IPC (instructions per cycle) below ~1.0 means the CPU is stalling rather than retiring work — usually waiting on memory or mispredicted branches. Next, look at cache-misses/LLC-load-misses (memory-bound → improve data locality) and branch-misses (unpredictable branching). A high IPC would instead mean you are genuinely compute-bound and need a better algorithm, not a memory-layout fix.
Q: What is a kprobe, how does it differ from a tracepoint, and when should you prefer each? A: A kprobe is dynamic instrumentation that can attach to (almost) any kernel function by name at runtime, with no cooperation from the code — but nothing guarantees that function survives a kernel upgrade. A tracepoint is static instrumentation the maintainers placed and promise to keep stable. Prefer a tracepoint whenever one covers your need (portable across kernels); drop to a kprobe only when no tracepoint exposes what you want.
Q: How do you measure the latency of a kernel function using bpftrace, and why is delete() important?
A: Stamp nsecs into a per-thread map at the entry probe and subtract at the return probe: kprobe:fn { @s[tid]=nsecs; } kretprobe:fn /@s[tid]/ { @=hist(nsecs-@s[tid]); delete(@s[tid]); }. The delete() removes the per-thread entry after use so the map does not grow without bound — a leak that, on a busy function, would consume kernel memory over time.
Q: A junior engineer runs strace -f -p <pid> on the busiest process in production to debug slowness, and the box gets worse. Explain.
A: strace uses ptrace and traps out of the process twice per syscall to the tracer, multiplying syscall cost by roughly 10–100×. On an already-busy process this instrumentation overhead is itself a large new load — the tracer caused the outage. The safe alternatives are perf trace, bcc’s syscount/trace, or a scoped bpftrace, which aggregate cheaply in-kernel.
Q: What is CO-RE and what problem did it solve? A: CO-RE (Compile Once, Run Everywhere) lets a single compiled eBPF object run across differing kernel versions. Using BTF (the kernel’s type information) and libbpf, the toolchain records where the program reads each kernel struct field and relocates those offsets at load time to match the running kernel. It replaced the old bcc model of recompiling from source on every host against local kernel headers, which dragged a full compiler toolchain onto production — CO-RE is what made fleet-wide eBPF practical.
Q: (LFCS/RHCSA-style) Without installing anything, use the kernel’s built-in tracer to see the ordered flow of the vfs_read call subtree. Then make sure you leave no tracing overhead behind.
A:
cd /sys/kernel/tracing
echo function_graph > current_tracer
echo vfs_read > set_graph_function
cat trace | head
echo nop > current_tracer          # critical cleanup
echo > set_graph_function
Q: (Practical) The API is slow but CPU is only 40% busy and load is high. Walk the drill-down.
A: Load high with idle CPU means tasks are waiting, not computing. Check iostat -xz 1 for a saturated disk (high %util, deep aqu-sz); if found, run biolatency-bpfcc for the latency distribution, then biosnoop-bpfcc (or a bpftrace on block_rq_issue/block_rq_complete) to name the process and files behind the slow I/O. If disk is clean, use offcputime-bpfcc to find where threads block off-CPU (locks, network). Each rung points to the next.
Q: Why is 99 Hz, not 100 Hz, the conventional profiling frequency? A: An odd frequency avoids sampling in lockstep with periodic kernel or application activity that runs at round numbers (100 Hz timers, per-second jobs). Sampling at exactly that cadence would bias the profile by repeatedly catching — or missing — the same periodic work; 99 Hz de-correlates the sampler from it.
Q: Which sysctls gate unprivileged access to eBPF and perf, and what is the live-versus-persistent rule for changing them?
A: kernel.unprivileged_bpf_disabled controls whether non-root may load BPF at all, and kernel.perf_event_paranoid controls how much perf access unprivileged users get (lower = more; -1 = everything). sysctl -w key=value changes the running kernel immediately but is lost on reboot; to persist, put the setting in a file under /etc/sysctl.d/ and apply with sysctl --system. Widening these lowers a security boundary, so do it deliberately.
Q: When would you choose ftrace over eBPF, and vice-versa?
A: Use ftrace/trace-cmd when you want the ordered flow of kernel function calls with per-call durations — “what did the kernel do, step by step.” Use eBPF (bcc/bpftrace) when you want to aggregate a custom answer in-kernel — a histogram, a per-key count — rather than a stream of individual events, or when you need to combine events, filter richly, or attach to user space. eBPF is more programmable; ftrace is simpler and always present.
Key takeaways
- Metrics detect, tracing diagnoses. When a metric goes bad you do not add a metric — you trace to find the cause. System tracing is how you make a running kernel answer a precise question, live, without a restart.
- Learn the event sources, not just the tools. Tracepoints (stable, static), kprobes/kretprobes (dynamic, any function), uprobes/USDT (user space), and perf events/PMCs are the finite set every tool hooks. Prefer tracepoints for portability; use kretprobes to measure latency.
perffirst, for CPU.perf statgives you IPC (the stall verdict),perf top/recordfind the hot function, and flame graphs turn thousands of stacks into one readable picture — width is on-CPU time, the x-axis is not time.- eBPF is safe because of the verifier. A program is proven to terminate and stay in bounds before it runs, then JIT-compiled; it aggregates in-kernel, so a finished histogram — not every event — crosses to user space, which is why overhead is a few percent.
- bcc for ready-made questions, bpftrace for your own. The bcc zoo (
execsnoop,biolatency,runqlat,tcpretrans,profile) covers most investigations; a bpftrace one-liner covers the rest — internalise the entry/returnhist(nsecs - @start[tid])latency pattern. - Follow the drill-down ladder. Glance → per-resource → profile → targeted bcc tool → bespoke bpftrace. Descend one rung only when the current one points somewhere, and stop when you have a name — never start deep.
- Tracing is not free, and can be the outage. Scope by pid/comm, aggregate in-kernel, avoid probes on ultra-hot paths,
stracenever touches busy production, and always reset ftrace’scurrent_tracertonop. Measure the tracer’s own cost withbpftop.