At 03:12 the pager fires: checkout writes are failing with ProvisionedThroughputExceededException. You open the DynamoDB console, look at the table’s ConsumedWriteCapacityUnits graph, and it is sitting at 40% of provisioned. The table is not out of capacity. Yet a specific slice of your traffic is being rejected, retried, backed-off, and eventually dropped, and orders are stalling. This is the single most misunderstood failure in Amazon DynamoDB, and the reason it is so maddening is that the number you instinctively check — table-level capacity — is the wrong number. DynamoDB does not throttle at the table; it throttles at the physical partition, and a table-wide average can hide one partition pinned at its hard ceiling.
This is the diagnostic playbook for that entire failure family. DynamoDB spreads your items across physical partitions by hashing the partition key, and every physical partition has a fixed ceiling — roughly 3,000 read capacity units (RCU) and 1,000 write capacity units (WCU) per second — regardless of how much capacity you provisioned for the whole table. Funnel traffic onto one key value (a hot key) or one narrow key range (a hot partition) and you hit that ceiling while the rest of the table idles. On top of this sit three mechanisms that everyone half-remembers and misapplies: adaptive capacity (which auto-isolates and boosts hot partitions but cannot exceed the partition max), burst capacity (banked unused throughput you can briefly spend), and the on-demand 2x rule (an on-demand table absorbs up to double your previous peak, then throttles a bigger spike). Get these wrong and you “fix” throttling by scaling the table up — spending money to make a problem that scaling cannot solve.
By the end you will stop guessing. You will read ThrottledRequests, ReadThrottleEvents/WriteThrottleEvents and Consumed-vs-Provisioned the way an ER doctor reads a monitor, use CloudWatch Contributor Insights to name the exact hot key instead of theorising, and apply the right fix for the right cause: write sharding, on-demand vs provisioned + auto-scaling, DAX caching, GSI capacity, and disciplined exponential backoff with jitter. The prose explains the mechanism; the tables — a ≥16-row symptom→cause→confirm→fix playbook, a capacity-math reference, an exception reference and a metric reference — are what you keep open at 03:12.
What problem this solves
Throttling is DynamoDB doing exactly what it promised: enforcing a per-partition throughput contract so one noisy key cannot starve the whole table or a neighbour’s table on shared infrastructure. The problem is that the symptom (ProvisionedThroughputExceededException, elevated latency, dropped writes) is generic, while the cause is specific and physical, and the two are separated by a layer — the partition — that the console does not show you by default. So teams misdiagnose. They see throttling, they see table capacity is not maxed, and they conclude “DynamoDB is flaky” or “we need to scale up.” Both conclusions are wrong and both are expensive.
What breaks without this knowledge: an on-call engineer doubles the table’s provisioned capacity (or flips to on-demand), the throttling on the hot key persists because the ceiling is per-partition not per-table, and now the bill is higher for no benefit. Or someone adds a Global Secondary Index to “speed up a query,” the GSI is under-provisioned, and suddenly base-table writes start throttling — because a throttled GSI applies backpressure to the writes that feed it — and nobody connects the new index to the write failures. Or a nightly Scan job quietly consumes the read capacity that the live API needs, and the API throttles at 09:00 every day with no code change to blame.
Who hits this: anyone running DynamoDB at real traffic. It bites hardest on time-series or sequential keys (today’s date, an auto-increment, a single “global counter” item), celebrity/hot-tenant workloads (one customer, one product, one game match with 100x the traffic of the median), write-heavy tables with GSIs, on-demand tables facing flash launches, and workloads that lean on Scan. The fix is almost never “add capacity” — it is “find the hot key and spread it, then read the metrics that prove you did.”
To frame the field before the deep dive, here is every throttle class this article covers, what it looks like, and the first place to look:
| Throttle class | What you see | First question | First place to look | Most common single cause |
|---|---|---|---|---|
| Hot key / hot partition | Throttle while table capacity looks idle | Is one key taking most traffic? | Contributor Insights → MostThrottledKeys | A single partition-key value with 100x traffic |
| Adaptive-capacity ceiling | Throttle persists after minutes on one key | Is it one key or many? | Contributor Insights + per-partition math | Single key exceeds 1,000 WCU / 3,000 RCU |
| GSI write backpressure | Base-table writes throttle | Did you recently add/undersize a GSI? | WriteThrottleEvents on the index dimension |
Under-provisioned or hot GSI |
| On-demand > 2x spike | Throttle right after a traffic step-change | Was there a flash > 2x previous peak? | Throttle burst timing vs launch event | Sudden spike beyond double previous peak |
| Provisioned under-capacity | Sustained throttle, table Consumed = Provisioned | Is Consumed pinned at the ceiling? | Consumed vs Provisioned overlay |
Genuinely too little provisioned capacity |
| Auto-scaling lag | Throttle for minutes, then self-heals | Did a spike outrun scaling? | Scaling activity + Consumed slope | Auto-scaling reacts in minutes, spike is seconds |
| Scan starvation | Read throttle correlated to a job | Is a Scan running? | ConsumedRead spike + CloudTrail Scan calls |
Full-table Scan eating shared RCU |
| Client-side (SDK) | App logs throttle, table metrics clean | Do table metrics even show it? | App retry logs vs ThrottledRequests |
Retries exhausted before DynamoDB is at fault |
Learning objectives
By the end of this article you can:
- Explain the per-partition physical limits (3,000 RCU / 1,000 WCU, 10 GB) versus table-level capacity, and prove why a hot key throttles when the table looks idle.
- Compute RCU/WCU for reads, eventually-consistent reads, transactions, writes and GSI replication, and catch the item-size math errors that silently double your cost.
- Describe adaptive capacity (isolate + boost) and state its hard limit, so you never wait for it to fix a single-key hot spot.
- Distinguish provisioned throttling (Consumed = Provisioned) from on-demand throttling (spike > 2x previous peak) and apply pre-warm / gradual ramp / warm throughput.
- Diagnose GSI write backpressure — why a throttled index throttles base-table writes — and fix it with capacity and projection changes.
- Read the metrics that tell the truth:
ConsumedvsProvisioned,ThrottledRequests,Read/WriteThrottleEvents, and use Contributor Insights to name the hot key. - Apply the right fix per cause: write sharding, on-demand vs provisioned + auto-scaling, DAX, GSI capacity, and exponential backoff with jitter.
- Run a lab that provokes throttling on purpose, confirms it via metrics + Contributor Insights, and fixes it — then tears it down cleanly.
Prerequisites & where this fits
You should already understand DynamoDB basics: a table has a partition key (the hash key) and optional sort key (range key); items are addressed by that key; you read with GetItem/Query and write with PutItem/UpdateItem/DeleteItem. You should know the two capacity modes — provisioned (you set RCU/WCU, optionally with auto-scaling) and on-demand (pay-per-request, elastic). You should be comfortable running the aws CLI and reading JSON. If any of that is shaky, start with DynamoDB tables, keys and capacity modes.
This sits in the Databases / operations track. The design-time counterpart is DynamoDB single-table design and data modeling — write sharding and key design (the real cure for hot partitions) live there, and this article points back to it repeatedly. When the fix is a partition-count or account-level ceiling rather than key design, AWS service quotas and limit increases is the process to raise it. For the broader “is DynamoDB even the right store” question, see RDS vs DynamoDB vs Aurora compared.
A quick map of who owns what during a throttling incident, so you page the right person:
| Layer | What lives here | Who usually owns it | Throttle classes it causes |
|---|---|---|---|
| App / SDK | Retry config, backoff, request shape | App / dev team | Client-side exhaustion, retry storms |
| Access pattern | Query vs Scan, key selection | App / data-modeling | Scan starvation, hot-key selection |
| Key design | Partition key cardinality, sharding | Data modeling / architect | Hot key, hot partition |
| Table capacity | Provisioned/on-demand, auto-scaling | Platform / owning team | Under-capacity, scaling lag, 2x spike |
| Indexes | GSI capacity, projection, key | Data modeling | GSI backpressure |
| Physical partitions | The 3,000/1,000 ceilings | AWS (managed) | The hard limit everything else maps onto |
Core concepts
Six mental models make every later diagnosis obvious.
DynamoDB throttles at the partition, not the table. When you write an item, DynamoDB hashes the partition key and routes the item to one physical partition. Table capacity is (roughly) the sum of what all partitions can do, but each individual partition has a fixed physical ceiling. If your traffic is uneven — one key hotter than the rest — you can pin one partition at its ceiling while the table average is low. The table-level graph is an average; the throttle is local.
A capacity unit is a rate against an item size. One WCU = one write per second of an item up to 1 KB; a 2.5 KB item costs 3 WCU (round up). One RCU = one strongly consistent read per second up to 4 KB; an eventually consistent read is half (0.5 RCU per 4 KB); a transactional read or write is double. Get the rounding or the consistency wrong and your real consumption is 2-4x your estimate — a common “why am I throttling?” that is pure arithmetic.
Adaptive capacity isolates and boosts — but is still capped at the partition max. DynamoDB continuously watches partition heat. It isolates frequently accessed items (splitting a hot partition so the hot key gets its own partition) and boosts a hot partition by lending it unused capacity from cold partitions. This is automatic and usually invisible — it absorbs moderate imbalance for free. What it cannot do is exceed the per-partition ceiling. If one key value needs more than 1,000 WCU or 3,000 RCU, adaptive capacity cannot save it; splitting does not help because you cannot split a single key across partitions. This is the number-one senior-level gotcha.
Burst capacity is a short-lived savings account. DynamoDB banks up to five minutes (300 seconds) of your unused throughput and lets you spend it in bursts above your provisioned rate. It smooths brief spikes — and it is why throttling sometimes appears only after a sustained load (you drained the bank). It is best-effort and not something to design around.
On-demand is elastic, but only up to double your recent peak. An on-demand table instantly serves up to twice the previous peak it has seen in the trailing window. Exceed that (a launch, a flash sale, a thundering-herd retry) and it throttles until it scales up over the next minutes. The fix is to pre-warm: ramp gradually (no more than doubling every ~30 minutes) or set warm throughput ahead of a known event.
The exception is a signal, not a failure — until retries run out. ProvisionedThroughputExceededException is DynamoDB saying “slow down.” The AWS SDKs treat it as retryable and automatically retry with exponential backoff and jitter. A well-behaved client rides through a brief throttle transparently; you only see errors when the throttle is sustained (real capacity problem) or your retry policy is wrong (too few retries, no jitter → synchronized retry storm).
The vocabulary in one table
| Term | One-line definition | Where it lives | Why it matters to throttling |
|---|---|---|---|
| Partition key | Hash key that routes an item to a partition | Table/item schema | Low cardinality → hot partition |
| Physical partition | The unit DynamoDB actually throttles | Managed by AWS | Hard 3,000 RCU / 1,000 WCU ceiling |
| RCU / WCU | Read/write capacity unit (rate × size) | Table/index capacity | Wrong math = surprise throttle |
| Adaptive capacity | Auto isolate + boost of hot partitions | Managed | Absorbs moderate skew; capped at part max |
| Burst capacity | Up to 300s of banked unused throughput | Managed | Smooths brief spikes; then throttles |
| On-demand mode | Pay-per-request, elastic capacity | Table setting | Throttles on > 2x previous-peak spikes |
| Provisioned mode | You set RCU/WCU (+ auto-scaling) | Table setting | Throttles when Consumed = Provisioned |
| GSI | Global Secondary Index (own partitions/capacity) | On the table | Throttled GSI throttles base writes |
| DAX | In-memory write-through cache for DynamoDB | Separate cluster | Absorbs hot reads (not writes) |
| Write sharding | Spreading a hot key across N suffixes | Key design | The real cure for a hot key |
| Contributor Insights | CloudWatch feature naming hot/throttled keys | CloudWatch | Turns “some key” into the exact key |
| Hot key | One partition-key value taking outsized traffic | Access pattern | Pins a single partition at its ceiling |
The physics of a partition: 3,000 RCU / 1,000 WCU
Everything starts here. A DynamoDB table is stored as a set of physical partitions; each holds up to 10 GB of data and can serve up to 3,000 RCU and 1,000 WCU. DynamoDB decides how many partitions you have from two inputs: your provisioned throughput and your stored data size. It creates enough partitions to satisfy whichever is larger, then distributes items by hashing the partition key. Two consequences matter for throttling: (1) if all your traffic lands on one key, it lands on one partition, and (2) partitions, once split, are not merged back — so a table that was briefly scaled to huge capacity keeps its higher partition count.
The per-partition limits you cannot exceed
| Dimension | Limit (per physical partition) | Scope | Note / gotcha |
|---|---|---|---|
| Read throughput | ~3,000 RCU/s | One partition | Hard ceiling; adaptive cannot exceed it |
| Write throughput | ~1,000 WCU/s | One partition | Hard ceiling; a single hot key caps here |
| Storage | 10 GB | One partition | Exceed → automatic split |
| Single partition-key value | ~3,000 RCU / ~1,000 WCU | One key value | You cannot split one key across partitions |
| Item size | 400 KB | Per item | Includes attribute names + values |
| Partition key length | 2,048 bytes | Per item | Long keys waste space, not throughput |
| Sort key length | 1,024 bytes | Per item | — |
| Item collection (with LSI) | 10 GB | One partition-key value | LSIs make a collection share one partition |
The single most important row is “single partition-key value.” Adaptive capacity can isolate a hot key onto its own partition, but that partition is still one partition with a 1,000 WCU / 3,000 RCU cap. A key that legitimately needs 5,000 WCU cannot be served, full stop, without spreading it across multiple key values (sharding). No amount of table capacity, and no feature, changes that.
How partition count is derived
| Driver | Formula (approx) | Example | Result |
|---|---|---|---|
| By provisioned throughput | ceil(RCU/3,000) and ceil(WCU/1,000) | 9,000 RCU, 2,000 WCU | ≥ 3 partitions (reads), ≥ 2 (writes) |
| By data size | ceil(dataGB / 10) | 45 GB | ≥ 5 partitions |
| Effective count | max(throughput-derived, size-derived) | above | max(3, 5) = 5 partitions |
| Per-partition share | provisioned ÷ partitions | 9,000 RCU ÷ 5 | ~1,800 RCU each (if evenly used) |
The “per-partition share” row is the trap: if capacity is divided across 5 partitions but your traffic hits 1, that 1 partition can burst on adaptive/burst capacity but ultimately caps at the physical ceiling, not at 9,000. Even distribution is an assumption, not a guarantee.
Capacity math: get the units right
Most “phantom” throttling is arithmetic. Round item size up to the unit boundary, then multiply by consistency and transaction factors.
| Operation | Consistency | Cost formula | Worked example |
|---|---|---|---|
| Read (GetItem/Query) | Strongly consistent | ceil(itemKB / 4) RCU | 8 KB item → 2 RCU |
| Read | Eventually consistent | ceil(itemKB / 4) × 0.5 RCU | 8 KB item → 1 RCU |
| Read | Transactional (TransactGetItems) | ceil(itemKB / 4) × 2 RCU | 8 KB item → 4 RCU |
| Write (PutItem/Update/Delete) | — | ceil(itemKB / 1) WCU | 2.5 KB item → 3 WCU |
| Write | Transactional (TransactWriteItems) | ceil(itemKB / 1) × 2 WCU | 2.5 KB item → 6 WCU |
| Query | Eventually consistent (default) | sum of matched items ÷ 4 KB × 0.5 | Charged on items matched by key, then filtered |
| Scan | Eventually consistent (default) | sum of scanned items ÷ 4 KB × 0.5 | Charged on items read before the filter |
| GSI write replication | — | ceil(projectedItemKB / 1) WCU on the GSI | Every base write that touches projected attrs |
| BatchWriteItem | — | per-item WCU, no transaction discount | Partial failures return UnprocessedItems |
Two rows cause the most surprises. Query charges for every item the KeyConditionExpression matches, before a FilterExpression removes any — so filtering a large partition down to one row still costs the full read. Scan charges for every item it reads across the whole table, filter or not. If your consumed RCU is wildly larger than the rows you get back, you are almost always doing a Scan or filtering after a broad Query.
Read/write consistency and its capacity cost
| Setting | RCU multiplier | Latency | When to use | Throttle implication |
|---|---|---|---|---|
| Eventually consistent read | 0.5× | Lowest | Default; most reads | Half the RCU → half the throttle risk |
| Strongly consistent read | 1× | Low | Read-after-write correctness | Doubles RCU vs eventual; can’t use DAX item cache the same way |
| Transactional read | 2× | Higher | All-or-nothing multi-item reads | 4× an eventual read; easy to under-provision |
| Transactional write | 2× | Higher | ACID multi-item writes | 2× WCU; a hot transacted key throttles fast |
How each API consumes capacity (and where it bites)
Different read APIs have very different throttle profiles even for the “same” data, because they differ in what they charge you for.
| API | Charged on | Consistency options | Throttle profile |
|---|---|---|---|
GetItem |
The one item’s size | Eventual or strong | Cheapest; hot only if the item is hot |
BatchGetItem |
Sum of returned items | Eventual or strong | Per-item; returns UnprocessedKeys on partial throttle |
Query |
Items matched by key condition (pre-filter) | Eventual (default) or strong | Filtering a big partition still costs the full read |
Scan |
Every item read (pre-filter), whole table/index | Eventual (default) or strong | Worst; scales with table size; starves live reads |
TransactGetItems |
2× the items’ size | Serializable | Doubles RCU; small transacted reads add up fast |
PutItem/UpdateItem/DeleteItem |
The item’s size (rounded to 1 KB) | — | Write ceiling is 1,000 WCU/partition |
TransactWriteItems |
2× the items’ size, ≤ 100 items | ACID | Doubles WCU; conflicts throw TransactionConflictException |
BatchWriteItem |
Per item, ≤ 25 items, no txn | — | Returns UnprocessedItems on partial throttle |
Throughput-related quotas and defaults
Some throttling is not your key design at all — it is an account, table, or item quota. Know these numbers before you assume the problem is a hot key. When a genuine ceiling is the cause, raise it via AWS service quotas and limit increases.
| Quota / limit | Default (soft unless noted) | Scope | Throttle / error when hit |
|---|---|---|---|
| Per-partition read | ~3,000 RCU (hard) | Physical partition | ProvisionedThroughputExceededException |
| Per-partition write | ~1,000 WCU (hard) | Physical partition | ProvisionedThroughputExceededException |
| Per-table throughput | High soft default (e.g., 40,000 RCU / 40,000 WCU) | Table | ThrottlingException / RequestLimitExceeded |
| Per-account throughput | Soft, region-level | Account/region | RequestLimitExceeded |
| Item size | 400 KB (hard) | Per item | ValidationException (item too large) |
| GSIs per table | 20 (soft) | Table | LimitExceededException on create |
| LSIs per table | 5 (hard) | Table (at creation only) | Create-time validation error |
| Projected attributes across all indexes | 100 (hard) | Table | Create-time validation error |
| Concurrent control-plane ops | Small (e.g., limited concurrent index creates) | Account | LimitExceededException |
| Item-collection size (with LSI) | 10 GB (hard) | Partition-key value | ItemCollectionSizeLimitExceededException |
Adaptive capacity, burst capacity, and their limits
These three mechanisms are the reason DynamoDB usually absorbs uneven traffic — and the reason engineers develop a false sense that it always will.
Adaptive capacity — what it does and what it can’t
| Property | Behaviour | Limit / caveat |
|---|---|---|
| Isolate frequently accessed items | Splits a hot partition so the hot key gets its own partition | Cannot split a single key value across partitions |
| Boost | Lends unused capacity from cold partitions to a hot one | Still capped at 3,000 RCU / 1,000 WCU per partition |
| Activation | Automatic, always on, no config | Reacts in seconds-to-minutes, not instantly |
| Best case | Absorbs moderate skew invisibly and for free | A single scorching key still throttles |
| Observability | Largely invisible; you infer it from throttle patterns | No direct “adaptive is active” metric |
Read the limit column twice. Adaptive capacity is brilliant at the moderate case: 20 partitions, one running 3x the others — it boosts and you never notice. It is powerless against the pathological case: one key that needs more than a whole partition can give. If Contributor Insights shows a single MostThrottledKeys entry dominating, adaptive capacity has already done all it can; the ball is in your court to shard.
Burst capacity
| Property | Value | Practical effect |
|---|---|---|
| Banked window | Up to 300 seconds (5 min) of unused throughput | Short spikes ride over provisioned rate |
| Consumption | Best-effort, spent automatically | You cannot reserve or guarantee it |
| Depletion symptom | Throttling appears after sustained above-rate load | The bank drained; now you’re at the hard rate |
| Design guidance | Do not architect around it | Treat as a bonus, not capacity |
Adaptive/burst vs the real fix — a decision table
| If you see… | It’s probably… | Do this |
|---|---|---|
| Brief throttle that self-heals in seconds | Burst bank drained then adaptive kicked in | Nothing, or add small headroom |
| One key dominating MostThrottledKeys | Single-key hot spot beyond a partition | Write-shard the key (design fix) |
| Many keys throttling, table Consumed = Provisioned | Genuine under-provisioning | Raise capacity / enable auto-scaling / on-demand |
| Throttle only during a nightly job | Scan or bulk job starving live traffic | Rate-limit the job, run off-peak, use a GSI |
| Throttle right after a launch on on-demand | > 2x previous-peak spike | Pre-warm / gradual ramp / warm throughput |
On-demand vs provisioned throttling
The two capacity modes throttle for different reasons, and confusing them sends you down the wrong fix.
The comparison that decides your mode
| Dimension | Provisioned (+ auto-scaling) | On-demand |
|---|---|---|
| You set | RCU/WCU targets (+ min/max/target%) | Nothing — pay per request |
| Throttles when | Consumed reaches Provisioned (per partition) | Spike exceeds ~2x previous 30-min peak |
| Elastic | Only as fast as auto-scaling reacts (minutes) | Instantly up to 2x peak, then scales up |
| Cost model | Cheapest for steady, predictable load | Cheapest for spiky/unknown load; ~6-7x unit price |
| Pre-warm | Set high min capacity before a launch | Set warm throughput / ramp gradually |
| Best for | Baseline production traffic you can forecast | New tables, spiky, unpredictable, dev/test |
| Hot-key behaviour | Still capped at partition max | Still capped at partition max |
The last row is the punchline: switching from provisioned to on-demand does not fix a hot key. On-demand removes the “I forgot to provision enough total capacity” class of throttling; it does nothing for the “all my traffic is on one key” class.
On-demand scaling behaviour
| Scenario | On-demand response | Throttle? | Fix |
|---|---|---|---|
| New table, first traffic | Serves an initial baseline instantly | Only if you exceed the baseline immediately | Pre-warm before launch |
| Traffic ≤ 2x previous peak | Absorbed instantly | No | — |
| Sudden spike > 2x previous peak | Scales up over minutes; excess throttles meanwhile | Yes, briefly | Ramp gradually, or set warm throughput |
| Steady growth | Peak tracks up; headroom grows with you | No | — |
| Retry storm after an outage | Thundering herd can exceed 2x | Yes | Backoff + jitter; pre-warm before failover |
Pre-warming, warm throughput and ramps
For a known event (a product launch, a migration cutover, a Black-Friday open), you must raise the ceiling before the traffic arrives.
| Technique | Mode | How | When |
|---|---|---|---|
| High minimum provisioned | Provisioned | Set auto-scaling min to your expected peak ahead of time |
Scheduled, predictable peaks |
| Scheduled scaling | Provisioned | Application Auto Scaling scheduled actions raise min at a time | Recurring daily/weekly peaks |
| Warm throughput | Both | UpdateTable with a target read/write units the table can immediately serve |
Ahead of a one-off flash |
| Gradual ramp | On-demand | Drive synthetic traffic doubling every ~30 min up to target | When you cannot set warm throughput |
| Max throughput cap | On-demand | Set MaxReadRequestUnits/MaxWriteRequestUnits to bound cost |
Guard against runaway spend, not against throttling |
If pre-warming still leaves you against an account-level ceiling (per-table or per-account throughput default), that is a quota, not a design problem — raise it via AWS service quotas and limit increases well before the event, because throughput increases are not always instant.
GSI throttling and write backpressure
This is the nastiest cause because the failure surfaces somewhere other than where the problem is. A Global Secondary Index has its own partitions and its own capacity, independent of the base table. Every base-table write that changes a projected attribute is asynchronously replicated to the GSI, consuming GSI WCU. Here is the trap: if the GSI cannot keep up — under-provisioned, or itself hot on its index key — DynamoDB applies backpressure and throttles the base-table writes that feed it. Your base table has plenty of capacity; your writes fail anyway; and nothing in the base-table capacity graph explains it.
GSI mechanics and failure modes
| Property | Behaviour | Throttle implication |
|---|---|---|
| Own capacity | GSI has separate RCU/WCU (or shares on-demand) | Under-provisioned GSI throttles independently |
| Write replication | Base write → async GSI write of projected attrs | GSI WCU consumed per relevant base write |
| Backpressure | Throttled GSI throttles base-table writes | Base writes fail though base capacity is fine |
| GSI hot key | GSI partition key can be hotter than base | An index key with low cardinality → GSI hot partition |
| Projection cost | ALL projects every attribute → biggest GSI writes | Narrow to KEYS_ONLY/INCLUDE to cut GSI WCU |
| Read isolation | GSI reads consume GSI RCU, not base RCU | A hot GSI read does not throttle base reads |
Projection types and their write cost
| Projection | What’s copied to the GSI | GSI write cost | When to use |
|---|---|---|---|
KEYS_ONLY |
Base + index keys only | Lowest | You only need keys, then GetItem on base |
INCLUDE |
Keys + a named subset of attributes | Medium | Query needs a few specific attributes |
ALL |
Every attribute | Highest | Query needs the full item; write-heavy = expensive |
Choosing ALL on a write-heavy table is a classic self-inflicted throttle: every base write now writes a full second copy, doubling effective WCU and giving the GSI more chances to fall behind and backpressure the base. Narrow the projection to what the query actually reads.
GSI vs LSI (why LSIs have their own throttle shape)
| Aspect | GSI | LSI (Local Secondary Index) |
|---|---|---|
| Partition key | Any attribute (own partitions) | Same as base (shares the partition) |
| Capacity | Separate RCU/WCU | Shares base-table capacity |
| Consistency | Eventually consistent only | Strong or eventual |
| Created | Any time | Only at table creation |
| Throttle shape | Backpressure to base writes | Counts against base capacity; 10 GB item-collection cap |
| Item-collection limit | None | 10 GB per partition-key value → ItemCollectionSizeLimitExceededException |
The exception and retry model
DynamoDB communicates throttling and other conditions through specific exceptions. Knowing which are retryable (let the SDK handle) versus terminal (fix the code) is half the battle.
Exception / error reference
| Exception | HTTP | Meaning | Retryable? | Fix |
|---|---|---|---|---|
ProvisionedThroughputExceededException |
400 | Request rate exceeded partition/table capacity | Yes (SDK auto-retries) | Reduce hot-key rate; shard; add capacity |
ThrottlingException |
400 | Control-plane or account-level throttling | Yes | Back off; check account limits |
RequestLimitExceeded |
400 | Account throughput ceiling reached | Yes | Raise account quota; spread load |
TransactionConflictException |
400 | Concurrent write conflict on a transacted item | Yes (with care) | Reduce contention on the hot item |
ItemCollectionSizeLimitExceededException |
400 | LSI item collection > 10 GB | No | Redesign; remove LSI; new partition key |
ValidationException (item size) |
400 | Item exceeds 400 KB | No | Split item; store blob in S3 + pointer |
ConditionalCheckFailedException |
400 | A condition expression was false | No | Expected; handle in app logic |
InternalServerError |
500 | Transient server-side error | Yes | Retry with backoff |
ServiceUnavailable |
503 | Service temporarily unavailable | Yes | Retry with backoff |
LimitExceededException |
400 | Too many control-plane ops (e.g., tables, concurrent index creates) | Yes (slowly) | Serialise control-plane ops |
ResourceInUseException |
400 | Table/index busy (e.g., still CREATING) | Sometimes | Wait for ACTIVE |
UnrecognizedClientException / AccessDenied |
400/403 | Auth/permissions, not throttling | No | Fix IAM (don’t retry blindly) |
A subtle but critical point: on an on-demand table, data-plane throttling still surfaces as ProvisionedThroughputExceededException (the name is historical). Do not assume “on-demand can’t throttle” because the exception mentions “Provisioned” — a > 2x spike throttles on-demand too, with this same exception.
SDK retry behaviour and backoff
| Aspect | Default behaviour | Tune it when |
|---|---|---|
| Retry on throttle | AWS SDKs auto-retry ProvisionedThroughputExceededException |
Almost never disable |
| Default max attempts | ~3 (standard) / adaptive mode available | Raise for bursty tolerant workloads; lower for latency-critical |
| Backoff | Exponential with jitter | Always keep jitter on to avoid retry storms |
| Adaptive retry mode | Client-side rate limiting on top of backoff | High-throttle environments |
| Batch APIs | Return UnprocessedItems/UnprocessedKeys (not an exception) |
You must re-submit these yourself with backoff |
The jitter point deserves emphasis. Without jitter, every throttled client retries at the same computed instant, producing a synchronized wave that re-throttles the table — a retry storm. “Full jitter” — sleep = random(0, min(cap, base × 2^attempt)) — de-synchronizes clients and is what the SDKs do by default. If you write your own retry loop, replicate it exactly.
Backoff math (base = 50 ms, cap = 20 s)
| Attempt | Exponential ceiling | With full jitter, actual sleep is… |
|---|---|---|
| 1 | 100 ms | random(0, 100 ms) |
| 2 | 200 ms | random(0, 200 ms) |
| 3 | 400 ms | random(0, 400 ms) |
| 4 | 800 ms | random(0, 800 ms) |
| 5 | 1,600 ms | random(0, 1,600 ms) |
| n | min(cap, 50 ms × 2^n) | random(0, that ceiling) |
The metrics that tell the truth
You cannot fix what you cannot see, and the DynamoDB console’s headline graph (table-level Consumed) is the least useful view for hot-partition throttling. These are the metrics to actually read.
CloudWatch metric reference
| Metric | What it tells you | Read it against | Throttle signal |
|---|---|---|---|
ConsumedReadCapacityUnits |
Actual RCU used | ProvisionedReadCapacityUnits |
Pinned at provisioned = under-capacity |
ConsumedWriteCapacityUnits |
Actual WCU used | ProvisionedWriteCapacityUnits |
Below provisioned but throttling = hot key |
ProvisionedRead/WriteCapacityUnits |
Your configured ceiling | Consumed | The overlay that reveals the gap |
ReadThrottleEvents |
Count of throttled read requests | Per table or per index | > 0 = read throttling somewhere |
WriteThrottleEvents |
Count of throttled write requests | Per table or per index | > 0 on index dim = GSI backpressure |
ThrottledRequests |
Requests throttled (by operation) | Operation dimension | The top-line “are we throttling?” |
OnlineIndexConsumedWriteCapacityUnits |
WCU used backfilling a new GSI | During index creation | Backfill competing with live writes |
SuccessfulRequestLatency |
p50/p99 latency by operation | Baseline | Latency creep before hard throttle |
SystemErrors |
5xx server errors | Baseline | Transient; retryable |
UserErrors |
4xx client errors (excl. throttle) | Baseline | Validation/auth, not capacity |
ConditionalCheckFailedRequests |
Failed condition expressions | Baseline | Contention, not throttle |
AccountMaxReads / AccountMaxTableLevelReads |
Account/table throughput ceilings | Consumed | Approaching an account quota |
The one row to internalise: ConsumedWriteCapacityUnits below Provisioned while WriteThrottleEvents > 0 is the signature of a hot partition. The table has capacity; a partition does not.
Contributor Insights — naming the hot key
CloudWatch Contributor Insights for DynamoDB builds rules over the request stream and surfaces the top keys. This is how you go from “some key is hot” to “key TENANT#42 is hot.”
| Rule | What it ranks | Use it to |
|---|---|---|
| MostAccessedKeys (partition) | Partition-key values by request count | Find the hot key |
| MostAccessedKeys (partition+sort) | Full key by request count | Find the hot item |
| MostThrottledKeys (partition) | Partition-key values by throttle count | Prove which key is being throttled |
| MostThrottledKeys (partition+sort) | Full key by throttle count | Pinpoint the throttled item |
Enable it per table (and optionally per index) with update-contributor-insights. It costs per event monitored, so enable it while diagnosing and consider disabling on very high-traffic tables when you are done.
Metric → diagnosis decision table
| If the metrics show… | Diagnosis | Confirm with | Fix |
|---|---|---|---|
| Consumed < Provisioned, ThrottleEvents > 0 | Hot partition / hot key | Contributor Insights MostThrottledKeys | Shard the key |
| Consumed = Provisioned, throttle sustained | Under-provisioned | Consumed overlay pinned | Raise capacity / auto-scale / on-demand |
| WriteThrottleEvents on index dimension | GSI backpressure | Index-scoped metric | Raise GSI capacity, narrow projection |
| ConsumedRead spike, few rows returned | Scan starvation | CloudTrail Scan events + --return-consumed-capacity |
Rate-limit / Query / off-peak |
| Throttle burst after a launch (on-demand) | > 2x peak spike | Timing vs event | Pre-warm / gradual ramp |
| App logs throttle, table metrics clean | Client-side / retries exhausted | Compare app logs to ThrottledRequests |
Fix retry config / backoff |
Architecture at a glance
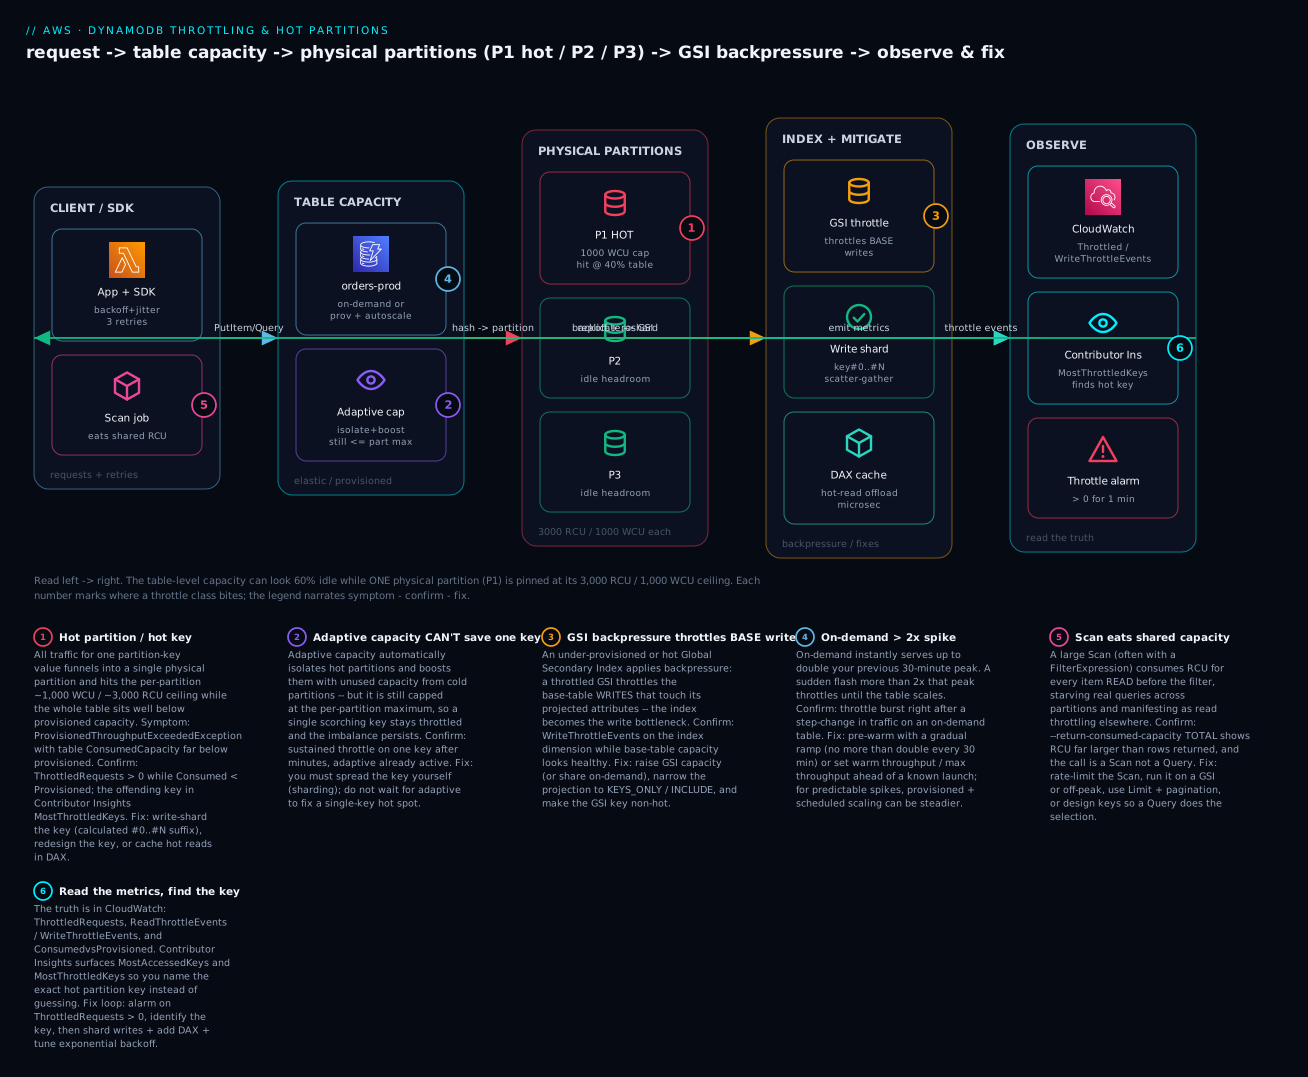
The diagram traces one request from the application SDK, through table-level capacity and adaptive capacity, down onto the physical partitions where throttling actually happens, across to the GSI (whose backpressure reaches back to base writes), and finally into the observability plane where CloudWatch and Contributor Insights let you name the cause. Read it left to right: the CLIENT issues PutItem/Query with backoff; TABLE CAPACITY routes by hashing the key; the PHYSICAL PARTITIONS panel shows the whole story — P1 is pinned at its 1,000 WCU ceiling and throttling while P2 and P3 sit idle, which is exactly why the table average looks healthy; INDEX + MITIGATE shows GSI backpressure alongside the two real fixes (write sharding and DAX); and OBSERVE shows the metrics and Contributor Insights that close the loop back to the client’s backoff-and-reshard behaviour. Each numbered badge marks where a throttle class bites, and the legend narrates each as symptom · confirm · fix.
Real-world scenario
Northwind Live runs a multi-tenant order-management SaaS on a single DynamoDB table, orders-prod, using single-table design: partition key TENANT#<id>, sort key ORDER#<ts>. The table is provisioned at 8,000 WCU with auto-scaling, comfortably above their average of ~4,500 WCU. For eighteen months, no throttling.
Then they onboard Meridian Retail, a customer 30x larger than their median tenant. Meridian’s Friday batch pushes ~6,000 orders/second — all under partition key TENANT#MERIDIAN. At 17:00 the first Friday, checkout starts failing. On-call opens the console: table ConsumedWriteCapacityUnits is ~5,200 against 8,000 provisioned. The table has 2,800 WCU of headroom. Yet WriteThrottleEvents is spiking and the app is throwing ProvisionedThroughputExceededException. On-call, seeing headroom, assumes a transient blip and raises provisioned to 12,000 WCU. No change. They raise it to 20,000. Still throttling. The bill is now climbing and orders are still failing.
The breakthrough comes from Contributor Insights, which someone enables at 17:40. MostThrottledKeys shows a single dominating entry: TENANT#MERIDIAN, taking ~99% of the throttles. The physics clicks: Meridian’s 6,000 WCU of writes all hash to one partition, which caps at 1,000 WCU. Adaptive capacity had already isolated TENANT#MERIDIAN onto its own partition and boosted it — and it still can’t exceed 1,000 WCU. No table-level number will ever fix this, because the ceiling is per-partition and the traffic is one key.
The real fix is write sharding, borrowed from their single-table design playbook. They change large-tenant writes to use a partition key of TENANT#MERIDIAN#<shard> where <shard> is 0..15 chosen by hash(orderId) % 16. Now Meridian’s 6,000 WCU fans across 16 partitions — ~375 WCU each, comfortably under the 1,000 ceiling. Reads that previously did one Query on TENANT#MERIDIAN become a scatter-gather: 16 parallel Queries, one per shard, merged in the app. They drop provisioned capacity back to 8,000 WCU (the sharding, not the extra capacity, was the cure) and add a CloudWatch alarm on WriteThrottleEvents > 0 for 1 minute so the next hot tenant is caught in seconds, not after a scaling spiral. Post-incident, they codify a rule: any tenant projected above ~800 WCU is provisioned onto a sharded key from day one. Cost went down (they reverted the panic scaling), reliability went up, and the runbook now starts with “enable Contributor Insights, read MostThrottledKeys” instead of “raise capacity.”
Advantages and disadvantages
The trade-off table below is really about the fixes, because throttling itself is not optional — it is the enforcement of a contract. The question is which mitigation you reach for.
| Approach | Advantages | Disadvantages |
|---|---|---|
| Write sharding | The only real cure for a hot key; unbounded write scale | Reads become scatter-gather (N queries); app complexity |
| On-demand mode | No capacity planning; absorbs spiky load instantly (≤2x) | ~6-7x unit price; still throttles > 2x spikes and hot keys |
| Provisioned + auto-scaling | Cheapest for steady load; predictable cost | Scales in minutes; a fast spike outruns it; still per-partition capped |
| DAX | Microsecond reads; absorbs hot read keys; cuts read RCU | Reads only (not writes); eventual consistency; extra cost + VPC |
| Exponential backoff + jitter | Rides through brief throttles transparently; free | Adds latency; masks a real capacity problem if over-tuned |
| Raise capacity | Fixes genuine under-provisioning fast | Does nothing for hot keys or GSI backpressure; costs money |
When each matters: reach for sharding whenever one key legitimately exceeds a partition’s ceiling (there is no substitute). Use DAX when the hot spot is reads of a small set of popular items (a product catalog, a leaderboard read path). Use on-demand when traffic is genuinely unpredictable and you cannot forecast; use provisioned + auto-scaling when you can. Keep backoff + jitter always on. Reach for raise capacity only after the metrics prove the table (not a partition) is the bottleneck.
Hands-on lab
You will provoke throttling with a deliberately hot key on a low-capacity provisioned table (free-tier-friendly), confirm it via WriteThrottleEvents and Contributor Insights, then fix it with write sharding and disciplined backoff. Everything runs from your shell with the aws CLI, plus a tiny Python load generator (boto3). Region is us-east-1; adjust as needed.
⚠️ Cost note: a small provisioned table (5 WCU / 5 RCU) is within the DynamoDB free tier (25 WCU + 25 RCU perpetual free). Contributor Insights and CloudWatch alarms cost a few cents while enabled. The optional DAX step creates a cluster that costs money per hour (no free tier) — only run it if you want to see caching, and delete it immediately after.
Step 1 — Create a deliberately low-capacity table
Provisioned at 5 WCU so a single hot key throttles almost instantly (this makes the hot-key signature easy to see even on a small table).
aws dynamodb create-table \
  --table-name throttle-lab \
  --attribute-definitions AttributeName=pk,AttributeType=S \
  --key-schema AttributeName=pk,KeyType=HASH \
  --billing-mode PROVISIONED \
  --provisioned-throughput ReadCapacityUnits=5,WriteCapacityUnits=5 \
  --region us-east-1

aws dynamodb wait table-exists --table-name throttle-lab --region us-east-1
echo "table ACTIVE"
Expected: after ~10-20s, table ACTIVE.
The Terraform equivalent (for the record — do not apply both):
resource "aws_dynamodb_table" "throttle_lab" {
  name         = "throttle-lab"
  billing_mode = "PROVISIONED"
  read_capacity  = 5
  write_capacity = 5
  hash_key     = "pk"

  attribute {
    name = "pk"
    type = "S"
  }
}
Step 2 — Enable Contributor Insights
So you can name the hot key later.
aws dynamodb update-contributor-insights \
  --table-name throttle-lab \
  --contributor-insights-action ENABLE \
  --region us-east-1
Expected: JSON echoing "ContributorInsightsStatus": "ENABLING". It becomes ENABLED within a minute.
Step 3 — Provoke throttling with a hot key
This script hammers a single partition-key value (HOTKEY) far above 5 WCU, forcing ProvisionedThroughputExceededException and WriteThrottleEvents.
# hot.py — pip install boto3
import boto3, time, uuid
from botocore.config import Config
from concurrent.futures import ThreadPoolExecutor

# Standard retry mode WITH jitter (SDK default), 3 attempts — realistic client.
ddb = boto3.client("dynamodb", region_name="us-east-1",
                   config=Config(retries={"max_attempts": 3, "mode": "standard"}))

throttled = 0
def put(_):
    global throttled
    try:
        ddb.put_item(TableName="throttle-lab",
                     Item={"pk": {"S": "HOTKEY"},          # <-- the hot key
                           "sk": {"S": str(uuid.uuid4())},
                           "payload": {"S": "x" * 500}})
    except ddb.exceptions.ProvisionedThroughputExceededException:
        throttled += 1

end = time.time() + 60
with ThreadPoolExecutor(max_workers=25) as ex:
    while time.time() < end:
        list(ex.map(put, range(200)))
print("throttled (after SDK retries):", throttled)
python hot.py
Expected: after 60 seconds, a nonzero throttled count — writes that failed even after the SDK’s exponential backoff retried them. That is a real, sustained throttle, not a blip.
Step 4 — Confirm via CloudWatch metrics
aws cloudwatch get-metric-statistics \
  --namespace AWS/DynamoDB \
  --metric-name WriteThrottleEvents \
  --dimensions Name=TableName,Value=throttle-lab \
  --start-time "$(date -u -v-10M +%Y-%m-%dT%H:%M:%SZ 2>/dev/null || date -u -d '10 minutes ago' +%Y-%m-%dT%H:%M:%SZ)" \
  --end-time "$(date -u +%Y-%m-%dT%H:%M:%SZ)" \
  --period 60 --statistics Sum \
  --region us-east-1
Expected: Datapoints with Sum > 0 for the minutes you ran the load. Now overlay consumed vs provisioned:
aws cloudwatch get-metric-statistics \
  --namespace AWS/DynamoDB --metric-name ConsumedWriteCapacityUnits \
  --dimensions Name=TableName,Value=throttle-lab \
  --start-time "$(date -u -v-10M +%Y-%m-%dT%H:%M:%SZ 2>/dev/null || date -u -d '10 minutes ago' +%Y-%m-%dT%H:%M:%SZ)" \
  --end-time "$(date -u +%Y-%m-%dT%H:%M:%SZ)" \
  --period 60 --statistics Sum --region us-east-1
Divide Sum by the period (60) to get per-second WCU; it will hover near your 5 WCU ceiling — the table is at its (tiny) provisioned limit, and the throttle is real.
Step 5 — Confirm the exact hot key in Contributor Insights
In the console: DynamoDB → Tables → throttle-lab → Monitor → Contributor Insights, rule Most throttled items / keys. You will see HOTKEY dominating. (Contributor Insights writes CloudWatch rules; give it a few minutes of traffic to populate.)
| Verification | Expected result | What it proves |
|---|---|---|
throttled count from hot.py |
> 0 | Throttle survived SDK retries (sustained) |
WriteThrottleEvents Sum |
> 0 | DynamoDB rejected writes |
| MostThrottledKeys top entry | HOTKEY |
The hot key is named, not guessed |
Step 6 — Fix 1: write sharding
Spread the hot key across 10 suffixes so writes fan across partitions. On a 5-WCU toy table you won’t see multi-partition scaling, but the code is the exact pattern you deploy in production (where it turns one 6,000-WCU partition into sixteen 375-WCU partitions).
# shard.py
import boto3, uuid, random
ddb = boto3.client("dynamodb", region_name="us-east-1")
SHARDS = 10

def put_sharded():
    shard = random.randint(0, SHARDS - 1)          # random write shard
    ddb.put_item(TableName="throttle-lab",
                 Item={"pk": {"S": f"HOTKEY#{shard}"},   # <-- fan-out key
                       "sk": {"S": str(uuid.uuid4())},
                       "payload": {"S": "x" * 500}})

# Read path becomes scatter-gather across all shards:
def query_all():
    items = []
    for s in range(SHARDS):
        r = ddb.query(TableName="throttle-lab",
                      KeyConditionExpression="pk = :p",
                      ExpressionAttributeValues={":p": {"S": f"HOTKEY#{s}"}})
        items += r["Items"]
    return items
The design lesson: writes get cheap (fan-out), reads get more expensive (scatter-gather across N shards). Choose N to cover your peak per-key WCU divided by ~800 (leaving headroom under 1,000). Deterministic sharding (e.g., hash(orderId) % N) lets you read a specific item without scatter-gather; random sharding maximizes write spread but forces scatter-gather for every read. The full treatment is in DynamoDB single-table design and data modeling.
Step 7 (optional, costs money) — Fix 2: DAX for hot reads
If your hot spot were reads of popular items, a DAX cluster absorbs them in-memory. Sketch only (delete promptly):
resource "aws_dax_cluster" "cache" {
  cluster_name       = "throttle-lab-dax"
  iam_role_arn       = aws_iam_role.dax.arn
  node_type          = "dax.t3.small"   # smallest; still billed hourly
  replication_factor = 1
  subnet_group_name  = aws_dax_subnet_group.this.name
}
Your app points the DAX client at the cluster endpoint; cache hits never touch the table, so hot-read RCU collapses. DAX is write-through and read caches are eventually consistent — it does nothing for write throttling.
Step 8 — Add a throttle alarm (so next time you’re paged in seconds)
aws cloudwatch put-metric-alarm \
  --alarm-name ddb-throttle-lab-writes \
  --namespace AWS/DynamoDB --metric-name WriteThrottleEvents \
  --dimensions Name=TableName,Value=throttle-lab \
  --statistic Sum --period 60 --evaluation-periods 1 \
  --threshold 0 --comparison-operator GreaterThanThreshold \
  --treat-missing-data notBreaching \
  --region us-east-1
resource "aws_cloudwatch_metric_alarm" "ddb_write_throttle" {
  alarm_name          = "ddb-throttle-lab-writes"
  namespace           = "AWS/DynamoDB"
  metric_name         = "WriteThrottleEvents"
  dimensions          = { TableName = "throttle-lab" }
  statistic           = "Sum"
  period              = 60
  evaluation_periods  = 1
  threshold           = 0
  comparison_operator = "GreaterThanThreshold"
  treat_missing_data  = "notBreaching"
}
Step 9 — Teardown
aws cloudwatch delete-alarms --alarm-names ddb-throttle-lab-writes --region us-east-1
aws dynamodb update-contributor-insights --table-name throttle-lab \
  --contributor-insights-action DISABLE --region us-east-1
# If you created DAX (Step 7), delete it FIRST — it bills hourly:
# aws dax delete-cluster --cluster-name throttle-lab-dax --region us-east-1
aws dynamodb delete-table --table-name throttle-lab --region us-east-1
echo "cleaned up"
Expected: alarm deleted, Contributor Insights disabling, table deleting. Confirm with aws dynamodb list-tables --region us-east-1 (no throttle-lab).
Common mistakes & troubleshooting
This is the heart of the article. Read the prose once, then keep the playbook open during an incident. The single most important habit: when you see throttling, do not look at table-level Consumed first — enable Contributor Insights and read MostThrottledKeys. The table average lies; the key list does not.
The playbook
| # | Symptom | Root cause | Confirm (exact command / console path) | Fix |
|---|---|---|---|---|
| 1 | ProvisionedThroughputExceededException, table Consumed ~40% |
Hot key: one partition-key value on one partition at its 1,000 WCU / 3,000 RCU cap | Contributor Insights → MostThrottledKeys shows one dominant key; WriteThrottleEvents>0 while ConsumedWCU<Provisioned |
Write-shard the key (KEY#0..#N); redesign for higher cardinality |
| 2 | Throttle persists after minutes on the same single key | Adaptive capacity already isolated + boosted the key; still capped at partition max | One key in MostThrottledKeys; per-partition math (needed WCU > 1,000) | Shard; do not wait for adaptive; do not raise table capacity |
| 3 | Base-table writes throttle; base capacity looks fine | GSI backpressure — under-provisioned or hot GSI throttles base writes | WriteThrottleEvents with the GSI/index dimension > 0 |
Raise GSI capacity (or on-demand); narrow projection to KEYS_ONLY/INCLUDE |
| 4 | Throttle burst right after a launch on an on-demand table | Spike exceeded ~2x previous 30-min peak before the table scaled | Throttle timing aligns with launch; on-demand table | Pre-warm: gradual ramp / set warm throughput ahead of the event |
| 5 | Sustained throttle, Consumed pinned at Provisioned | Genuine under-provisioning of the whole table | ConsumedWCU == ProvisionedWCU on the overlay |
Raise provisioned capacity / enable auto-scaling / switch to on-demand |
| 6 | Throttle for a few minutes then self-heals | Auto-scaling lag — a spike outran the (minutes-scale) scaling reaction | Scaling activity history shows a delayed scale-up | Higher min capacity; scheduled scaling; on-demand for spiky load |
| 7 | Read throttle every night at the same time | A Scan / bulk export eats shared RCU |
CloudTrail shows Scan; --return-consumed-capacity TOTAL RCU ≫ rows |
Rate-limit the Scan; run off-peak; use a GSI; add Limit + pagination |
| 8 | RCU far exceeds rows returned on a Query |
FilterExpression after a broad KeyCondition — you pay for matched-then-filtered items |
Compare ScannedCount vs Count; --return-consumed-capacity TOTAL |
Tighten the key condition; add a GSI so the selection is by key |
| 9 | App logs throttling; DynamoDB metrics are clean | Client-side: retries exhausted, or a client-side rate limiter | App retry logs vs ThrottledRequests (near zero) |
Fix SDK retry/backoff config; raise max attempts; add jitter |
| 10 | Retry storm — throttling gets worse under load | No jitter: all clients retry in sync, re-throttling the table | Bursty, periodic throttle spikes aligned to retry intervals | Use full-jitter backoff (SDK default); adaptive retry mode |
| 11 | ValidationException: Item size has exceeded the maximum |
Item > 400 KB (often an unbounded appended array) | Item size trend; the exact exception string | Split into multiple items (adjacency list); store blobs in S3 + pointer |
| 12 | ItemCollectionSizeLimitExceededException on writes |
An LSI item collection (one partition-key value) exceeded 10 GB | Exception on write to a table with an LSI | Redesign key; remove LSI; move to a GSI |
| 13 | TransactionConflictException spikes on one item |
Write contention on a single transacted item (a counter) | Metric TransactionConflict; MostAccessedKeys on that item |
Shard the counter; reduce transaction scope; optimistic retries |
| 14 | New GSI added, live writes start throttling | Backfill (OnlineIndexConsumedWriteCapacityUnits) competes + GSI under-provisioned |
That metric > 0 during index CREATING |
Create indexes off-peak; provision GSI generously; throttle backfill |
| 15 | On-demand table throttles though “on-demand can’t throttle” | > 2x spike or a hot key — on-demand is not immune to either | ProvisionedThroughputExceededException on an on-demand table |
Pre-warm for spikes; shard for hot keys |
| 16 | BatchWriteItem silently loses writes |
UnprocessedItems returned (partial throttle) but never re-submitted |
Inspect the API response for UnprocessedItems |
Loop re-submitting UnprocessedItems with backoff |
| 17 | Reads throttle only for strongly-consistent calls | Strong reads cost 2x eventual RCU; you sized for eventual | Compare consistency flag; RCU math | Use eventual consistency where correctness allows; add DAX for hot reads |
| 18 | Throttle after a big provisioned scale-down | Fewer partitions after a manual/scheduled scale-in concentrate traffic | Recent capacity decrease; partition math | Scale down gradually; keep headroom; watch throttle after scale-in |
| 19 | Global Tables replica region throttles | Replica writes (replication traffic) exceed replica capacity | WriteThrottleEvents in the replica region |
Provision replica capacity to match; on-demand on all replicas |
| 20 | Everything throttles, all keys, suddenly | Account/region throughput quota reached | RequestLimitExceeded; AccountMaxReads/AccountMaxTableLevelReads near ceiling |
Raise the account quota (Service Quotas); spread load across tables |
The three nastiest, in prose
1. The hot key that adaptive capacity cannot save (rows 1-2). This is the incident that burns hours because the instinct — “throttling + headroom = raise capacity” — is exactly wrong. Traffic concentrated on one partition-key value lands on one physical partition, capped at 1,000 WCU / 3,000 RCU, no matter how much you provision for the table. Adaptive capacity will have already isolated that key onto its own partition and boosted it with cold-partition capacity, and it still can’t exceed the per-partition ceiling, because you cannot split a single key value across partitions. The tell is Contributor Insights MostThrottledKeys showing one dominant entry while table ConsumedWCU sits below Provisioned. The only fix is to change the key so the traffic spreads: write sharding (KEY#0..#N), or a genuinely higher-cardinality key. Raising capacity, switching to on-demand, and waiting for adaptive all fail identically. Internalise the per-partition math: if one key needs more than 1,000 WCU, it needs more than one partition, which means more than one key value.
2. GSI backpressure — the throttle that surfaces on the wrong table (rows 3, 14). A Global Secondary Index has its own capacity and its own partitions. When it can’t keep up with the writes replicating into it — under-provisioned, or hot on its own index key — DynamoDB throttles the base-table writes that feed it. So you see write failures on orders-prod, you check orders-prod capacity, it’s fine, and you’re stuck — because the bottleneck is an index you may have forgotten you added. The confirmation is precise: pull WriteThrottleEvents scoped to the index dimension (or GlobalSecondaryIndexName), and you’ll see the throttle living on the GSI, not the table. Two things make it worse: a Projection of ALL on a write-heavy table (every write copies the whole item into the GSI, doubling effective WCU), and creating the index during peak (the backfill, visible as OnlineIndexConsumedWriteCapacityUnits, competes with live writes). Fix by provisioning the GSI to match base write rate (or putting the whole table on-demand so both scale together), narrowing the projection to KEYS_ONLY/INCLUDE, and only creating indexes off-peak.
3. The on-demand > 2x spike (rows 4, 15). On-demand feels like infinite capacity, so teams assume it can’t throttle. It can. An on-demand table serves up to double its previous 30-minute peak instantly; a launch, a flash sale, or a thundering-herd retry after an outage can blow past 2x before the table finishes scaling, and those excess requests throttle with the same ProvisionedThroughputExceededException (the name is historical, not a mode indicator). The confirmation is timing: a throttle burst that coincides with a step-change in traffic on an on-demand table. The fix is to raise the ceiling before the traffic: set warm throughput ahead of a known event, or ramp synthetic traffic up gradually (no more than doubling every ~30 minutes) so the previous-peak the table remembers is already high when real users arrive. For predictable recurring peaks, provisioned capacity with scheduled scaling can actually be steadier than on-demand, because you set the floor explicitly rather than relying on the 2x memory.
Best practices
- Design the partition key for even distribution first. High cardinality, no single dominant value. If any key can get hot, shard it from day one — retrofitting sharding during an incident is painful.
- Enable Contributor Insights on any table with hot-key risk. It is the difference between naming the culprit in 60 seconds and guessing for an hour. Disable on very high-traffic tables when not actively diagnosing (it costs per event).
- Alarm on
ThrottledRequests/ReadThrottleEvents/WriteThrottleEvents > 0, not on capacity. Throttling is the symptom that matters; a threshold of> 0 for 1 minutecatches hot keys before customers do. - Scope alarms and dashboards to the index dimension too. GSI backpressure is invisible on table-level metrics.
- Keep exponential backoff with jitter on, always. Trust the SDK defaults; if you hand-roll retries, replicate full jitter and re-submit
UnprocessedItems/UnprocessedKeys. - Never
Scanin a hot path. Design keys or a GSI so every steady-state read is aQuery/GetItem. Rate-limit unavoidable bulk Scans and run them off-peak. - Narrow GSI projections to
KEYS_ONLY/INCLUDEon write-heavy tables; reserveALLfor read-heavy, write-light indexes. - Pre-warm before known spikes (warm throughput / gradual ramp / high provisioned min) — do not discover the 2x rule during your launch.
- Prefer eventually consistent reads unless correctness truly requires strong reads (they cost 2x RCU).
- Cache hot reads with DAX when the read hot spot is a small popular set; it collapses read RCU and latency.
- Match GSI and replica capacity to the base write rate, or put base + GSIs + replicas all on on-demand so they scale together.
- Right-size, then shard — not the reverse. Confirm whether the bottleneck is table-wide (raise capacity) or single-key (shard) using the metric decision table before spending money.
Security notes
- Least-privilege data-plane IAM. Grant only the actions a role needs (
dynamodb:PutItem,Query, etc.), and scope to specific table/index ARNs. This also reduces throttle blast radius — a compromised or buggy role that can only touch one table can’t Scan your whole account into throttling. - Fine-grained access with
dynamodb:LeadingKeys. The condition key restricts a principal to items whose partition key matches their identity — useful in multi-tenant tables and a guard against one tenant’s code stampeding another tenant’s partition. - Separate read/write roles. A read-only reporting role that can only
Query/GetItem(neverScan) prevents accidental full-table scans that starve production reads. - Encryption at rest is on by default (AWS-owned key); use a customer-managed KMS key for audit and revocation control. Encryption does not affect throughput or throttling.
- VPC endpoints (Gateway) for DynamoDB keep traffic off the public internet; DAX runs inside your VPC and needs its own security-group rules (port 8111) and subnet group.
- Audit control-plane changes with CloudTrail — a scale-down, an index creation, or an on-demand switch can trigger throttling; CloudTrail tells you who changed what and when the throttle began.
- Guard Contributor Insights output —
MostAccessedKeyscan expose key values (which may embed tenant or user IDs) into CloudWatch; treat those logs as sensitive.
Cost & sizing
Throttling and cost are two sides of the same capacity coin: under-provision and you throttle, over-provision (or panic-scale) and you overpay. Sizing correctly is the fix for both.
What drives the bill
| Cost driver | How it’s charged | Throttle link |
|---|---|---|
| Provisioned RCU/WCU | Per unit-hour, whether used or not | Too low → throttle; too high → waste |
| On-demand requests | Per million read/write request units | Spiky load; ~6-7x provisioned unit price |
| GSI capacity | Same RCU/WCU pricing, separately | Under-sized GSI → base-write backpressure |
| Storage | Per GB-month | More data → more partitions (can help spread) |
| DAX | Per node-hour (no free tier) | Cuts hot-read RCU but adds fixed cost |
| Contributor Insights | Per event monitored | Cheap while diagnosing; disable at scale |
| Streams / backups / Global Tables | Separate line items | Replica capacity must match to avoid replica throttle |
On-demand vs provisioned — rough break-even
| Load shape | Cheaper mode | Reasoning |
|---|---|---|
| Steady, predictable, high utilization | Provisioned + auto-scaling | You pay for what you continuously use |
| Spiky, unpredictable, low average | On-demand | No idle capacity; pay per request |
| New table, unknown pattern | On-demand first | Learn the pattern, then consider provisioned |
| Dev/test, intermittent | On-demand | Near-zero when idle |
| Rule of thumb | Provisioned wins above ~15-20% sustained utilization | On-demand’s per-request premium overtakes idle provisioned cost |
Free tier and rough figures (us-east-1, indicative)
| Item | Free tier | Rough cost beyond free tier |
|---|---|---|
| Provisioned capacity | 25 WCU + 25 RCU, always free | ~$0.00013/WCU-hr, ~$0.00013/RCU-hr |
| Storage | 25 GB always free | ~$0.25/GB-month |
| On-demand writes | — | ~$1.25 per million WRUs (~₹105) |
| On-demand reads | — | ~$0.25 per million RRUs (~₹21) |
| DAX (dax.t3.small) | none | ~$0.04-0.05/node-hour → ~₹2,500-3,000/month if left on |
| Contributor Insights | none | ~$0.90 per million events monitored |
The single biggest cost mistake in a throttling incident is panic-scaling capacity to “fix” a hot key — it doesn’t work and it’s expensive. Confirm the cause first; sharding a hot key often lets you lower capacity afterward, as Northwind Live did.
Interview & exam questions
Q1. Why does a DynamoDB table throttle when its table-level consumed capacity is well below provisioned? Because DynamoDB enforces capacity at the physical partition, not the table. Traffic concentrated on one partition-key value hits one partition’s ~1,000 WCU / ~3,000 RCU ceiling while other partitions idle, so the table average looks healthy. (SAA-C03, DVA-C02)
Q2. What are the per-partition throughput limits, and can adaptive capacity exceed them? Roughly 3,000 RCU and 1,000 WCU per physical partition. Adaptive capacity isolates and boosts hot partitions but cannot exceed the per-partition maximum, so a single hot key beyond that ceiling still throttles.
Q3. How does adaptive capacity actually help, and where does it stop? It automatically isolates frequently accessed items (splitting them onto their own partition) and boosts a hot partition with unused capacity from cold ones. It stops at the per-partition ceiling and cannot split a single key value across partitions — the imbalance persists for a truly hot key.
Q4. Explain GSI write backpressure. A GSI has its own capacity; base writes replicate into it. If the GSI is under-provisioned or hot, DynamoDB throttles the base-table writes that feed it — so base writes fail even though base capacity is fine. Confirm via WriteThrottleEvents on the index dimension; fix with GSI capacity and a narrower projection.
Q5. Why can an on-demand table still throttle? On-demand serves up to 2x the previous 30-minute peak instantly; a sudden spike beyond that throttles until it scales. It also cannot beat a hot-key partition ceiling. Pre-warm (warm throughput / gradual ramp) for spikes; shard for hot keys.
Q6. What is burst capacity and why does throttling sometimes appear only after sustained load? DynamoDB banks up to 300 seconds of unused throughput to spend on brief spikes. Under sustained above-rate load you drain the bank, then throttle at the hard rate — so the throttle can appear a few minutes in.
Q7. How do you find which key is hot? Enable CloudWatch Contributor Insights for the table (and index) and read the MostAccessedKeys / MostThrottledKeys rules, which rank partition-key (and partition+sort) values by request and throttle counts.
Q8. What’s the capacity difference between a strongly consistent, eventually consistent, and transactional read of an 8 KB item? Eventually consistent = 1 RCU (0.5 × 2), strongly consistent = 2 RCU, transactional = 4 RCU. Consistency and transactions multiply RCU, a common under-provisioning error.
Q9. Why is Scan dangerous for capacity? Scan consumes RCU for every item read before any FilterExpression, scaling with table size, not result size. A large Scan can starve live reads. Prefer Query/GetItem; rate-limit unavoidable Scans and run them off-peak.
Q10. What is write sharding and what does it cost you? Adding a suffix (KEY#0..#N) to a hot partition key so writes fan across N partitions, beating the per-partition ceiling. The cost is read complexity: reads become scatter-gather across all shards (unless you shard deterministically and know the shard).
Q11. Your client logs throttling but DynamoDB’s ThrottledRequests is ~0. What happened? The throttling is client-side — SDK retries exhausted, or a client-side rate limiter — not DynamoDB rejecting requests. Fix the retry configuration (max attempts, jitter), not the table capacity.
Q12. How should a client behave when throttled, and why is jitter essential? Retry with exponential backoff and jitter. Jitter de-synchronizes clients so they don’t all retry at the same instant and re-throttle the table (a retry storm). The AWS SDKs do full jitter by default.
Quick check
- A table shows
WriteThrottleEvents > 0whileConsumedWriteCapacityUnitsis 45% of provisioned. What is the most likely cause, and what is the fix? - True or false: switching a throttling table from provisioned to on-demand will fix a hot-key problem.
- Your base-table writes are throttling but base capacity looks fine. Which metric dimension do you check, and what’s the cause?
- An 8 KB item read transactionally costs how many RCU?
- What single CloudWatch feature turns “some key is hot” into the exact key value, and which rule do you read?
Answers
- A hot key / hot partition — one partition-key value pinned at the ~1,000 WCU per-partition ceiling while the table averages low. Fix: write-shard the key (
KEY#0..#N); raising table capacity won’t help. - False. On-demand removes total-capacity planning but is still capped at the per-partition ceiling for a single key; the hot key still throttles.
- Check
WriteThrottleEventson the GSI / index dimension — the cause is GSI backpressure from an under-provisioned or hot index throttling the base writes that feed it. - 4 RCU — 8 KB = 2 units of 4 KB, strongly consistent = 2 RCU, transactional doubles it to 4 RCU.
- CloudWatch Contributor Insights, reading the MostThrottledKeys (and MostAccessedKeys) rule.
Glossary
- Physical partition — the storage/throughput unit DynamoDB actually throttles; ~3,000 RCU, ~1,000 WCU, 10 GB each.
- Partition key (hash key) — the attribute DynamoDB hashes to route an item to a partition; low cardinality causes hot partitions.
- Hot key / hot partition — one key value (or narrow range) taking outsized traffic, pinning a single partition at its ceiling.
- RCU / WCU — read/write capacity unit: a rate (per second) against an item size (4 KB read / 1 KB write), modified by consistency and transactions.
- Adaptive capacity — DynamoDB’s automatic isolation and boosting of hot partitions; cannot exceed the per-partition maximum.
- Burst capacity — up to 300 seconds of banked unused throughput spendable in brief spikes.
- On-demand mode — pay-per-request capacity that scales to ~2x the previous peak instantly; throttles on larger spikes.
- Provisioned mode — you set RCU/WCU (optionally with auto-scaling); throttles when consumed reaches provisioned per partition.
- GSI (Global Secondary Index) — an index with its own key, partitions and capacity; a throttled GSI throttles base-table writes.
- GSI backpressure — the mechanism by which an over-loaded index throttles the base writes replicating into it.
- LSI (Local Secondary Index) — an index sharing the base partition and capacity; introduces the 10 GB item-collection limit.
- DAX — DynamoDB Accelerator, an in-memory write-through cache that absorbs hot reads (eventually consistent), not writes.
- Write sharding — spreading a hot partition key across N suffixes to fan writes across partitions; reads become scatter-gather.
- Contributor Insights — CloudWatch feature that ranks the most accessed and most throttled keys, naming the hot key.
- Warm throughput / pre-warm — raising the throughput a table can immediately serve ahead of a known traffic spike.
- Exponential backoff with jitter — the retry strategy (
sleep = random(0, min(cap, base × 2^attempt))) that rides through throttles without retry storms. ProvisionedThroughputExceededException— the (historically named) retryable exception DynamoDB raises when a request rate exceeds partition/table capacity, on both provisioned and on-demand tables.
Next steps
- Master the design-time cure — key design and write sharding — in DynamoDB single-table design and data modeling.
- Solidify the fundamentals this article assumes in DynamoDB tables, keys and capacity modes.
- When the ceiling is an account or per-table quota rather than a key, follow AWS service quotas and limit increases.
- Decide whether DynamoDB is even the right store for a workload in RDS vs DynamoDB vs Aurora compared.