The dashboard is red, the app is timing out, and someone in the incident channel types the sentence that wastes the next two hours: “the database is slow.” That is not a diagnosis — it is a feeling. A database is never just “slow”; at every instant its sessions are either running on a CPU or waiting on something specific — a data page that isn’t in memory, a row lock another transaction is holding, a commit flushing to disk, a client that hasn’t sent the next query yet. Amazon RDS Performance Insights exists to turn “slow” into a noun. It measures database load in one honest unit — Average Active Sessions (AAS) — and lets you slice that load by the exact thing sessions are waiting on. Once you can read it, an RDS incident stops being a guessing game and becomes a two-minute lookup: what is the top wait event, which SQL is causing it, and what fixes that class of wait.
This is the diagnostic method, not a feature tour. You will learn to read the one chart that matters — the DB-load band against the Max vCPU line — and to reason from its shape: a band sitting below the line is a healthy database with spare cores; a band towering above it is sessions queued and waiting, and the colours in that band name the bottleneck. You will learn the wait events that actually show up in production (CPU, PostgreSQL IO:DataFileRead, Lock:tuple/Lock:transactionid, LWLock, Client:ClientRead, IO:XactSync; MySQL’s wait/io/table/sql/handler, wait/synch/mutex, wait/io/redo_log), what each one means physically, and the fix that makes it shrink. And because Performance Insights only tells you where the load is, you will pair it with the tools that tell you why — the slow query log, pg_stat_statements, and EXPLAIN (ANALYZE, BUFFERS) — and with Enhanced Monitoring and CloudWatch for the OS and service layers underneath.
By the end you will have a runbook you can open at 02:00: enable the telemetry, read the DB-load band, identify the top wait, drop to the query with the API (aws pi get-resource-metrics), confirm the root cause with an exact command, apply the fix — an index, a parameter, an ANALYZE, or RDS Proxy — and prove it worked by watching the wait shift. Every step comes with both the aws CLI and a Terraform resource, real instance classes and defaults, real error strings, and the exact metric to check. Read the prose once; keep the tables open when the pager is live.
What problem this solves
RDS hides a real database engine behind a managed control plane, which is a gift right up until it slows down — then the abstraction becomes a wall. You cannot perf top the host, you cannot always attach to the box, and the engine’s internal counters are scattered across catalog views most on-call engineers have never queried. So the information you need to diagnose a slowdown is real and captured, but it lives in four different places (Performance Insights, Enhanced Monitoring, CloudWatch, and the engine’s own logs), and if you don’t know which place answers which question you burn the incident clicking through consoles.
What breaks without this skill: the team reacts to the symptom metric — high CPU, high ReadIOPS, climbing ReadLatency — and “fixes” it by scaling the instance up a size. Sometimes that masks the problem for a week (a bigger cache hides a missing index until the table grows again); usually it just moves money without moving the bottleneck. Meanwhile the actual cause — a single query seq-scanning a 40-million-row table, one idle in transaction session holding a lock, or a Lambda fleet opening a new connection per invocation — sits there, perfectly diagnosable, ignored. The most expensive words in cloud databases are “just make it a bigger instance.”
Who hits this: every team running a production relational workload on RDS or Aurora. It bites hardest on read-heavy apps with unindexed access paths (IO waits), write-contended tables and long transactions (Lock waits), serverless and autoscaling compute that fans out connections (connection storms), and Postgres tables with heavy churn (autovacuum falling behind, bloat, and — the doomsday case — transaction-ID wraparound). The fix is almost never “scale up.” It is “read the wait, find the query, change one thing, confirm the wait moved.”
To frame the whole field before the deep dive, here is every bottleneck class this article covers, the wait it shows up as, and the one place to look first:
| Bottleneck class | Shows up in PI as | First question to ask | First place to look | Most common single cause |
|---|---|---|---|---|
| CPU-bound | CPU band above Max vCPU |
Is the work necessary, or a bad plan? | PI top SQL by load; EXPLAIN |
Missing index → seq scan chewing CPU |
| Storage-IO-bound | IO:DataFileRead (PG) / wait/io/... (MySQL) |
Does the working set fit in RAM? | PI wait event + ReadIOPS/cache hit |
Cold cache / undersized instance / big scan |
| Lock-bound | Lock:tuple, Lock:transactionid, Lock:relation |
Who is blocking whom? | pg_blocking_pids(); PI top SQL |
Long/blocking transaction; missing FK index |
| Commit-IO-bound | IO:XactSync, IO:WALWrite |
Are we fsync-ing every tiny commit? | PI wait; WriteLatency |
Row-at-a-time commits; slow storage |
| Connection-bound | Many sessions + Client:ClientRead |
Are we near max_connections? |
DatabaseConnections metric |
Connection storm from serverless fan-out |
| Maintenance-bound | IO/CPU spikes; bloat symptoms | Is autovacuum keeping up? | pg_stat_user_tables; RDS events |
Autovacuum behind → bloat → wraparound risk |
Learning objectives
By the end of this article you can:
- Read DB load as Average Active Sessions and interpret it against the Max vCPU line — instantly telling a healthy database from a saturated one, and CPU-bound from wait-bound.
- Drive the Performance Insights dashboard and API: slice DB load by wait event, top SQL, top hosts / users / databases, and read the counter metrics, using
aws pi get-resource-metricsanddescribe-dimension-keys. - Name the wait events that matter on PostgreSQL and MySQL, explain what each one means physically, and map it to a fix.
- Choose the right lens for each question — Performance Insights (DB internals) vs Enhanced Monitoring (OS metrics at 1s) vs CloudWatch (service metrics) — and know the granularity, retention and cost of each.
- Find the offending query with the slow query log,
pg_stat_statements/Performance Schema, and readEXPLAIN (ANALYZE, BUFFERS)to spot missing indexes and bad plans. - Diagnose and resolve the three nastiest classes:
IO:DataFileRead(cold cache / undersized), Lock waits (blocking transactions), and connection-storm CPU (→ RDS Proxy). - Tune the parameters that move the needle —
shared_buffers,work_mem,effective_cache_size,max_connections— via parameter groups, and keep autovacuum ahead of bloat and transaction-ID wraparound.
Prerequisites & where this fits
You should be comfortable with core RDS mechanics: an RDS DB instance runs a managed engine (PostgreSQL, MySQL, MariaDB, Oracle, SQL Server, or Aurora’s MySQL/PostgreSQL-compatible editions) on an instance class (db.r6g.xlarge, db.m7g.large), backed by EBS storage (gp3 / io2) in private subnets. You should know how to run the aws CLI, read JSON output, connect with psql/mysql, and read basic SQL and an execution plan. Familiarity with DB parameter groups (how engine settings are changed on RDS) and security groups helps. You do not need prior Performance Insights experience — that is what this builds.
This sits in the Databases / Observability track and is downstream of the launch fundamentals. It assumes you can already stand up an instance — see Launching Amazon RDS: MySQL & PostgreSQL Hands-On — and it pairs tightly with two siblings: RDS Connection Timeouts: A Troubleshooting Playbook (the connection-storm and max_connections failures you’ll see here as load) and RDS Multi-AZ & Read Replicas for High Availability (offloading read load and the replica-lag waits that follow). If you are still choosing an engine, AWS Databases: RDS, DynamoDB and Aurora Compared is upstream of everything here.
A quick map of who owns which layer during a performance incident, so you pull in the right person and the right tool fast:
| Layer | What lives here | Right tool | Failure classes it explains |
|---|---|---|---|
| Application / driver | Query text, ORM, connection pool | App logs; PI top SQL/host | Connection storms, Client:ClientRead, N+1 |
| SQL / query plan | Execution plans, indexes, stats | EXPLAIN, pg_stat_statements |
Seq scans, bad joins, missing indexes |
| Engine internals | Buffers, locks, WAL, autovacuum | Performance Insights | Every wait event; DB load composition |
| OS / host | CPU, memory, disk queue, load avg | Enhanced Monitoring | Host CPU steal, swap, disk saturation |
| Storage (EBS) | IOPS, throughput, latency | CloudWatch RDS metrics | ReadLatency, IOPS/throughput ceilings |
| Service / capacity | Instance class, connections, storage | CloudWatch + RDS events | DatabaseConnections, storage full, failover |
Core concepts
Five mental models make every later diagnosis obvious.
DB load is measured in Average Active Sessions, and that is the only load number that matters. A session (a database connection running a statement) is active when it is either executing on a CPU or waiting on something. Average Active Sessions (AAS) is the mean number of active sessions across a time window — if AAS is 3.5, then on average 3.5 sessions were doing work (or waiting to) at every instant. Unlike CPU% (which caps at 100% and hides queueing) or connection count (which counts idle sessions too), AAS captures demand for the database directly, and Performance Insights renders it as a stacked band coloured by what each session was doing. This single metric — db.load.avg in the API — is the spine of the whole method.
The Max vCPU line is the whole game. Performance Insights draws a horizontal line on the DB-load chart at a value equal to the instance’s vCPU count (a db.r6g.xlarge has 4 vCPUs, so the line is at 4). It represents how many sessions can be running on a CPU simultaneously. When AAS is below the line, there are free cores — the database is not CPU-saturated. When AAS sits above the line, more sessions want to run or are blocked than the machine can serve at once, and they queue. So the shape tells you the category before you read a single wait: band under the line and mostly CPU colour = healthy; band far above the line = a bottleneck, and the dominant colour names it.
The whole diagnostic question is “what are sessions waiting ON.” Every non-CPU slice of the band is a wait event — a named reason a session isn’t making progress. IO:DataFileRead means “waiting for a data page to come from storage.” Lock:transactionid means “waiting for another transaction to finish so I can take a row lock.” Client:ClientRead means “waiting for the client to send the next command.” You never fix “the database”; you find the tallest wait and fix that. When you fix it, that colour shrinks and a different one becomes tallest — you either chase the new bottleneck or stop because the band dropped under the line.
Performance Insights tells you where; the engine’s own tools tell you why. PI will point at a specific SQL digest waiting on IO:DataFileRead, but it will not tell you the query is missing an index — for that you run EXPLAIN (ANALYZE, BUFFERS) and see a Seq Scan reading four million buffers. PI localises; pg_stat_statements, the slow query log, and EXPLAIN explain. Using PI without them leaves you knowing the address but not the crime.
Scaling up is the last resort, not the first. A bigger instance raises the Max vCPU line and enlarges the cache, so it can absorb a bad query — but it does so by paying more every hour to avoid a one-line CREATE INDEX. Right-sizing is real and sometimes correct (a genuinely cold, undersized cache is an IO problem money solves), but you earn the right to scale by first proving with a wait event that the instance, not the query, is the constraint.
The vocabulary in one table
Before the deep sections, pin down every moving part. The glossary repeats these for lookup; this is the mental model side by side:
| Concept | One-line definition | Where it lives | Why it matters |
|---|---|---|---|
| Active session | A connection running or waiting on a statement | Engine | The unit DB load is built from |
| Average Active Sessions (AAS) | Mean active sessions over time | PI db.load.avg |
The one load number that matters |
| Max vCPU line | AAS value = instance vCPU count | PI chart | AAS above it = queued/waiting |
| Wait event | Named reason a session isn’t progressing | Engine wait tables → PI | Tells you what to fix |
| Wait event type | Class of wait (CPU, IO, Lock, LWLock, Client…) | PI grouping | First-level triage |
| Top SQL | The statements driving the most load | PI db.sql dimension |
The thing you actually change |
| Counter metric | A numeric gauge shown beside DB load | PI counters | Corroborates the wait (cache hit, blks read) |
pg_stat_statements |
Postgres extension aggregating query stats | Engine extension | Source of PI top SQL (PG) |
| Performance Schema | MySQL’s internal instrumentation | Engine | Source of PI top SQL + waits (MySQL) |
| Enhanced Monitoring | OS-level metrics down to 1-second | CloudWatch Logs RDSOSMetrics |
Host CPU/mem/disk truth |
| DB parameter group | The engine config you can change on RDS | RDS control plane | How you tune work_mem et al. |
| Autovacuum | Postgres background reclaim of dead rows | Engine | Prevents bloat + XID wraparound |
Reading DB load: Average Active Sessions and the Max vCPU line
The DB-load chart is the first thing you open and the last thing you trust. Learn to read its height relative to the Max vCPU line and its colour composition, and you have triaged the incident before touching a query.
Interpreting the band’s height
Read AAS as a multiple of vCPUs. The table below is the entire first-order triage — memorise it:
| What you see | AAS vs Max vCPU | It means | Do this |
|---|---|---|---|
Band hugs the floor, mostly CPU |
AAS ≪ vCPU | Idle / healthy | Nothing — spare capacity |
Band near the line, mostly CPU |
AAS ≈ vCPU | Busy but CPU-efficient | Fine; watch headroom |
Band well above line, mostly CPU |
AAS > vCPU, CPU-dominant | CPU saturation — too much work or a bad plan | PI top SQL → EXPLAIN → index/rewrite; then maybe scale up |
| Band above line, mostly one non-CPU colour | AAS > vCPU, wait-dominant | Sessions blocked on that wait, not CPU | Fix the wait class — scaling CPU won’t help |
| Band spiky, tracks a cron/job time | AAS bursts | Batch/report/backup window | Schedule off-peak; isolate on a replica |
| Band flat-lines at a ceiling | AAS pinned at max_connections shape |
Connection or lock saturation | Check DatabaseConnections; RDS Proxy / kill blocker |
The single most common misread is treating a tall band as “need a bigger instance.” If the band is tall but green/CPU is a thin sliver and the tall colour is IO:DataFileRead or Lock:*, a bigger CPU does nothing — you have a storage or locking problem, and the extra cores sit idle while sessions wait.
Reading DB load from the API
You do not need the console. The DB-load average over a window, grouped by wait event, is one call. First get the instance’s PI resource id (the DbiResourceId, not the instance name):
# Resolve the Performance Insights resource id (db-XXXX...), which the pi API uses
RESID=$(aws rds describe-db-instances \
  --db-instance-identifier shop-prod-pg \
  --query "DBInstances[0].DbiResourceId" --output text)
echo "$RESID"   # e.g. db-ABCDEFGH1234567890
Now pull db.load.avg grouped by db.wait_event for the last hour at 1-minute resolution:
aws pi get-resource-metrics \
  --service-type RDS --identifier "$RESID" \
  --start-time "$(date -u -v-1H +%Y-%m-%dT%H:%M:%SZ)" \
  --end-time   "$(date -u +%Y-%m-%dT%H:%M:%SZ)" \
  --period-in-seconds 60 \
  --metric-queries '[{"Metric":"db.load.avg","GroupBy":{"Group":"db.wait_event","Limit":7}}]'
For a fast “what are the top waits right now” answer, describe-dimension-keys returns the ranked contributors without the time series:
aws pi describe-dimension-keys \
  --service-type RDS --identifier "$RESID" \
  --start-time "$(date -u -v-15M +%Y-%m-%dT%H:%M:%SZ)" \
  --end-time   "$(date -u +%Y-%m-%dT%H:%M:%SZ)" \
  --metric db.load.avg \
  --group-by '{"Group":"db.wait_event","Limit":10}'
Swap the Group to pivot the same load a different way — this is the whole “slice it” workflow in one parameter:
Group value |
Slices DB load by | Answers | Engine source |
|---|---|---|---|
db.wait_event |
Wait event (e.g. IO:DataFileRead) |
What are sessions waiting on | wait tables |
db.wait_event_type |
Wait class (CPU, IO, Lock…) | Which category dominates | wait tables |
db.sql |
SQL statement digest | Which query drives the load | pg_stat_statements / P_S |
db.sql_tokenized |
Normalised SQL (params stripped) | The query shape, aggregated | pg_stat_statements |
db.host |
Client host / IP | Which app node drives it | connection info |
db.user |
DB user | Which service account | connection info |
db.application |
application_name |
Which app (if set) | connection info |
db.database |
Database name | Which schema/tenant | connection info |
The counter metrics that corroborate a wait
DB load tells you the shape; the counter metrics beside it tell you the magnitude and confirm the story. You can request them through the same API (db.* and os.* metrics). The ones that matter for each wait:
| Counter metric | What it measures | Confirms which wait | Healthy vs bad |
|---|---|---|---|
os.cpuUtilization.total |
Host CPU % | CPU |
Sustained >80–90% = CPU-bound |
db.Cache.blks_hit / buffer cache hit ratio |
Pages served from shared_buffers |
IO:DataFileRead |
<95–99% = too many reads miss cache |
db.IO.blk_read_time (PG) |
Time spent reading blocks | IO:DataFileRead |
Rising = storage-bound reads |
os.diskIO.*.readIOsPS |
Physical read IOPS | IO:DataFileRead |
Near EBS ceiling = throttled |
db.Transactions.xact_commit |
Commits/sec | IO:XactSync |
Very high with tiny txns = fsync storm |
db.SQL.tup_returned / tup_fetched |
Rows returned vs fetched | seq scans | fetched ≫ returned = scanning then filtering |
db.Concurrency.deadlocks (PG) |
Deadlocks | Lock:* |
Any sustained = lock design problem |
DatabaseConnections (CloudWatch) |
Open connections | connection storm | Near max_connections = storm/leak |
os.loadAverageMinute.one |
OS run-queue length | CPU |
≫ vCPU count = runnable backlog |
os.memory.freeable (freeable memory) |
RAM available | IO:DataFileRead |
Low + high reads = cache too small |
The Performance Insights dashboard: slicing DB load
Performance Insights is a fixed workflow: one chart, three questions. The chart is DB load coloured by wait event. Question one — is the band above the Max vCPU line? Question two — what is the tallest colour (top wait)? Question three — which SQL / host / user owns that colour? The dashboard’s right-hand panel is a tabbed table that answers question three by pivoting the same load across dimensions.
The dashboard anatomy
| Dashboard element | What it shows | How you use it |
|---|---|---|
| DB Load chart | Stacked AAS band, coloured by wait event, with the Max vCPU line | Height = saturation; colour = bottleneck |
| Counter Metrics chart | OS + DB gauges over the same window | Corroborate the wait (cache hit, IOPS) |
| Top SQL tab | Statements ranked by load, with per-wait breakdown | The query to change; expand to see full text |
| Top Waits tab | Wait events ranked by contribution | First-level triage |
| Top Hosts / Users / Databases / Applications | Load by connection dimension | Who drives it — find the noisy tenant/node |
| Time selector (5m–2y) | Zoom the window | Incident (now) vs trend (retention window) |
| Slice-by toggle | Recolour the band by any dimension | Same load, different lens |
The retention model and how you enable it
Performance Insights is off by default and you turn it on per instance. Retention is the knob that decides cost: 7 days is free; anything longer is long-term retention, billed per vCPU-month. Valid values are 7 (free) or a multiple of 31 up to 731 (about two years).
# Enable PI with the free 7-day retention on an existing instance (applies immediately)
aws rds modify-db-instance \
  --db-instance-identifier shop-prod-pg \
  --enable-performance-insights \
  --performance-insights-retention-period 7 \
  --apply-immediately
# Terraform: enable PI at (or after) creation. KMS key is required when PI is on.
resource "aws_db_instance" "shop_prod_pg" {
  identifier     = "shop-prod-pg"
  engine         = "postgres"
  engine_version = "15.7"
  instance_class = "db.r6g.xlarge"           # 4 vCPU, 32 GiB → Max vCPU line = 4
  # ...storage, subnet group, etc...

  performance_insights_enabled          = true
  performance_insights_retention_period = 7  # 7 = free; 31..731 = paid long-term
  performance_insights_kms_key_id       = aws_kms_key.rds.arn
}
The retention choices and what each is for:
| Retention (days) | Tier | Use it for | Cost note |
|---|---|---|---|
7 |
Free | Live incident triage, last-week trends | No charge |
31 |
Long-term | Month-over-month regression hunting | Per vCPU-month |
93 / 186 |
Long-term | Quarterly capacity planning | Per vCPU-month |
731 (~2 yr) |
Long-term | Year-over-year, audit, seasonal peaks | Per vCPU-month, largest |
A hard rule: turn PI on before you need it. It has near-zero overhead (a lightweight sampler, roughly 1-second polling of the wait state), and you cannot retroactively see the load during an incident that happened before you enabled it. Bake it into your Terraform module so every instance is born observable.
Wait events that matter
This is the reference you scan mid-incident. A wait event is a named reason a session is not on a CPU. The type (prefix before the colon on Postgres) is the class; the full name is the specific wait. CPU is special — it is not a wait at all but “actively running on a core,” and a healthy busy database is mostly CPU.
PostgreSQL wait events
The events you will actually see, what each means physically, and the fix direction:
| Wait event | Type | What the session is waiting for | Likely cause | Fix direction |
|---|---|---|---|---|
CPU |
(running) | Nothing — executing on a core | Real work, or CPU-heavy bad plan | Index/rewrite if plan is bad; else scale/accept |
IO:DataFileRead |
IO | A data page read from storage into cache | Working set > RAM; seq scan; cold cache | Add index; more RAM; warm cache |
IO:DataFileWrite |
IO | Dirty page flushed to data files | Checkpoint pressure; heavy writes | Tune checkpoints; faster storage |
IO:WALWrite |
IO | WAL record written to the log | Write-heavy workload | Batch commits; provisioned IOPS |
IO:WALSync / IO:XactSync |
IO | WAL/commit flushed durably (fsync) | Many tiny commits; slow disk fsync | Batch transactions; faster storage |
Lock:tuple |
Lock | A row-level lock on a specific tuple | Two txns updating the same row | Shorten txn; reduce hot-row contention |
Lock:transactionid |
Lock | Another transaction to commit/abort | Blocking (often long) transaction | End the blocker; add missing FK index |
Lock:relation |
Lock | A table-level lock | DDL vs DML; LOCK TABLE; vacuum full |
Avoid heavy DDL in peak; CONCURRENTLY |
LWLock:BufferMapping |
LWLock | Internal buffer hash-table latch | High buffer churn / eviction | More shared_buffers; reduce reads |
LWLock:WALWrite |
LWLock | Internal WAL insertion latch | Extreme write concurrency | Batch writes; reduce commit rate |
LWLock:lock_manager |
LWLock | The lock manager’s own latch | Very many locks (huge txns, partitions) | Fewer locks per txn; simplify |
LWLock:MultiXactOffsetSLRU |
LWLock | MultiXact SLRU (shared row locks) | SELECT ... FOR SHARE / FK contention |
Reduce shared-lock fan-out |
Client:ClientRead |
Client | The client to send the next command | Idle-in-transaction; slow app; chatty ORM | Fix app; close txns; idle_in_transaction_session_timeout |
Client:ClientWrite |
Client | The client to receive a large result | Huge result sets; slow network | Paginate; LIMIT; server-side cursors |
IPC:ProcArrayGroupUpdate |
IPC | Group commit / proc-array coordination | Very high commit concurrency | Usually benign at scale |
Timeout:* |
Timeout | A deliberate wait (e.g. vacuum delay) | Config-driven pauses | Usually benign |
BufferPin |
BufferPin | A pinned buffer to be released | Read/write on the same page | Usually transient |
Three reading notes save the most time:
| Distinction | The trap | How to tell them apart |
|---|---|---|
CPU vs an IO wait |
“High CPU” in CloudWatch can hide IO waits | If the band is tall but CPU colour is thin and IO is thick, it’s IO, not CPU — CloudWatch CPU% won’t show the queueing |
Lock:transactionid vs Lock:tuple |
Both are “locking” but differ in fix | transactionid = waiting on a whole txn to end (find the blocker); tuple = row-lock contention (reduce hot-row updates) |
Client:ClientRead |
Looks like a DB problem, is an app problem | The DB is idle, waiting on your app/network; fix the client, not the database |
MySQL wait events
MySQL surfaces waits through Performance Schema; the names are longer but map to the same physics:
| Wait event | Meaning | Postgres analogue | Fix direction |
|---|---|---|---|
CPU |
Running on a core | CPU |
Index/rewrite if plan is bad |
wait/io/table/sql/handler |
Row access through the storage-engine handler (table IO) | IO:DataFileRead (roughly) |
Add index; reduce rows scanned |
wait/io/file/innodb/innodb_data_file |
Physical InnoDB data-file IO | IO:DataFileRead |
More buffer pool; faster storage |
wait/io/file/innodb/innodb_log_file |
Redo (WAL) file IO | IO:WALWrite |
Batch commits; provisioned IOPS |
wait/io/redo_log/flush |
Redo log flush to durable storage | IO:XactSync |
Batch txns; innodb_flush_log_at_trx_commit trade-off |
wait/synch/mutex/* |
InnoDB mutex contention | LWLock:* |
Reduce concurrency hotspots |
wait/synch/sxlock/innodb/* |
InnoDB rw-lock (shared/exclusive) | LWLock:* |
Reduce contended pages/indexes |
wait/lock/table/sql/handler |
Table-level lock wait | Lock:relation |
Avoid table locks; use InnoDB row locks |
synch/cond/* |
Condition-variable wait (coordination) | IPC:* |
Often benign |
idle |
Connection idle between statements | Client:ClientRead |
Fix chatty app; pool connections |
The wait-type taxonomy (first-level triage)
When you only have five seconds, group to the type and act on the class:
| Wait type | Means broadly | Instinct fix | Do NOT reflexively |
|---|---|---|---|
CPU |
Running; work or bad plan | Find top SQL, check the plan | Scale up before checking the plan |
IO |
Waiting on storage | Index; more RAM; faster EBS | Assume it’s “just slow disk” |
Lock |
Blocked by another session | Find and end the blocker | Kill random sessions blindly |
LWLock |
Internal latch contention | Reduce concurrency/churn | Tune parameters at random |
Client |
Waiting on the app/network | Fix the client / close txns | Blame the database |
IPC / Timeout / BufferPin |
Coordination / deliberate | Usually benign; correlate | Chase if it’s a thin slice |
Three lenses: Performance Insights vs Enhanced Monitoring vs CloudWatch
RDS gives you three telemetry systems and they answer different questions. Using the wrong one is the second-biggest time sink after “the database is slow.” The rule: Performance Insights for what the database is doing internally, Enhanced Monitoring for what the host OS is doing, CloudWatch for the service and storage.
| Dimension | Performance Insights | Enhanced Monitoring | CloudWatch (RDS) |
|---|---|---|---|
| Answers | “What are sessions waiting on?” | “What is the OS host doing?” | “What is the service/storage doing?” |
| Unit | Average Active Sessions by wait | OS metrics (CPU, mem, disk, procs) | Service metrics (CPU%, IOPS, conns) |
| Granularity | ~1s wait sampling; 1-min display | 1, 5, 10, 15, 30 or 60 s | 60 s (1 min); 1 s for some |
| Sees inside the DB? | Yes — waits, top SQL, per-user | No — host only | No — aggregate only |
| Sees per-process CPU? | No | Yes (per-process list) | No |
| Where it lives | PI console / aws pi API |
CloudWatch Logs RDSOSMetrics |
CloudWatch metrics/alarms |
| Retention | 7 days free / up to 2 yr | CloudWatch Logs retention | 15 months (metrics) |
| Cost | Free at 7 days | Small (Logs ingestion) | Free tier + per-metric alarms |
| Best for | Root-causing a slowdown | CPU steal, swap, disk queue truth | Alarms, capacity, storage-full |
When each lens is the right one
| Question | Reach for | Because |
|---|---|---|
| “Why is the DB slow right now?” | Performance Insights | Only PI shows the wait breakdown |
| “Which query is causing it?” | PI (top SQL) → EXPLAIN |
PI localises, EXPLAIN explains |
| “Is the host actually CPU-bound or is it IO wait?” | Enhanced Monitoring | 1s per-process CPU + run queue |
| “Is the instance swapping / out of memory?” | Enhanced Monitoring | Host free memory & swap, not in CloudWatch |
| “Are we near an IOPS/throughput ceiling?” | CloudWatch | ReadIOPS, WriteThroughput, EBSIOBalance% |
| “Alert me before storage fills” | CloudWatch alarm | FreeStorageSpace alarm |
| “How many connections are open?” | CloudWatch | DatabaseConnections |
| “Show me last quarter’s regression” | PI long-term retention | Up to 2 years of DB load |
Enabling Enhanced Monitoring
Enhanced Monitoring needs an IAM role that lets RDS publish OS metrics to CloudWatch Logs. Set --monitoring-interval to the granularity in seconds (0 disables it):
# Create the monitoring role once (AWS-managed policy grants the log publishing)
aws iam create-role --role-name rds-monitoring-role \
  --assume-role-policy-document '{"Version":"2012-10-17","Statement":[{"Effect":"Allow","Principal":{"Service":"monitoring.rds.amazonaws.com"},"Action":"sts:AssumeRole"}]}'
aws iam attach-role-policy --role-name rds-monitoring-role \
  --policy-arn arn:aws:iam::aws:policy/service-role/AmazonRDSEnhancedMonitoringRole

# Turn on 1-second OS metrics
aws rds modify-db-instance --db-instance-identifier shop-prod-pg \
  --monitoring-interval 1 \
  --monitoring-role-arn arn:aws:iam::111122223333:role/rds-monitoring-role \
  --apply-immediately
resource "aws_iam_role" "rds_monitoring" {
  name = "rds-monitoring-role"
  assume_role_policy = jsonencode({
    Version = "2012-10-17"
    Statement = [{
      Effect = "Allow", Action = "sts:AssumeRole"
      Principal = { Service = "monitoring.rds.amazonaws.com" }
    }]
  })
}
resource "aws_iam_role_policy_attachment" "rds_monitoring" {
  role       = aws_iam_role.rds_monitoring.name
  policy_arn = "arn:aws:iam::aws:policy/service-role/AmazonRDSEnhancedMonitoringRole"
}
# On the instance:
#   monitoring_interval = 1
#   monitoring_role_arn = aws_iam_role.rds_monitoring.arn
The OS metrics Enhanced Monitoring gives you that nothing else does:
| Enhanced Monitoring metric | What it reveals | Why CloudWatch can’t |
|---|---|---|
| Per-process CPU / memory list | The exact backend process eating CPU | CloudWatch is host-aggregate only |
cpuUtilization.steal |
Hypervisor CPU steal (noisy neighbour) | Not exposed in CloudWatch CPU% |
memory.free / swap |
Real free RAM and swap usage | CloudWatch FreeableMemory differs subtly |
loadAverageMinute |
OS run-queue length | Reveals runnable backlog vs CPU% |
diskIO.await / queue depth |
Storage latency & queue at the OS | Complements EBS latency metrics |
tasks.blocked (D-state) |
Processes blocked on IO | Direct evidence of IO saturation |
The trap Enhanced Monitoring resolves: CloudWatch CPUUtilization can read 100% while the real problem is IO wait. Enhanced Monitoring splits CPU into user/system/wait/steal — a high wait fraction proves the cores are stalled on storage, not computing, which is the same story IO:DataFileRead tells in Performance Insights. Two lenses, one conclusion, high confidence.
Finding the query: slow query log, pg_stat_statements & EXPLAIN
Performance Insights names the load; these tools name the fix. The workflow is always the same: PI top SQL → find the statement → EXPLAIN (ANALYZE, BUFFERS) → see the bad access path → add the index or rewrite → confirm the wait shrank.
Turn on the slow query log
You change engine settings on RDS through a DB parameter group, never by editing a config file. For PostgreSQL, log_min_duration_statement logs any statement slower than N milliseconds:
# Create a custom parameter group and log statements slower than 1000 ms
aws rds create-db-parameter-group \
  --db-parameter-group-name pg15-tuned \
  --db-parameter-group-family postgres15 \
  --description "Tuned PG15 params"

aws rds modify-db-parameter-group --db-parameter-group-name pg15-tuned \
  --parameters "ParameterName=log_min_duration_statement,ParameterValue=1000,ApplyMethod=immediate" \
               "ParameterName=shared_preload_libraries,ParameterValue=pg_stat_statements,ApplyMethod=pending-reboot"
resource "aws_db_parameter_group" "pg15_tuned" {
  name   = "pg15-tuned"
  family = "postgres15"

  parameter { name = "log_min_duration_statement" value = "1000" apply_method = "immediate" }        # ms
  parameter { name = "shared_preload_libraries"    value = "pg_stat_statements" apply_method = "pending-reboot" }
  parameter { name = "track_activity_query_size"   value = "4096" apply_method = "pending-reboot" }
  parameter { name = "log_lock_waits"              value = "1" apply_method = "immediate" }           # log blocked-lock waits
}
The logging knobs per engine, with the values that matter:
| Setting | Engine | What it does | Sane value | Gotcha |
|---|---|---|---|---|
log_min_duration_statement |
PostgreSQL | Log statements slower than N ms | 1000 (prod) / 0 (capture all, brief) |
0 floods the log — use only to sample |
log_lock_waits |
PostgreSQL | Log when a session waits past deadlock_timeout |
1 |
Surfaces blocking chains in the log |
auto_explain.log_min_duration |
PostgreSQL | Log the plan of slow statements | 2000 ms |
Needs auto_explain preloaded; small overhead |
slow_query_log |
MySQL | Enable the slow query log | 1 |
Pair with long_query_time |
long_query_time |
MySQL | Slow threshold in seconds | 1 |
Seconds, not ms — easy to misread |
log_output |
MySQL | FILE or TABLE |
FILE |
FILE → CloudWatch Logs export |
performance_schema |
MySQL | Enable P_S (feeds PI) | 1 |
Reboot to change; needed for PI top SQL |
log_queries_not_using_indexes |
MySQL | Log full-scan queries | 1 (temporarily) |
Noisy — sample, don’t leave on |
Export the logs to CloudWatch so you can query them without shell access to the box:
aws rds modify-db-instance --db-instance-identifier shop-prod-pg \
  --cloudwatch-logs-export-configuration '{"EnableLogTypes":["postgresql"]}' \
  --apply-immediately
# MySQL: EnableLogTypes = ["slowquery","error","general"]
pg_stat_statements — the top-SQL source
Performance Insights’ “Top SQL” for Postgres is powered by pg_stat_statements, which aggregates normalised query stats (calls, total/mean time, rows, buffer hits/reads). Once it is in shared_preload_libraries and created, you can query it directly — the same data PI shows, but SQL-queryable:
CREATE EXTENSION IF NOT EXISTS pg_stat_statements;

-- The queries burning the most total time (the real cost, calls × mean)
SELECT substring(query,1,80) AS query, calls,
       round(total_exec_time)   AS total_ms,
       round(mean_exec_time,2)  AS mean_ms,
       shared_blks_read         AS disk_reads,   -- high = IO:DataFileRead source
       shared_blks_hit          AS cache_hits
FROM pg_stat_statements
ORDER BY total_exec_time DESC
LIMIT 10;
shared_blks_read climbing on one statement is your IO:DataFileRead — that is the query pulling pages from storage. The columns and what they tell you:
pg_stat_statements column |
Meaning | Points at |
|---|---|---|
calls |
Times the statement ran | Chatty / N+1 patterns |
total_exec_time |
Cumulative execution time | The real top consumer (rank by this) |
mean_exec_time |
Average per call | Individually slow statements |
rows |
Rows returned across calls | Over-fetching |
shared_blks_hit |
Pages served from cache | Cache effectiveness |
shared_blks_read |
Pages read from storage | IO:DataFileRead culprits |
shared_blks_dirtied / written |
Pages modified / flushed | Write / checkpoint load |
wal_bytes (PG13+) |
WAL generated | Write amplification |
Reading EXPLAIN (ANALYZE, BUFFERS)
EXPLAIN shows the planned path; ANALYZE runs it and shows actuals; BUFFERS adds how many pages were hit (cache) vs read (storage). The gap between estimated and actual rows is where bad plans hide.
-- Actually executes the query; safe on SELECT, wrap writes in a rolled-back txn
EXPLAIN (ANALYZE, BUFFERS)
SELECT * FROM orders WHERE customer_id = 90210 AND status = 'OPEN';
Seq Scan on orders  (cost=0.00..184500 rows=42 width=140)
                    (actual time=812..3140 rows=39 loops=1)
  Filter: ((customer_id = 90210) AND (status = 'OPEN'))
  Rows Removed by Filter: 4192311
  Buffers: shared read=118402            <-- 118k pages from STORAGE = IO:DataFileRead
Planning Time: 0.20 ms
Execution Time: 3141 ms
Seq Scan + Rows Removed by Filter: 4192311 + Buffers: shared read=118402 is the signature of a missing index: the engine read the whole table from disk to return 39 rows. What each plan element tells you:
| Plan element | What it means | Red flag when… |
|---|---|---|
Seq Scan |
Full table read | On a big table returning few rows → missing index |
Index Scan / Index Only Scan |
Read via an index | Good; Index Only best (no heap fetch) |
Bitmap Heap Scan |
Index → collect pages → read | Fine for medium selectivity |
Rows Removed by Filter |
Rows read then discarded | Large number = scanning then filtering |
Buffers: shared read= |
Pages fetched from storage | Large = the IO:DataFileRead source |
Buffers: shared hit= |
Pages served from cache | Large + fast = well-cached |
estimated vs actual ... rows |
Planner accuracy | Off by 10–1000× = stale stats → ANALYZE |
Nested Loop with big loops= |
Row-by-row join | Huge loops = wrong join / missing index |
Sort / Hash with Disk: |
Spilled to disk | work_mem too small (see tuning) |
Rows Removed by Join Filter |
Join over-produces then filters | Missing join predicate/index |
The fix for the plan above is one line, and you can confirm it moved the wait immediately:
CREATE INDEX CONCURRENTLY idx_orders_cust_status ON orders (customer_id, status);
-- CONCURRENTLY avoids a long ACCESS EXCLUSIVE lock (no Lock:relation storm)
ANALYZE orders;   -- refresh stats so the planner trusts the new index
The index-choice cheat sheet:
| You see… | Add this index | Notes |
|---|---|---|
Seq scan filtering on col = ? |
B-tree on (col) |
The default; covers =, <, >, BETWEEN, ORDER BY |
Filter on a = ? AND b = ? |
Composite (a, b) |
Column order = most selective / equality first |
WHERE status='OPEN' (1% of rows) |
Partial (...) WHERE status='OPEN' |
Smaller, hotter index |
WHERE lower(email)=? |
Expression index on lower(email) |
Match the exact expression used |
JSONB / array / full-text @>, @@ |
GIN index | For containment / search operators |
| Geospatial / range overlap | GiST index | Ranges, geometry, nearest-neighbour |
| Foreign key with no index | B-tree on the FK column | Prevents Lock waits on parent updates/deletes |
That last row is doubly important: an unindexed foreign key is a classic hidden cause of Lock:transactionid waits, because a delete/update on the parent must scan the child table under a lock.
Parameter tuning and the autovacuum / wraparound trap
Once the query is indexed, memory and maintenance parameters decide whether the engine uses RAM well and keeps itself healthy. On RDS you change these in a parameter group; some apply immediately, others (static parameters) need a reboot.
The four parameters that move the needle
RDS sets sensible defaults as formulas of DBInstanceClassMemory (e.g. shared_buffers defaults to about 25% of RAM), so you rarely start from zero — but the defaults are generic. The big four:
| Parameter | What it controls | RDS default (approx) | Tune toward | Trade-off / gotcha |
|---|---|---|---|---|
shared_buffers |
Postgres’s own page cache | ~25% of RAM ({DBInstanceClassMemory/32768} in 8 KB pages) |
25–40% of RAM for read-heavy | Too high starves OS cache + work_mem; reboot to change |
work_mem |
Memory per sort/hash operation | 4 MB | 16–64 MB for report/analytics queries | It’s per operation per connection — work_mem × ops × conns can OOM; raise per-session, not globally |
effective_cache_size |
Planner’s estimate of total cache (OS + shared_buffers) | ~50–75% of RAM | ~75% of RAM | Not an allocation — just tells the planner to prefer index scans; safe to set high |
max_connections |
Max concurrent connections | LEAST({DBInstanceClassMemory/9531392}, 5000) |
Keep modest; add RDS Proxy | Each connection reserves memory; high values + work_mem = OOM; storms need a pooler, not a bigger cap |
# Raise work_mem for a heavy reporting connection ONLY — never globally on OLTP
# (session-scoped: run at the start of the reporting session)
psql -c "SET work_mem = '64MB';"

# Or bump the group default modestly (applies per-operation to every connection)
aws rds modify-db-parameter-group --db-parameter-group-name pg15-tuned \
  --parameters "ParameterName=work_mem,ParameterValue=16384,ApplyMethod=immediate"  # 16 MB in KB
parameter { name = "shared_buffers"       value = "{DBInstanceClassMemory/21845}" apply_method = "pending-reboot" } # ~37% RAM
parameter { name = "work_mem"             value = "16384"  apply_method = "immediate" }   # 16 MB (KB units)
parameter { name = "effective_cache_size" value = "{DBInstanceClassMemory*3/4/8192}" apply_method = "immediate" }   # ~75% RAM
parameter { name = "max_connections"      value = "500"    apply_method = "pending-reboot" }
The classic work_mem disaster: you set it to 256MB globally to speed one report, and under 200 connections each running a 2-way hash join you have authorised 256MB × 2 × 200 = 100 GB of potential sort memory on a 32 GB box. The engine OOM-kills backends, PI shows a mess of waits, and it looks like a load spike. work_mem is per operation per connection — raise it per session for the query that needs it, keep the global default modest.
Autovacuum, bloat, and the wraparound doomsday
PostgreSQL’s MVCC leaves dead tuples behind every UPDATE/DELETE; autovacuum reclaims them and — critically — freezes old rows to prevent transaction-ID (XID) wraparound. Postgres XIDs are 32-bit and wrap at ~2 billion; if freezing falls too far behind, the database will stop accepting writes to protect itself. This is the single most dangerous “slow database” that is actually a ticking time bomb.
| Autovacuum parameter | Controls | RDS default | Tune when |
|---|---|---|---|
autovacuum |
Master on/off | on |
Never turn off |
autovacuum_vacuum_scale_factor |
% dead tuples to trigger vacuum | 0.1–0.2 |
Lower (e.g. 0.02) for big, hot tables |
autovacuum_vacuum_threshold |
Min dead tuples to trigger | 50 |
Fine for most |
autovacuum_max_workers |
Concurrent vacuum workers | 3 |
Raise for many large tables |
autovacuum_vacuum_cost_limit |
Throttle budget per round | 200/-1 |
Raise so vacuum keeps up on fast storage |
autovacuum_freeze_max_age |
Force a freeze vacuum by this XID age | 200000000 |
Lower if wraparound risk looms |
maintenance_work_mem |
RAM for vacuum/index builds | ~64 MB | Raise (e.g. 1 GB) for faster vacuum |
Watch bloat and wraparound risk directly — these two queries belong in your monitoring:
-- Dead tuples and last (auto)vacuum per table — rising n_dead_tup = bloat
SELECT relname, n_live_tup, n_dead_tup, last_autovacuum
FROM pg_stat_user_tables
ORDER BY n_dead_tup DESC LIMIT 10;

-- XID age per table — the number that must never approach ~2,000,000,000
SELECT relname, age(relfrozenxid) AS xid_age
FROM pg_class c JOIN pg_namespace n ON n.oid = c.relnamespace
WHERE c.relkind = 'r'
ORDER BY xid_age DESC LIMIT 10;
RDS raises the MaximumUsedTransactionIDs CloudWatch metric for exactly this — alarm on it well before 1 billion. What bloat and wraparound look like, and the fix:
| Symptom | Cause | Confirm | Fix |
|---|---|---|---|
Tables grow, scans slow, IO:DataFileRead creeps up |
Bloat — dead tuples never reclaimed | n_dead_tup high; table size ≫ live rows |
Tune autovacuum more aggressive; VACUUM; rebuild index |
MaximumUsedTransactionIDs climbing toward 2B |
Autovacuum can’t freeze fast enough | The xid_age query; the CloudWatch metric |
Manual VACUUM (FREEZE); more workers; more maintenance_work_mem |
| “database is not accepting commands to avoid wraparound” | XID wraparound protection tripped | Postgres error in log | Emergency VACUUM FREEZE in single-user-ish mode; page AWS if stuck |
| Autovacuum runs constantly, adds IO | Scale factor too low on a huge table | PI shows autovacuum workers busy | Raise cost limit + maintenance_work_mem so each pass finishes |
Architecture at a glance
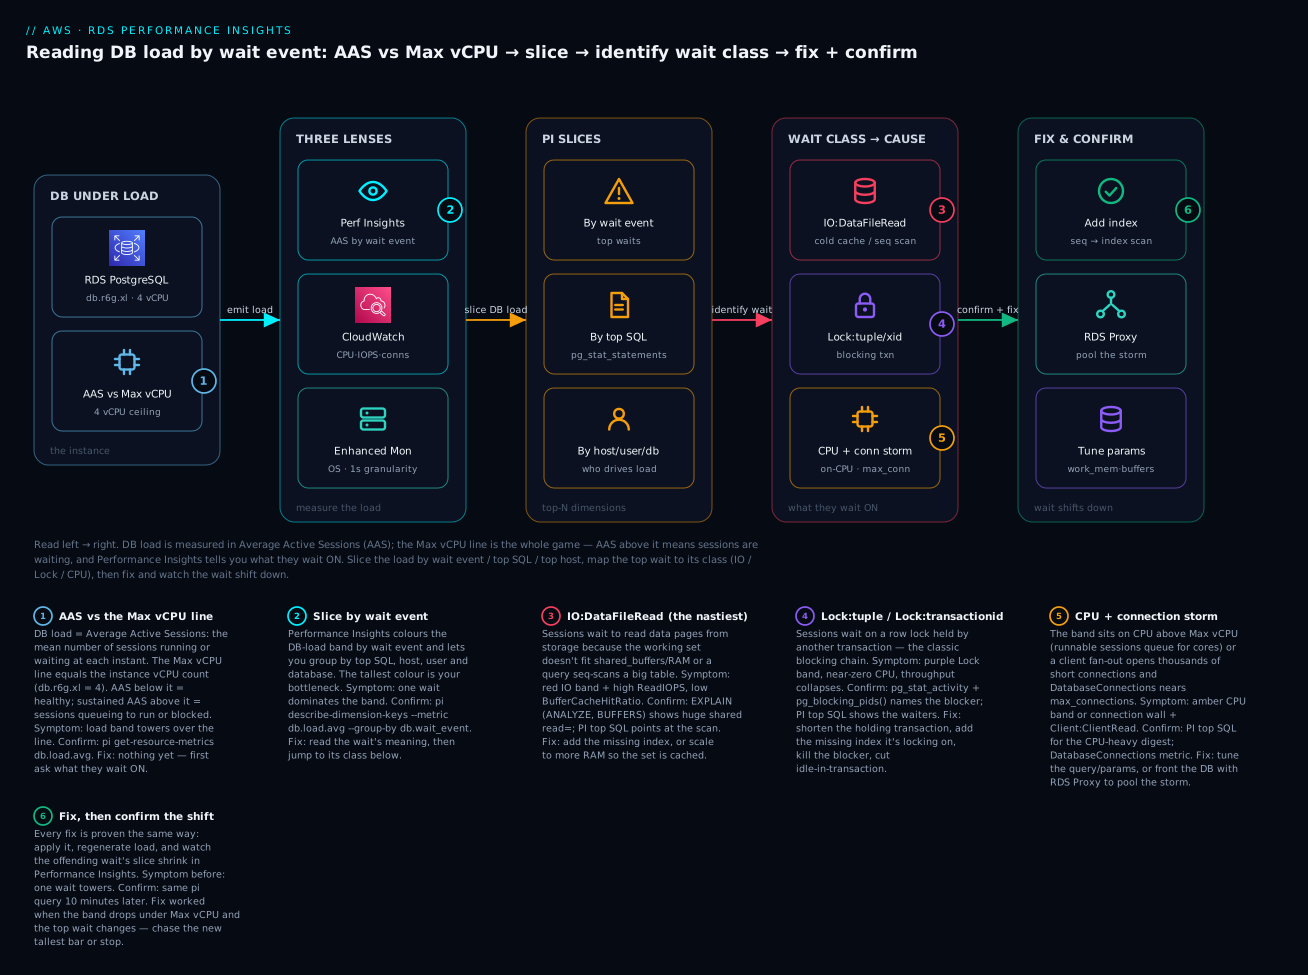
The diagram traces the whole method left to right: the RDS instance under load emits its session activity to three lenses — Performance Insights (DB load by wait event), CloudWatch (service metrics), and Enhanced Monitoring (OS metrics at 1-second) — and you use Performance Insights to slice that load by wait event, top SQL, and top host/user/database. That slice points at a wait class (IO:DataFileRead, Lock:tuple/transactionid, or CPU + connection storm), and each class routes to a fix — an index, a parameter, or RDS Proxy — that you confirm by watching the wait’s slice shrink. The numbered badges mark the six decision points: reading AAS against the Max vCPU line (1), slicing by wait event (2), and the three nastiest wait classes (3–5) plus the fix-and-confirm loop (6).
Real-world scenario
Fablead Commerce runs a PostgreSQL 15 catalog and order database on a db.r6g.xlarge (4 vCPU, 32 GiB) behind an ECS service. On a Thursday flash sale, checkout latency climbs from 40 ms to 3 seconds and the on-call engineer’s first instinct — the wrong one — is to modify the instance to a db.r6g.2xlarge. The lead architect stops the resize and opens Performance Insights instead.
The DB-load band is at AAS ≈ 9 against a Max vCPU line of 4 — badly saturated — but the CPU colour is a thin sliver. The dominant colour, roughly 70% of the band, is IO:DataFileRead. That single fact kills the “scale the CPU” plan: the cores are idle, waiting on storage. Slicing Top SQL shows one statement owns almost all of that wait — SELECT ... FROM orders WHERE customer_id = $1 AND status = $2. Running EXPLAIN (ANALYZE, BUFFERS) on it shows a Seq Scan, Rows Removed by Filter: 4192311, and Buffers: shared read=118402 — the query reads the entire 40-million-row orders table from EBS to return a handful of rows, and at flash-sale concurrency dozens of these run at once, blowing past the cache and saturating ReadIOPS (confirmed in CloudWatch near the gp3 ceiling).
The fix is one index, built without locking the table:
CREATE INDEX CONCURRENTLY idx_orders_cust_status ON orders (customer_id, status);
ANALYZE orders;
Ten minutes later the pi get-resource-metrics call tells the whole story: the IO:DataFileRead slice has collapsed, DB load has dropped to AAS ≈ 1.5 — comfortably under the Max vCPU line — and checkout latency is back to 45 ms. But a new tallest colour has appeared: a small band of Lock:transactionid. Chasing it with pg_blocking_pids() finds a reporting job running a long transaction that updates inventory counts row-by-row and holds locks the checkout path contends on. They move that job to a read replica for the reads and batch the writes, and the lock band disappears too.
The postmortem number that matters: the incident was resolved with a CREATE INDEX on the same instance size, at zero extra hourly cost. Scaling to the 2xlarge would have doubled the bill (~₹95,000/month → ~₹190,000/month), masked the missing index behind a bigger cache, and let the table keep growing until the same wall returned — bigger, and now at 2× the price. Fablead added MaximumUsedTransactionIDs and a “DB load > Max vCPU for 5 min” alarm so the next one pages before customers feel it.
Advantages and disadvantages
Performance Insights is the right default, but know its edges:
| Advantages | Disadvantages / limits |
|---|---|
| One honest load metric (AAS) that captures queueing CPU% hides | Not a full APM — it profiles the DB, not the app request |
| Wait-event breakdown localises the bottleneck in seconds | You still need EXPLAIN/pg_stat_statements for the why |
| 7-day retention is free; near-zero overhead | Long-term retention (>7 days) is billed per vCPU-month |
| Works across engines (PG, MySQL, MariaDB, Oracle, SQL Server, Aurora) | Wait-event names differ per engine — no single vocabulary |
API-first (aws pi) → scriptable, alertable |
Console-driven teams under-use the API |
| Top SQL / host / user pivots find the noisy tenant fast | Requires pg_stat_statements / Performance Schema enabled |
| No agent, no reboot to enable (mostly) | Some feeder params (performance_schema) need a reboot |
| Complements, doesn’t replace, CloudWatch alarms | Three tools to learn; wrong-lens mistakes are common |
Performance Insights wins whenever the question is “why is the database slow right now.” It is weak as a long-horizon alarming system (that’s CloudWatch) and it cannot see your application’s own time (that’s X-Ray / an APM). Use all three deliberately: PI to diagnose, CloudWatch to alarm, Enhanced Monitoring to settle “CPU or IO?” arguments.
Hands-on lab
You will stand up a small PostgreSQL instance with Performance Insights and Enhanced Monitoring on, generate two distinct bottlenecks (a table-scan IO wait and a lock wait), read the DB load by wait event through the API, find the top SQL, fix the IO wait with an index, and confirm the wait shifts. Everything is free-tier-friendly except the running instance-hours. ⚠️ A db.t4g.micro Single-AZ instance and its storage cost money while running — do the teardown at the end.
Step 1 — Create the instance with PI + Enhanced Monitoring on
# Assumes a default VPC + a security group SG allowing your IP on 5432, and the
# rds-monitoring-role created earlier. Region: ap-south-1 (Mumbai).
aws rds create-db-instance \
  --db-instance-identifier pi-lab \
  --engine postgres --engine-version 15.7 \
  --db-instance-class db.t4g.micro \
  --allocated-storage 20 --storage-type gp3 \
  --master-username labadmin --master-user-password 'ChangeMe_9182#' \
  --vpc-security-group-ids sg-0123456789abcdef0 \
  --enable-performance-insights --performance-insights-retention-period 7 \
  --monitoring-interval 1 \
  --monitoring-role-arn arn:aws:iam::111122223333:role/rds-monitoring-role \
  --backup-retention-period 0 --no-multi-az --publicly-accessible
Wait for it and grab the endpoint plus the PI resource id:
aws rds wait db-instance-available --db-instance-identifier pi-lab
EP=$(aws rds describe-db-instances --db-instance-identifier pi-lab \
     --query "DBInstances[0].Endpoint.Address" --output text)
RESID=$(aws rds describe-db-instances --db-instance-identifier pi-lab \
     --query "DBInstances[0].DbiResourceId" --output text)
echo "endpoint=$EP  resid=$RESID"
The equivalent Terraform for the lab instance:
resource "aws_db_instance" "pi_lab" {
  identifier            = "pi-lab"
  engine                = "postgres"
  engine_version        = "15.7"
  instance_class        = "db.t4g.micro"
  allocated_storage     = 20
  storage_type          = "gp3"
  username              = "labadmin"
  password              = var.db_password           # from a tfvars / Secrets Manager, never hard-coded
  vpc_security_group_ids = [aws_security_group.db.id]
  skip_final_snapshot   = true
  backup_retention_period = 0
  publicly_accessible   = true

  performance_insights_enabled          = true
  performance_insights_retention_period = 7
  monitoring_interval                   = 1
  monitoring_role_arn                   = aws_iam_role.rds_monitoring.arn
}
Step 2 — Seed a big table and generate an IO (table-scan) wait
export PGPASSWORD='ChangeMe_9182#'
psql "host=$EP user=labadmin dbname=postgres" <<'SQL'
CREATE EXTENSION IF NOT EXISTS pg_stat_statements;
CREATE TABLE orders AS
  SELECT g AS id,
         (random()*100000)::int AS customer_id,
         (ARRAY['OPEN','SHIPPED','CANCELLED'])[1+floor(random()*3)] AS status,
         repeat('x',200) AS payload
  FROM generate_series(1,5000000) g;      -- 5M rows, no index on customer_id
SQL
Now hammer the unindexed predicate from a few parallel sessions to build DB load:
# Run this loop in 4 separate terminals (or background them) to push AAS up
for i in $(seq 1 200); do
  psql "host=$EP user=labadmin dbname=postgres" \
    -c "SELECT count(*) FROM orders WHERE customer_id = $((RANDOM)) AND status='OPEN';" >/dev/null
done
Step 3 — Read DB load BY WAIT EVENT through the API
While the load runs, ask Performance Insights what the sessions are waiting on:
aws pi describe-dimension-keys \
  --service-type RDS --identifier "$RESID" \
  --start-time "$(date -u -v-5M +%Y-%m-%dT%H:%M:%SZ)" \
  --end-time   "$(date -u +%Y-%m-%dT%H:%M:%SZ)" \
  --metric db.load.avg \
  --group-by '{"Group":"db.wait_event","Limit":5}'
Expected output — IO:DataFileRead (and/or CPU) dominates the Keys list with the largest Total:
{
  "AlignedStartTime": "...", "AlignedEndTime": "...",
  "Keys": [
    { "Dimensions": { "db.wait_event.name": "IO:DataFileRead" }, "Total": 2.71 },
    { "Dimensions": { "db.wait_event.name": "CPU" },             "Total": 0.63 },
    { "Dimensions": { "db.wait_event.name": "IO:DataFileWrite" },"Total": 0.05 }
  ]
}
Now pivot to top SQL to find the statement behind that wait:
aws pi describe-dimension-keys \
  --service-type RDS --identifier "$RESID" \
  --start-time "$(date -u -v-5M +%Y-%m-%dT%H:%M:%SZ)" \
  --end-time   "$(date -u +%Y-%m-%dT%H:%M:%SZ)" \
  --metric db.load.avg \
  --group-by '{"Group":"db.sql_tokenized","Limit":5}'
You will see the tokenised SELECT count(*) FROM orders WHERE customer_id = ? AND status = ? at the top. Confirm the plan:
psql "host=$EP user=labadmin dbname=postgres" \
  -c "EXPLAIN (ANALYZE, BUFFERS) SELECT count(*) FROM orders WHERE customer_id=42 AND status='OPEN';"
# Expect: Seq Scan ... Rows Removed by Filter: ~4.9M ... Buffers: shared read=<large>
Step 4 — Fix, then CONFIRM the wait shifts
psql "host=$EP user=labadmin dbname=postgres" \
  -c "CREATE INDEX CONCURRENTLY idx_orders_cust_status ON orders (customer_id, status);" \
  -c "ANALYZE orders;"
Re-run the load loop from Step 2, wait a few minutes, then re-run the same describe-dimension-keys call from Step 3. Expected result: IO:DataFileRead has collapsed to a tiny Total (or vanished from the top 5), overall DB load has dropped, and the plan now shows an Index Scan with Buffers: shared read near zero. That shift — same query, wait gone — is the proof the fix worked. This is the entire method in one loop.
Step 5 — (Optional) Generate a Lock wait
# Terminal A: open a transaction and hold a row lock (do NOT commit)
psql "host=$EP user=labadmin dbname=postgres" \
  -c "BEGIN;" -c "UPDATE orders SET status='OPEN' WHERE id=1;" -c "SELECT pg_sleep(120);"
# Terminal B: contend for the same row — this session now waits on Lock:transactionid
psql "host=$EP user=labadmin dbname=postgres" \
  -c "UPDATE orders SET status='SHIPPED' WHERE id=1;"
# In a third session, name the blocker:
psql "host=$EP user=labadmin dbname=postgres" \
  -c "SELECT pid, pg_blocking_pids(pid), wait_event_type, wait_event, query
      FROM pg_stat_activity WHERE wait_event_type='Lock';"
Performance Insights will show a Lock:transactionid slice appear; pg_blocking_pids() names the holding PID. That is the lock-diagnosis workflow end to end.
Step 6 — Teardown ⚠️
aws rds delete-db-instance --db-instance-identifier pi-lab \
  --skip-final-snapshot --delete-automated-backups
aws rds wait db-instance-deleted --db-instance-identifier pi-lab
# terraform destroy  if you used the HCL path
Common mistakes & troubleshooting
This is the runbook. First the diagnostic playbook — a symptom (a wait event or a metric) mapped to its likely cause, the exact command to confirm, and the fix. Scan for your row, then read the prose on the three nastiest below.
| # | Symptom (wait / metric) | Likely root cause | Confirm (exact command / path) | Fix |
|---|---|---|---|---|
| 1 | DB load band far above Max vCPU, mostly IO:DataFileRead |
Missing index / big seq scan; working set > RAM | PI top SQL → EXPLAIN (ANALYZE, BUFFERS) shows Seq Scan + big shared read= |
Add the index; ANALYZE; if genuinely cold, more RAM |
| 2 | Tall band, mostly CPU, one SQL dominates |
CPU-heavy plan (seq scan, bad join, function per row) | PI db.sql; EXPLAIN shows high-cost nodes |
Index / rewrite; precompute; only then scale up |
| 3 | Lock:transactionid slice, throughput collapses, CPU low |
A blocking (long / idle-in-txn) transaction | SELECT pg_blocking_pids(pid) ... from pg_stat_activity |
End the blocker; add missing FK index; shorten txns |
| 4 | Lock:tuple under write load |
Hot-row contention (many txns update same row) | PI top SQL; pg_stat_activity wait rows |
Reduce hot-row updates; queue/aggregate writes |
| 5 | Lock:relation spikes during a deploy |
DDL taking ACCESS EXCLUSIVE (ALTER, CREATE INDEX) |
Correlate PI spike with deploy; pg_locks |
Use CREATE INDEX CONCURRENTLY; migrate off-peak |
| 6 | IO:XactSync / IO:WALWrite high, tiny commits |
Row-at-a-time commits fsync-ing each time | PI wait + db.Transactions.xact_commit very high |
Batch into fewer, larger transactions |
| 7 | Client:ClientRead dominates, DB looks idle |
App holding txn open / slow client / chatty ORM | PI top host/user; state='idle in transaction' in pg_stat_activity |
Fix app; idle_in_transaction_session_timeout; pool |
| 8 | DatabaseConnections near max_connections, errors |
Connection storm from serverless/autoscaling fan-out | CloudWatch DatabaseConnections; app logs |
RDS Proxy to pool; cap client pools; fix leaks |
| 9 | CPUUtilization 100% but PI CPU slice is thin |
It’s IO wait, not compute (CloudWatch can’t tell) | Enhanced Monitoring CPU wait% high; PI shows IO |
Treat as IO (row 1), not as CPU |
| 10 | ReadLatency climbing, ReadIOPS flat at a ceiling |
EBS IOPS/throughput ceiling hit (gp3 baseline) | CloudWatch ReadIOPS, EBSIOBalance%, ReadThroughput |
Raise gp3 IOPS/throughput or io2; reduce reads via index |
| 11 | Sort/Hash shows Disk: in EXPLAIN; slow reports |
work_mem too small → spill to disk |
EXPLAIN (ANALYZE) shows external merge Disk: NNNkB |
Raise work_mem per session for the report |
| 12 | FreeableMemory low + high IO:DataFileRead |
Cache too small for the working set | Enhanced Monitoring memory.free; PI IO wait |
Scale to more RAM, or shrink working set via indexes |
| 13 | MaximumUsedTransactionIDs climbing toward 2B |
Autovacuum can’t freeze fast enough | The age(relfrozenxid) query; the CloudWatch metric |
Manual VACUUM (FREEZE); more workers; more maintenance_work_mem |
| 14 | Tables bloated, scans slowing over weeks | Dead tuples not reclaimed (autovacuum behind) | n_dead_tup in pg_stat_user_tables high |
Aggressive autovacuum scale factor; VACUUM; reindex |
| 15 | Replica reads slow / stale after offloading | Replica lag; reads see old data | CloudWatch ReplicaLag; PI on the replica |
Reduce write load; scale replica; accept eventual reads |
| 16 | PI shows no top SQL / empty Top SQL tab | pg_stat_statements / Performance Schema not enabled |
SHOW shared_preload_libraries; / performance_schema |
Add to parameter group; reboot to load it |
| 17 | Deadlock errors in the log, deadlocks counter rising |
Two txns lock rows in opposite order | db.Concurrency.deadlocks; PG deadlock log lines |
Lock rows in a consistent order; shorten txns |
| 18 | MySQL wait/io/table/sql/handler high |
Full-table row access (missing index) | P_S; EXPLAIN shows type=ALL (full scan) |
Add index; avoid SELECT * scans |
The RDS/engine status & error reference
The status codes, events and error strings you meet alongside these waits:
| Signal | Where | Meaning | Fix |
|---|---|---|---|
FATAL: sorry, too many clients already (PG) |
Client / log | At max_connections — a connection storm |
RDS Proxy; raise cap modestly; fix leaks |
ERROR: canceling statement due to statement timeout |
Client / log | Query exceeded statement_timeout |
Optimise the query; raise timeout deliberately |
deadlock detected |
PG log | Two txns each hold what the other needs | Consistent lock ordering; retry logic |
database is not accepting commands to avoid wraparound |
PG log | XID wraparound protection tripped | Emergency VACUUM FREEZE; escalate to AWS |
ERROR: 1040 Too many connections (MySQL) |
Client | At max_connections |
RDS Proxy; raise max_connections param |
Lock wait timeout exceeded; try restarting transaction (MySQL) |
Client | innodb_lock_wait_timeout hit on a blocked row |
Find/end blocker; shorten txns |
RDS event Storage full |
RDS events / CloudWatch | FreeStorageSpace hit 0 |
Enable storage autoscaling; raise storage |
EBSIOBalance% = 0 |
CloudWatch | Burst IO credits exhausted (gp2/small gp3) | Move to gp3 provisioned IOPS / io2 |
RDS event DB instance restarted |
RDS events | OOM / crash / failover | Check Enhanced Monitoring memory; right-size |
PI shows LWLock:* dominant |
PI | Internal latch contention under extreme concurrency | Reduce churn/concurrency; often needs scale/redesign |
The three nastiest, in prose
IO:DataFileRead — cold cache or undersized instance. This is the most common tall band and the most misdiagnosed, because CloudWatch will happily show 100% CPU while the truth is the cores are stalled waiting for pages from EBS. The physics: PostgreSQL wants a data page, it isn’t in shared_buffers or the OS page cache, so the session blocks on a storage read. Two root causes, opposite fixes. If one query owns the wait (PI top SQL points at it) and EXPLAIN shows a Seq Scan with a huge Buffers: shared read=, the problem is a missing index — the engine is reading the whole table to return a few rows, and no amount of RAM fixes a plan that insists on scanning 40 million rows. Add the index, and the reads drop by orders of magnitude. If instead the wait is spread across many queries and the buffer cache hit ratio is chronically below ~99% with FreeableMemory low, the working set genuinely doesn’t fit in RAM — this is the case where scaling to a larger instance class (more memory) is the correct fix, because you are legitimately cache-starved. The discipline is: prove which case with PI top SQL before you spend money. Nine times out of ten it’s the index.
Lock:tuple / Lock:transactionid — a blocking transaction. Here the band is tall, the throughput has collapsed, and — the tell — CPU is near zero. The database isn’t working; it’s waiting. Sessions are queued behind a lock another transaction holds. The fastest confirmation on Postgres is pg_blocking_pids(): SELECT pid, pg_blocking_pids(pid), query, state FROM pg_stat_activity WHERE wait_event_type='Lock' hands you the blocked PIDs and the PIDs blocking them. Follow the chain to the root blocker — it is very often a session in idle in transaction (an application that ran an UPDATE, then went to do something else without committing) or a long-running batch job holding row locks the OLTP path needs. The fixes ladder from surgical to structural: kill the specific blocker (SELECT pg_terminate_backend(<pid>)) to end the incident now; set idle_in_transaction_session_timeout so the app can never again hold a lock indefinitely; add the missing foreign-key index that forces a parent update to lock-scan the child table; and structurally, shorten transactions and stop mixing long reporting writes with OLTP on the same rows. A lock band with idle CPU is never a capacity problem — a bigger instance waits just as patiently.
Connection-storm CPU — the serverless fan-out. Modern compute makes this easy to hit: a Lambda fleet or an autoscaling ECS/EKS service scales to hundreds of tasks, each opens its own database connections, and suddenly DatabaseConnections is pressing max_connections. Two things go wrong at once. First, past a point you get outright FATAL: sorry, too many clients already and the app throws. Second — subtler — even before the cap, thousands of short-lived connections cost real CPU: PostgreSQL forks a backend process per connection, and the connect/authenticate/teardown churn plus per-backend memory shows up as a CPU band that has nothing to do with useful query work, often alongside Client:ClientRead as backends wait on chatty clients. Raising max_connections is a trap: each connection reserves memory, and combined with work_mem you march the instance toward OOM. The right fix is a connection pooler in front of the database — RDS Proxy — which maintains a small warm pool of real connections and multiplexes the fleet’s thousands of client connections onto them, absorbing the storm, smoothing failover, and letting the instance spend its CPU on queries instead of process churn. (This is the load-side twin of the failures in the RDS connection-timeout playbook.) Cap the client-side pools too — a well-behaved app should not open unbounded connections per task.
Best practices
- Turn Performance Insights and Enhanced Monitoring on at creation, in Terraform, on every instance. They have negligible overhead and you cannot see a wait that happened before you were watching. Make “observable” the default state of a database, not a post-incident scramble.
- Read the band before you read anything else. Height vs the Max vCPU line, then the tallest colour. That two-step triage beats any dashboard-clicking and tells you CPU-vs-IO-vs-Lock in ten seconds.
- Never scale up before you’ve named the wait. A tall band that is
IO:DataFileReadfrom a missing index, orLock:*from a blocker, gets worse per rupee on a bigger instance. Earn the scale-up with a wait event that proves the instance is the constraint. - Fix, then confirm the shift. Every change is validated by re-reading DB load and watching the offending wait shrink. If the wait didn’t move, you fixed the wrong thing — un-do and re-diagnose.
- Rank top SQL by total time, not mean. A 5 ms query called 2 million times outweighs a 3-second query called twice.
pg_stat_statementsORDER BY total_exec_time(or PI top SQL by load) finds the real cost. - Index foreign keys. An unindexed FK is a silent
Lockgenerator; every parent update/delete lock-scans the child. Make FK indexes a review-checklist item. - Build indexes
CONCURRENTLYand migrate off-peak. A plainCREATE INDEXtakes anACCESS EXCLUSIVElock and creates aLock:relationstorm;CONCURRENTLYavoids it. - Keep
work_memmodest globally, raise it per session. It is per-operation-per-connection; a big global value plus concurrency is an OOM waiting to happen. Set it high only for the specific reporting connection that needs it. - Alarm on the leading indicators:
MaximumUsedTransactionIDs(wraparound), DB load > Max vCPU sustained,FreeStorageSpace,DatabaseConnectionsnear the cap, andReplicaLag. Not just “instance down.” - Front serverless/autoscaling compute with RDS Proxy. Pool the connections before the storm reaches the instance; cap client pools too.
- Never disable autovacuum; tune it to keep up. Lower the scale factor on big hot tables, raise
maintenance_work_memand worker count so each pass finishes, and watchn_dead_tupand XID age. - Offload reads to replicas, not to a bigger writer. Reporting and analytics reads belong on a read replica so their
IO/Lockwaits don’t contend with OLTP — see the Multi-AZ & read-replica sibling. - Use the API, not just the console.
aws pi get-resource-metrics/describe-dimension-keysmake the whole method scriptable and alertable; wire the top-wait query into your runbooks.
Security notes
- Encrypt Performance Insights data with a customer-managed KMS key. PI stores query text and load data; when you enable it, supply
performance_insights_kms_key_idso the captured SQL (which can contain sensitive literals) is encrypted with a key you control and audit. - Least-privilege the PI and monitoring access. Grant
pi:GetResourceMetrics,pi:DescribeDimensionKeysandpi:GetDimensionKeyDetailsonly to the roles that triage — reading query text is a data-exposure surface. The Enhanced Monitoring role should carry onlyAmazonRDSEnhancedMonitoringRole. - Query text can leak PII. PI top SQL and the slow query log may capture literal values (emails, tokens) in un-parameterised queries. Prefer parameterised statements (which also normalise better in
pg_stat_statements), and restrict who can read PI and the exported logs. - Guard the slow query / general logs. Export them to CloudWatch Logs with a retention policy and encryption; the general MySQL log in particular records every statement and is a heavy exposure — enable it only briefly for debugging.
- Do not widen
max_connectionsor disablestatement_timeout“temporarily” during an incident — both are how a performance incident becomes an availability incident (OOM, runaway queries). Fix the cause; keep the guardrails. - Keep databases in private subnets. None of this telemetry changes the rule: the instance is reachable only through security groups from the app tier; PI/Enhanced Monitoring/CloudWatch are the control-plane view, not a reason to expose the data plane.
- Manage parameter groups as code, reviewed in PRs. A wrong
work_mem,shared_buffersorautovacuumvalue is a latent performance (and OOM) landmine; Terraform + review catches it before it reaches production.
The security-and-resilience knobs that pull in the same direction:
| Control | Setting / mechanism | Secures against | Also prevents |
|---|---|---|---|
| PI encryption | performance_insights_kms_key_id |
Captured SQL / literals at rest | Compliance findings on query storage |
| Least-privilege PI IAM | pi:* scoped to triage roles |
Unaudited query-text reads | Accidental broad data access |
| Parameterised queries | App/driver + pg_stat_statements |
PII in query text/logs | Poor query-stat aggregation |
statement_timeout |
Parameter group / per session | — | Runaway queries pinning the DB |
idle_in_transaction_session_timeout |
Parameter group | — | Lock:* from abandoned transactions |
| Log encryption + retention | CloudWatch Logs KMS + retention | Log exposure / unbounded retention cost | Sensitive statements lingering |
| Private subnets + SG | VPC networking | Direct data-plane exposure | Connection storms from the internet |
Cost & sizing
The bill drivers and how they interact with the diagnostic decisions:
- The instance class dominates the bill, and “scale up” is the expensive reflex this article exists to prevent. A
db.r6g.xlarge(4 vCPU / 32 GiB) runs roughly ₹45,000–55,000/month on-demand; the2xlargeroughly doubles it. An index that drops DB load from AAS 9 to AAS 1.5 saves that entire doubling — the cheapest performance fix is almost always aCREATE INDEX, not a bigger box. - Performance Insights is free at 7-day retention. You pay only for long-term retention (>7 days), billed per vCPU-month of the instance. Keep 7 days for triage; enable long-term only on the few instances where you do quarterly/annual trend work.
- Enhanced Monitoring bills as CloudWatch Logs ingestion — small, but 1-second granularity on many instances adds up; use 1s on the instances you actively troubleshoot and 60s elsewhere.
- Storage IOPS is a real, tunable cost and a real bottleneck. gp3 gives a baseline (3,000 IOPS / 125 MB/s) you can provision higher; a chronic
IO:DataFileReadband that is genuinely cache-starved may be cheaper to fix with more gp3 IOPS than a bigger instance — but first check it isn’t a missing index (free to fix). - RDS Proxy has an hourly per-vCPU charge, far cheaper than the larger instance a connection storm would otherwise push you toward, and it prevents the OOM that raising
max_connectionsinvites.
A rough monthly picture, and what each spend actually buys:
| Cost driver | What you pay for | Rough INR / month | What it fixes | Watch-out |
|---|---|---|---|---|
db.r6g.xlarge (writer) |
4 vCPU / 32 GiB instance | ~₹45,000–55,000 | Baseline capacity | Scaling up masks missing indexes |
Scale to db.r6g.2xlarge |
8 vCPU / 64 GiB | ~₹90,000–110,000 | Genuine cache-starvation IO | Doubles bill; often avoidable via index |
| PI long-term retention | >7-day DB-load history | Per vCPU-month | Trend / regression / audit | 7 days is free — only pay if you use it |
| Enhanced Monitoring (1s) | CloudWatch Logs ingestion | ~₹300–1,500 | OS truth (CPU wait, swap, steal) | 1s × many instances adds up |
| gp3 provisioned IOPS | IOPS/throughput above baseline | ~₹1,500–6,000 | Real storage-IO ceilings | Fix the index first if one query |
| Read replica | A second instance for reads | ~₹45,000–55,000 | Offload read IO/Lock from OLTP |
Replica lag; extra instance cost |
| RDS Proxy | Per-vCPU-hour of the DB | ~₹3,000–6,000 | Connection storms; failover smoothing | Cheaper than the bigger instance it avoids |
The sizing rule: let the wait events size the instance. A CPU band chronically above the Max vCPU line after the queries are indexed is a real signal to add vCPUs. A many-query IO:DataFileRead band with a low cache-hit ratio is a real signal to add memory. A Lock or Client band is never a sizing signal — it’s a design fix. Right-size to the wait, not to the panic.
Interview & exam questions
1. What is Average Active Sessions and why is it a better load metric than CPU%? AAS is the mean number of sessions actively running or waiting at each instant. Unlike CPU% (which caps at 100% and hides queued/waiting work) or connection count (which counts idle sessions), AAS directly measures demand for the database and can be decomposed by wait event. Compared to the Max vCPU line (= the instance vCPU count), AAS instantly shows whether the database is saturated and why.
2. On the DB-load chart, AAS is 9 with a Max vCPU line at 4 and the band is mostly IO:DataFileRead. Do you scale the instance up? Not first. A dominant IO:DataFileRead band with a thin CPU slice means sessions are waiting on storage reads, not compute — more vCPUs sit idle. Check PI top SQL: if one query owns the wait and EXPLAIN shows a Seq Scan, add the missing index (free). Only if the wait is spread across many queries with a chronically low cache-hit ratio is “more RAM” the right fix.
3. Difference between Lock:tuple and Lock:transactionid? Both are lock waits. Lock:transactionid means a session is waiting for another transaction to commit or abort before it can proceed (find and end the blocker with pg_blocking_pids()). Lock:tuple means contention on a specific row lock — many transactions updating the same tuple (reduce hot-row contention). Both show a tall band with near-zero CPU.
4. CloudWatch shows 100% CPU but Performance Insights shows a thin CPU slice and a thick IO:DataFileRead band. What’s really happening? It’s IO wait, not compute. CloudWatch CPUUtilization counts IO-wait time as busy; Enhanced Monitoring’s CPU breakdown will show a high wait%, and PI proves it with the IO band. Treat it as an IO problem (index or memory), not a CPU problem — scaling vCPUs won’t help.
5. Which tool answers “is the host swapping / out of memory,” and why not CloudWatch? Enhanced Monitoring — it exposes OS-level memory.free, swap, per-process memory and CPU steal at up to 1-second granularity. CloudWatch’s FreeableMemory is a coarser service metric and doesn’t show swap or per-process detail. PI shows the effect (IO:DataFileRead from a too-small cache) but not the host memory truth.
6. How do you find the query behind a wait, and then confirm it’s a missing index? Slice PI DB load by db.sql (or pg_stat_statements ORDER BY total_exec_time) to get the statement, then run EXPLAIN (ANALYZE, BUFFERS). A Seq Scan with a large Rows Removed by Filter and a large Buffers: shared read= returning few rows is the missing-index signature. Add the index CONCURRENTLY, ANALYZE, and confirm the wait shrinks in PI.
7. Why is raising work_mem globally dangerous? work_mem is allocated per sort/hash operation per connection, not once. A high global value multiplied by many concurrent connections each running multi-operation queries can exceed instance RAM and OOM-kill backends. Raise it per session for the specific report that spills to disk; keep the global default modest.
8. What is transaction-ID wraparound and how do you prevent it? PostgreSQL XIDs are 32-bit and wrap at ~2 billion; autovacuum must freeze old rows before the oldest unfrozen XID gets too old, or the database stops accepting writes to protect itself. Prevent it by never disabling autovacuum, tuning it to keep up (more workers, maintenance_work_mem, lower scale factor on hot tables), and alarming on the MaximumUsedTransactionIDs CloudWatch metric well before 2B.
9. A Lambda fleet is causing DatabaseConnections to approach max_connections. What’s the fix, and why not just raise the cap? Front the database with RDS Proxy, which pools a small set of real connections and multiplexes the fleet’s thousands of client connections onto them. Raising max_connections is a trap: each connection reserves memory (and PostgreSQL forks a backend per connection), so a high cap plus work_mem marches the instance toward OOM. Cap client-side pools too.
10. What powers Performance Insights’ “Top SQL” on PostgreSQL, and what if the tab is empty? pg_stat_statements. If Top SQL is empty, the extension isn’t loaded: add pg_stat_statements to shared_preload_libraries in the parameter group and reboot (it’s a static parameter), then CREATE EXTENSION pg_stat_statements. On MySQL the equivalent is Performance Schema, also requiring a reboot to enable.
11. IO:XactSync dominates during a bulk load. What does it mean and how do you fix it? Sessions are waiting for each commit’s WAL to be flushed durably to storage (fsync). A row-at-a-time load commits (and fsyncs) per row. Batch many rows into fewer, larger transactions so you fsync once per batch, not per row; ensure storage has adequate write IOPS. It’s a commit-pattern problem, not a CPU problem.
12. Which certs cover this and where does it map? Primarily SAA-C03 (choosing and monitoring RDS/Aurora), SOA-C02 (SysOps — CloudWatch, Enhanced Monitoring, Performance Insights, alarms), and the Database Specialty (wait events, parameter tuning, autovacuum, RDS Proxy). The connection-storm and pooling angle also touches DVA-C02 (building apps that talk to RDS).
A compact cert-mapping for revision:
| Question theme | Primary cert | Objective area |
|---|---|---|
| AAS, Max vCPU, wait events | Database Specialty / SOA-C02 | Monitor & optimise databases |
| PI vs Enhanced Monitoring vs CloudWatch | SOA-C02 | Monitoring, logging, remediation |
| EXPLAIN, indexes, parameter groups | Database Specialty | Performance tuning |
| Autovacuum / wraparound | Database Specialty | Operational maintenance |
| RDS Proxy / connection storms | DVA-C02 / SAA-C03 | Design resilient data layers |
Quick check
- AAS is 8 on a
db.r6g.xlarge(Max vCPU line = 4) and the band is ~80%IO:DataFileRead, with a thinCPUslice. Is this a CPU problem? What’s your first move? - You see a tall
Lock:transactionidband with CPU near zero. What single Postgres function names the session to blame, and what’s the most common root cause? - True or false: raising
work_memto256MBin the parameter group is a safe way to speed up a slow report. - Which of the three lenses (Performance Insights, Enhanced Monitoring, CloudWatch) proves that a “100% CPU” instance is actually IO-bound, and what value do you look at?
- A Lambda fleet drives
DatabaseConnectionsto themax_connectionscap. What’s the correct fix, and why is raising the cap the wrong instinct?
Answers
- No — a dominant
IO:DataFileReadband with a thinCPUslice means sessions are waiting on storage, not computing; extra vCPUs would sit idle. First move: slice PI top SQL; if one query owns the wait,EXPLAIN (ANALYZE, BUFFERS)it and add the missing index (Seq Scan+ bigBuffers: shared read=confirms it). Only “add RAM” if the wait is spread across many queries with a low cache-hit ratio. pg_blocking_pids(pid)(run overpg_stat_activitywherewait_event_type='Lock') names the blocking PID(s). The most common root cause is a session stuck inidle in transaction— an app that ran anUPDATEand never committed — or a long batch job holding row locks the OLTP path needs.- False.
work_memis per-operation-per-connection;256MB× many operations × many connections can exceed RAM and OOM-kill backends. Raise it per session for the specific report, not globally. - Enhanced Monitoring — its CPU breakdown shows a high
wait%(IO wait) fraction, proving the cores are stalled on storage rather than computing. CloudWatchCPUUtilizationcounts IO-wait as busy and can’t distinguish the two; PI corroborates with theIO:DataFileReadband. - Front the database with RDS Proxy to pool and multiplex the connections. Raising
max_connectionsis wrong because each connection reserves memory (and Postgres forks a backend per connection), so a higher cap pluswork_memdrives the instance toward OOM — you’d trade a connection error for a memory crash.
Glossary
- Average Active Sessions (AAS) — the mean number of sessions running or waiting at each instant; the unit Performance Insights uses for DB load (
db.load.avg). - Max vCPU line — a horizontal line on the DB-load chart at a value equal to the instance’s vCPU count; AAS above it means sessions are queued or waiting.
- Wait event — a named reason a session is not executing on a CPU (e.g.
IO:DataFileRead,Lock:transactionid); the thing you diagnose and fix. - Wait event type — the class of a wait (CPU, IO, Lock, LWLock, Client, IPC…); the first level of triage.
- Performance Insights (PI) — the RDS feature that measures DB load as AAS and slices it by wait event, top SQL, host, user and database.
- Enhanced Monitoring — OS-level RDS metrics (CPU breakdown, memory, swap, per-process, disk) at 1–60-second granularity, delivered to CloudWatch Logs.
IO:DataFileRead— a PostgreSQL wait for a data page to be read from storage into cache; caused by cache misses or sequential scans.Lock:transactionid/Lock:tuple— Postgres waits for another transaction to finish, or for a specific row lock; the blocking-transaction and hot-row classes.Client:ClientRead— a wait for the client to send the next command; a symptom ofidle in transactionor a slow/chatty application, not a DB problem.IO:XactSync— a wait for a commit’s WAL to be flushed durably (fsync); high with many tiny transactions.pg_stat_statements— a PostgreSQL extension aggregating normalised query statistics; the source of PI’s Top SQL on Postgres.- Performance Schema — MySQL’s internal instrumentation subsystem; the source of PI’s waits and Top SQL on MySQL.
EXPLAIN (ANALYZE, BUFFERS)— runs a query and reports the actual plan, row counts and pages hit (cache) vs read (storage); the tool for spotting missing indexes and bad plans.- DB parameter group — the RDS mechanism for changing engine settings (
work_mem,shared_buffers, etc.); some parameters need a reboot. work_mem— memory per sort/hash operation per connection; too high globally risks OOM, so raise it per session.shared_buffers— PostgreSQL’s own page cache (RDS default ~25% of RAM); a static parameter (reboot to change).effective_cache_size— the planner’s estimate of total cache (not an allocation); set high to encourage index scans.- Autovacuum — the PostgreSQL background process that reclaims dead tuples and freezes old rows to prevent XID wraparound.
- Transaction-ID (XID) wraparound — the 32-bit XID limit (~2 billion) that, if freezing falls behind, forces the database to stop accepting writes.
- RDS Proxy — a managed connection pooler that multiplexes many client connections onto a small warm pool, absorbing connection storms and smoothing failover.
Next steps
You can now turn “the database is slow” into a named wait, a specific query, and a confirmed fix. Build outward:
- Next: RDS Connection Timeouts: A Troubleshooting Playbook — the connection-storm and
max_connectionsfailures you saw here as load, diagnosed from the client side. - Related: RDS Multi-AZ & Read Replicas for High Availability — offload read
IO/Lockwaits to replicas and understand theReplicaLagthat follows. - Related: Launching Amazon RDS: MySQL & PostgreSQL Hands-On — the instance, parameter-group and networking fundamentals every tuning step here builds on.
- Related: AWS Databases: RDS, DynamoDB and Aurora Compared — when a workload’s wait profile argues for a different store entirely.