A VM cannot reach the database. The app times out talking to an API. A subnet that worked yesterday suddenly can’t get to the internet. Your first instinct is to blame the firewall, the route, or DNS — and you might be right about all three at once. The hard part is not fixing an Azure networking problem; it is finding which of the five or six possible layers is actually blocking the packet, because every one of them fails with the same useless symptom: a timeout. Azure Network Watcher is the toolbox that turns that timeout into an answer — a regional diagnostic service that asks Azure’s own networking stack questions like “if this VM sent a packet to that IP on that port right now, would it be allowed, and where would it go?” and gets a definitive yes/no with the exact rule or route responsible.
This is the diagnostic playbook for it. We treat a connectivity failure as a path: a packet leaves a source NIC, is judged by NSG (Network Security Group) rules, is steered by effective routes to a next hop, crosses a gateway or firewall, is SNAT-translated on the way out, and is finally accepted (or not) by the destination’s own NSG. Each tool inspects one gate. Connection Troubleshoot runs a one-shot reachability test and names the blocking hop. IP Flow Verify answers “is this exact 5-tuple allowed by NSG?” and prints the deciding rule. Next Hop answers “where does Azure send this destination?” and names the route. Effective Security Rules and Effective Routes dump the merged, real rule and route tables. Connection Monitor does all of this continuously and alerts before a user notices. You will learn to pick the right tool in seconds, read its output, and map every common failure to the one check that proves it.
By the end you will stop SSH-ing into a broken VM to run ping against an endpoint that may not even allow ICMP — you will ask Azure directly. When a connection fails you will know whether an NSG rule denied it, a route black-holed it, DNS gave the wrong address, the destination is down, or you ran out of SNAT ports, and confirm which in a couple of minutes, not an hour of guesswork. This is a companion to the broader Diagnosing Azure VNet Connectivity: NSGs, UDRs, Effective Routes & Network Watcher deep dive; here we focus tightly on driving the tools themselves.
What problem this solves
Azure networking is layered on purpose — defence in depth means several independent gates can stop a packet — but that layering makes a failure ambiguous. A TCP connection that never completes looks identical whether an NSG denied it, a route table sent it into a black hole, a firewall next hop dropped it, the destination port isn’t listening, DNS resolved to the wrong IP, or the source ran out of outbound ports. From inside the VM all you get is Connection timed out, which says nothing about where the timeout happened.
What breaks without these tools: an engineer logs into the source VM (if they even can — RDP/SSH might be blocked by the very rule causing the outage) and runs ping or tracert. But ping uses ICMP, which most NSGs and endpoints block by default, so a failed ping proves nothing, and neither tool can see the control plane — the NSG rules and route tables Azure evaluates before a packet ever leaves the host. So people guess, change a rule, redeploy, and check again. Network Watcher replaces that loop with a question to the platform: it evaluates the actual rules and routes Azure would apply and names the responsible rule. This bites hardest when traffic crosses boundaries — a hub-and-spoke with a central firewall, forced tunnelling over VPN/ExpressRoute, or a private endpoint whose private DNS isn’t wired up — and the fix is rarely “open everything”; it is “find the one closed gate and open exactly that.” Here is every symptom class this article covers, the question it forces, and the first tool to reach for.
| Symptom class | What you observe | First question to ask | First Network Watcher tool |
|---|---|---|---|
| VM can’t reach a target | TCP timeout to an IP:port | Allowed by rules, and does the route reach it? | Connection Troubleshoot |
| NSG suspected | “Is the firewall blocking this?” | Which NSG rule decides this exact 5-tuple? | IP Flow Verify |
| Traffic disappears (black hole) | Packets leave but never arrive | Where does Azure actually send this destination? | Next Hop |
| Routing looks wrong | UDR added, behaviour changed | What is the merged route table on this NIC? | Effective Routes |
| Rules look right but still blocked | Portal rules seem fine | What are the effective NSG rules as merged? | Effective Security Rules |
| Intermittent / needs alerting | Fails sometimes, or at 3am | Is reachability degrading over time? | Connection Monitor |
| Need the actual packets | Need proof of what’s on the wire | What bytes are arriving on the NIC? | Packet Capture |
Learning objectives
By the end of this article you can:
- Enable Network Watcher in a region and confirm it is on, and explain why it is regional and (mostly) free.
- Run Connection Troubleshoot from a source VM to a destination IP/FQDN:port and read its hop-by-hop verdict to localise a failure to NSG, route, or the destination itself.
- Use IP Flow Verify to prove whether a specific 5-tuple is allowed or denied by NSG, and read which named rule made the decision.
- Use Next Hop to discover where Azure routes a destination — Internet, VirtualAppliance, VnetLocal, VirtualNetworkGateway, or None (a black hole) — and name the route responsible.
- Dump Effective Security Rules and Effective Routes for a NIC to see the merged truth Azure actually applies, not just what you typed.
- Stand up a Connection Monitor test for continuous reachability with loss/latency thresholds and alerts, and understand what it can and cannot test.
- Map every common connectivity failure — blocking NSG, wrong UDR, missing route, DNS, closed port, SNAT exhaustion — to the exact tool and command that confirms it, and apply the right fix.
Prerequisites & where this fits
You should already understand Azure networking basics: a Virtual Network (VNet) holds subnets; a NIC attaches a VM to a subnet; an NSG is a stateful allow/deny rule set you attach to a subnet or NIC; and a route table (UDR — User-Defined Route) can override Azure’s default system routes. You should know how to run az in Cloud Shell, read JSON, and that a TCP connection needs four things to succeed: a source allowed to send, a route to the destination, the destination allowed to receive, and something listening on the port. If those terms are fuzzy, read Azure Virtual Network, Subnets and NSGs: Networking Fundamentals first.
This sits in the Observability & Troubleshooting track, one layer below the rules themselves. The gates this article diagnoses are defined in Azure NSG Rules Explained: Priorities, Default Rules and Augmented Security Rules for Beginners and User-Defined Routes and Route Tables: Steering Azure Traffic the Way You Intend. When the target is a PaaS service over a private endpoint, Azure Private Endpoint vs Service Endpoint: Secure PaaS Access explains the DNS piece these tools will expose. And the logs Connection Monitor writes land in a workspace you set up per How to Create a Log Analytics Workspace: Region, Access Modes and Resource-Context RBAC.
As you read the path, keep the ownership in mind: the source NSG (outbound rules) and destination NSG (inbound rules) usually belong to the app/platform team and are inspected with IP Flow Verify; the route table/UDR, next hop (firewall/NVA) and gateway belong to the network team and are inspected with Next Hop and Effective Routes; SNAT and the destination app/port show up in Connection Troubleshoot. Knowing which gate a tool names tells you whom to call.
Core concepts
Five mental models make every later diagnosis obvious.
Network Watcher asks Azure’s control plane, not the guest OS. IP Flow Verify, Next Hop and Effective Routes evaluate the rules and routes Azure has configured for a NIC — the same logic the host applies to a real packet — without sending one. That is why they work even when the VM is unreachable: you query Azure’s model, which is the source of truth for NSG and routing decisions. Connection Troubleshoot and Connection Monitor go further and run an actual test from inside the source VM (via an extension), so they also see the guest-OS firewall and whether the destination port truly answers.
A connection needs all four conditions, and any one missing looks the same. For TCP to succeed: (1) the source is allowed to send (source NSG outbound), (2) a route carries the packet toward the destination (a real next hop, not None), (3) the destination is allowed to receive (destination NSG inbound), and (4) something is listening on the port. There’s a tool for each: IP Flow Verify for (1) and (3), Next Hop and Effective Routes for (2), and Connection Troubleshoot for the whole chain including (4).
Effective beats configured — always read the merged view. An NSG attaches to both a subnet and a NIC, and routes come from system defaults plus your UDRs plus BGP-learned routes. Azure merges these with precise precedence; what you typed in one place can be overridden elsewhere. Effective Security Rules and Effective Routes show the final, merged result Azure applies to that NIC — the only view that tells the truth. A rule that “looks right” in one blade may be beaten by a higher-priority rule in the other NSG.
Next hop “None” is a black hole, not a deny. When Next Hop returns a hop type of None, there is no route at all for that destination — the packet is silently dropped with no ICMP and no log. This differs from an NSG deny (a rule you can find) and is the most confusing routing failure, usually a UDR for 0.0.0.0/0 pointing at a next hop that no longer exists. Distinguishing None (routing dropped it) from Deny (a rule blocked it) is half of all diagnosis.
Connection Troubleshoot is point-in-time; Connection Monitor is continuous. They share a test engine for different jobs. Connection Troubleshoot is a single on-demand run you fire during an incident, returning one verdict with hop details. Connection Monitor runs that test on a schedule (e.g. every 30 s) from sources to destinations, records loss and latency, and alerts when reachability degrades — so you catch intermittent failures before users complain.
In short: Connection Troubleshoot names the blocking hop in one run; IP Flow Verify proves whether NSG is the blocker and names the rule; Next Hop finds black holes and wrong appliances; Effective Routes/Security Rules reveal the merged truth Azure applies; Connection Monitor catches intermittent failures over time; and Packet Capture gives you the real bytes when the control plane says “allowed” but it still fails. The Glossary at the end defines each in full.
Enabling Network Watcher and what it costs
Network Watcher is regional: there is one instance per region per subscription, and it must be enabled in the source’s region for the tools to work there. For most subscriptions Azure auto-enables Network Watcher when you create a VNet in a region, so it is usually already on — but verify, because a disabled region means the tools simply aren’t available.
# List Network Watchers and their provisioning state, per region
az network watcher list \
  --query "[].{name:name, region:location, state:provisioningState}" -o table

# Enable Network Watcher in a region if it's missing
az network watcher configure --resource-group NetworkWatcherRG \
  --locations centralindia --enabled true
resource nw 'Microsoft.Network/networkWatchers@2023-11-01' = {
  name: 'NetworkWatcher_centralindia'
  location: 'centralindia'   // one per region; lives in the NetworkWatcherRG resource group
  properties: {}
}
The control-plane tools (IP Flow Verify, Next Hop, Effective Routes/Rules) are free — they query Azure’s model and cost nothing per call. The tools that run an agent or store data do cost a little. Here is the cost shape, so you know what is safe to use freely and what to budget for.
| Tool / feature | What you pay for | Rough cost | Free to run on demand? |
|---|---|---|---|
| IP Flow Verify | Nothing | Free | Yes |
| Next Hop | Nothing | Free | Yes |
| Effective Routes / Security Rules | Nothing | Free | Yes |
| Connection Troubleshoot | Per check (small) | Pennies per run | Effectively yes |
| Connection Monitor | Per test + Log Analytics ingestion | Per-test hourly + GB ingested | Ongoing cost — budget it |
| Packet Capture | Capture time + storage of the .cap |
Storage + small capture fee | Cheap but stores data |
| NSG flow logs / VNet flow logs | Storage + (optional) Traffic Analytics | Per-GB storage + analytics | Ongoing cost |
A reading note that saves confusion: Network Watcher lives in an auto-created resource group named NetworkWatcherRG. Do not delete it expecting to “clean up” — that disables the service for the region.
Connection Troubleshoot — your first move in an incident
When a VM can’t reach a target, Connection Troubleshoot (az network watcher test-connectivity) is the fastest single answer. It runs an actual test from inside the source VM (via the Network Watcher Agent extension) to a destination IP or FQDN and port, and returns a verdict (Reachable / Unreachable), latency, probe loss, and a hop-by-hop list that names where the path broke and why — an NSG rule, a route, or “no listener.”
# Test TCP reachability from a source VM to a destination IP:port
az network watcher test-connectivity \
  --resource-group rg-shop-prod \
  --source-resource vm-app-01 \
  --dest-address 10.20.0.4 --dest-port 1433 --protocol Tcp \
  -o json
Testing by FQDN instead of IP additionally proves DNS resolves correctly from the VM — a frequent hidden cause:
# Test to an FQDN — this also exercises the VM's DNS resolution
az network watcher test-connectivity \
  --resource-group rg-shop-prod \
  --source-resource vm-app-01 \
  --dest-address sql-shop.privatelink.database.windows.net --dest-port 1433
Read the result top-down: connectionStatus (Reachable / Unreachable / Degraded) is the headline; avgLatencyInMs and probesFailed/probesSent show latency and loss (partial loss hints at a flaky path or SNAT pressure); and hops[] is the story — each blocking hop carries an issues[] array whose type names the blocker class (NetworkSecurityRule = an NSG denied it) and whose value gives the exact rule to fix. A hop of type VirtualAppliance means traffic went via a firewall/NVA.
It’s the right first tool because it tests the whole chain at once — rules, route, and listener — and tells you which link failed, so you drill in with the targeted tool next:
| Connection Troubleshoot says… | It means… | Drill in with |
|---|---|---|
Issue type NetworkSecurityRule |
An NSG allowed/denied decision blocked it | IP Flow Verify to see the exact rule |
Hop ends at a VirtualAppliance, no further |
A firewall/NVA dropped or didn’t forward it | Check the NVA/firewall; Next Hop to confirm routing |
Unreachable, port closed, rules OK |
Nothing listening on the destination port | App team — the service is down or wrong port |
Next hop is None / no route |
Routing black hole | Next Hop + Effective Routes |
| FQDN test fails but IP test works | DNS resolves wrong (or not at all) | Private DNS / resolver config |
IP Flow Verify — does NSG allow this exact flow?
IP Flow Verify answers one precise question: for a given 5-tuple and direction, would the NSG rules on this NIC allow or deny the packet, and which rule decides? It sends no packet; it evaluates the merged NSG rules and returns Allow or Deny plus the name of the deciding rule — the definitive test for “is the firewall the problem?”
# Would the NIC allow an OUTBOUND TCP packet to 10.20.0.4:1433?
az network watcher test-ip-flow \
  --resource-group rg-shop-prod \
  --vm vm-app-01 \
  --direction Outbound --protocol Tcp \
  --local 10.10.0.5:0 --remote 10.20.0.4:1433 \
  -o json
# Returns: access = Allow|Deny, ruleName = <the deciding rule>
Run it from both ends — outbound from the source proves its NSG lets the packet out, and an Inbound run on the destination VM (swap to --direction Inbound and the destination’s local/remote addresses) proves its NSG lets it in. Most “the rules look fine” failures are a deny on the side you didn’t check.
The ruleName is the gold — it names exactly which rule to edit. Watch for the default rules, which decide more failures than people expect because a missing explicit allow falls through to them: AllowVNetInBound/AllowVnetOutBound (65000) permit VNet-internal traffic, AllowAzureLoadBalancerInBound (65001) permits LB health probes, AllowInternetOutBound (65001) permits egress, and the catch-alls DenyAllInBound and DenyAllOutBound (65500) deny everything else. So unsolicited inbound is blocked unless you add an allow, and outbound works until you add a higher deny.
A precedence reminder that explains most “but my allow rule is right there!” tickets: NSG rules evaluate lowest priority number first, first match wins — a Deny at 200 beats your Allow at 300. IP Flow Verify cuts through this by naming the actual winning rule.
| If IP Flow Verify says… | It means… | Do this |
|---|---|---|
Deny, names a custom rule |
Your own rule blocks it | Fix that rule’s source/dest/port or priority |
Deny, names DenyAllInBound |
No explicit inbound allow exists | Add an allow rule (lower number than 65500) |
Deny, names DenyAllOutBound |
A higher deny removed default internet egress | Add the needed outbound allow above the deny |
Allow, but traffic still fails |
NSG is not the problem | Move to Next Hop (routing) or the listener |
Allow one direction, Deny other |
Asymmetric rules | Fix the denying side (run both directions) |
Next Hop — where does Azure actually send this packet?
Next Hop answers the routing question: for a packet from a source to a destination IP, what does the effective route table say the next hop is? It returns a hop type and, crucially, the route that produced it — so when traffic vanishes you see whether it went to the internet, the VNet, a firewall, a gateway, or nowhere.
# Where does a packet from this VM (10.10.0.5) to 10.20.0.4 actually go?
az network watcher show-next-hop \
  --resource-group rg-shop-prod \
  --vm vm-app-01 \
  --source-ip 10.10.0.5 --dest-ip 10.20.0.4 \
  -o json
# Returns: nextHopType, nextHopIpAddress, routeTableId (the route responsible)
The hop type is the whole answer. Here is every value Next Hop can return, what it means, and when each one is the bug.
nextHopType |
Meaning | Normal for… | When it’s the problem |
|---|---|---|---|
Internet |
Routed to the public internet | Egress to public endpoints | You wanted it to go via a firewall, not direct |
VnetLocal |
Stays within the VNet | VM-to-VM in the same VNet | — |
VNetPeering |
Crosses a VNet peering | Hub-spoke / spoke-spoke | Peering missing or not “allow forwarded traffic” |
VirtualNetworkGateway |
To a VPN/ExpressRoute gateway | On-prem / cross-region | Gateway down, or BGP route missing |
VirtualAppliance |
To an NVA/firewall IP | Forced tunnelling via firewall | Appliance IP wrong/down → black hole behind it |
VirtualNetworkServiceEndpoint |
To a service-endpoint-enabled PaaS | Storage/SQL via service endpoint | Endpoint not enabled on the subnet |
None |
No route — packet dropped | Never normal | Black hole: a 0.0.0.0/0 UDR to a dead hop, or missing route |
The two it uniquely catches are None (a route resolving to nothing — usually a 0.0.0.0/0 UDR whose next-hop IP was deleted — so the packet is silently dropped) and a wrong VirtualAppliance (traffic forced through a firewall that’s down, dying behind the reported hop). The decision table:
| If Next Hop returns… | Likely cause | Confirm / fix |
|---|---|---|
None |
UDR points at a non-existent next hop, or route missing | Inspect that route table; fix the next-hop IP or add the route |
VirtualAppliance (unexpected) |
A UDR is forcing traffic via a firewall/NVA | Check the appliance is up and forwarding; or fix the UDR |
Internet (but you wanted inspection) |
Default route still applies; forced tunnelling not set | Add a UDR for 0.0.0.0/0 → your firewall |
VirtualNetworkGateway but on-prem unreachable |
Gateway/BGP issue, not local routing | Check the gateway and BGP-learned routes |
| The expected hop, yet still failing | Routing is fine — it’s NSG or the listener | Back to IP Flow Verify / port check |
Effective routes and effective NSG rules — the merged truth
When IP Flow Verify and Next Hop surprise you, dump the effective views to see everything Azure merged. These are read-only, free, and the most under-used tools in the kit.
Effective Routes shows the full route table on a NIC — system routes, your UDRs, and BGP-learned routes — revealing overlaps and which route actually wins per prefix.
# The complete, merged route table on a NIC (system + UDR + BGP)
az network nic show-effective-route-table \
  --name vm-app-01-nic --resource-group rg-shop-prod -o table
Effective Security Rules shows the full merged NSG rule set on a NIC — subnet NSG and NIC NSG combined, with platform defaults — exactly as evaluated.
# The complete, merged NSG rules on a NIC (subnet NSG + NIC NSG + defaults)
az network nic list-effective-nsg \
  --name vm-app-01-nic --resource-group rg-shop-prod -o json
Why these beat the per-rule tools sometimes: they show context. IP Flow Verify gives one flow’s verdict; Effective Security Rules shows why — the overlapping higher-priority rule sitting above your allow. Next Hop gives one destination’s hop; Effective Routes shows the 0.0.0.0/0 UDR catching far more than you intended. Use Next Hop and IP Flow Verify for a quick single check; reach for the effective views when that single check surprises you and you need the whole picture.
A precedence reminder the effective view makes visible: Azure picks the route with the longest prefix match first; on a tie, UDR beats BGP beats system. So a /32 system route can beat your /16 UDR for one address — invisible until you read the effective table.
Connection Monitor — catch it before the user does
Everything above is point-in-time. Connection Monitor runs a reachability test continuously — from sources (a VM, VMSS, or on-prem agent) to destinations (an IP, FQDN, or Azure resource) — at a set frequency, recording percentage loss and round-trip latency to a Log Analytics workspace where you chart them and fire metric alerts. It turns “it failed at 3am and recovered before I woke” into a page and a graph.
# Create a Connection Monitor test (V2) — source VM to a SQL endpoint on 1433
az network watcher connection-monitor create \
  --name cm-app-to-sql --resource-group NetworkWatcherRG --location centralindia \
  --endpoint-source-name app01 --endpoint-source-resource-id $(az vm show -g rg-shop-prod -n vm-app-01 --query id -o tsv) \
  --endpoint-dest-name sql --endpoint-dest-address sql-shop.privatelink.database.windows.net \
  --test-config-name tcp1433 --protocol Tcp --tcp-port 1433 \
  --frequency 30
The model has three parts you configure: endpoints (what’s tested), test configurations (protocol, port, frequency, and the success thresholds), and test groups (which sources test which destinations with which config). Use TCP to the real port (not ICMP, which may be blocked); set the frequency as low as 30 s (faster detection, more cost); and set the checks-failed % and round-trip-time thresholds carefully — too tight and a flaky-but-fine path pages you, so baseline first and alert on change. Point endpoints at an FQDN to validate DNS continuously, and wire the results to a Log Analytics workspace for queries and alerts.
What Connection Monitor can and cannot do is worth knowing before you rely on it.
| Connection Monitor can… | Connection Monitor cannot… |
|---|---|
| Test continuously and alert on loss/latency | Tell you the NSG rule name (use IP Flow Verify) |
| Test VM↔VM, VM↔FQDN, VM↔IP, and hybrid (on-prem agent) | Test from a source with no agent/extension installed |
| Show a hop-by-hop topology with the failing hop | Capture packet contents (use Packet Capture) |
| Validate DNS continuously (FQDN endpoints) | Replace a one-shot deep dive during a live incident |
| Write to Log Analytics for dashboards/alerts | Work for free — it has ongoing test + ingestion cost |
Use Connection Troubleshoot to diagnose now, Connection Monitor to watch forever. They are complements, not alternatives.
Architecture at a glance
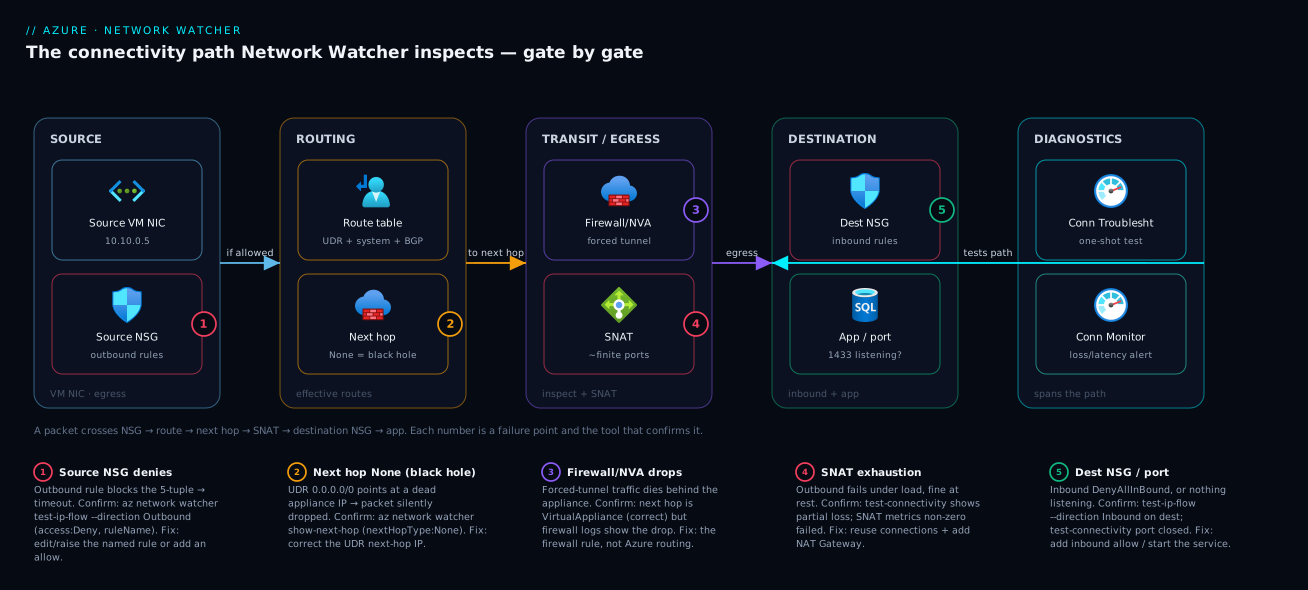
The diagram traces a TCP connection the way Azure evaluates it, mapping each tool onto the gate it inspects. Read it left to right: a packet leaves the source VM’s NIC, is judged by the source NSG (outbound rules — IP Flow Verify asks “would this 5-tuple pass, and by which rule?”), then the effective route table picks a next hop (Next Hop and Effective Routes reveal whether it’s the internet, a firewall, a gateway, or the dreaded None black hole that drops the packet with no log). It then crosses any firewall/NVA or gateway, is SNAT-translated on egress, and arrives at the destination NSG, whose inbound rules must allow it before the destination app on its port can answer.
Two instruments span the whole path along the bottom: Connection Troubleshoot fires one end-to-end test that localises the break to a gate, and Connection Monitor runs it continuously and alerts on degradation. That is the entire method — ask “source rules, route, destination rules, or listener?”, point the matching tool at that gate, read the named cause, fix exactly that. The numbered badges mark the five most common failure points; the legend narrates each as symptom, the tool that confirms it, and the fix.
Real-world scenario
Finvault Payments runs a payment-processing API on a VM scale set in a spoke VNet in Central India, peered to a hub VNet hosting an Azure Firewall. The spoke has a UDR forcing all internet-bound traffic (0.0.0.0/0) through the firewall — a standard hub-and-spoke. The API calls an external card-network endpoint over HTTPS and writes to Azure SQL over a private endpoint. The platform team is three engineers; relevant monthly spend is about ₹40,000 across firewall and compute.
The incident began on a Tuesday at 09:40 after a “routine” change: the network team rebuilt the firewall, gave it a new private IP, and updated the UDR — they thought. Within minutes outbound calls to the card network started timing out; checkout success dropped from 99.8% to 41%. The on-call engineer SSH’d into a node and ran ping and curl — both hung. ping proved nothing (ICMP was never allowed through the firewall anyway), and a hung curl only confirmed “something is broken,” not where. Twenty minutes of editing NSG rules followed, on the theory the firewall change had tightened something. Nothing improved, and now the NSG was a mess too.
The breakthrough was asking Azure instead of the guest OS — Next Hop from a node to a public card-network IP:
az network watcher show-next-hop --resource-group rg-pay-prod \
  --vm vmss-pay_0 --source-ip 10.30.0.6 --dest-ip 203.0.113.50
# nextHopType: "None"
nextHopType: None — a black hole. The 0.0.0.0/0 UDR still pointed at the firewall’s old private IP, gone after the rebuild, so every internet-bound packet was routed to nowhere and silently dropped. No NSG rule was involved at all; the twenty minutes of edits had chased the wrong gate. Effective Routes confirmed it: the 0.0.0.0/0 UDR resolved to a VirtualAppliance next-hop IP that no longer answered.
The fix was a one-line UDR update to the firewall’s new IP. To prove it before declaring victory, the engineer ran Connection Troubleshoot to the card endpoint and got Reachable through a clean VirtualAppliance hop; checkout recovered within two minutes. The review produced two changes: the IP Flow Verify and Next Hop commands went into the runbook as the first moves (before anyone touches a rule), and a Connection Monitor test now watches the scale set to both the card endpoint and the SQL private endpoint, alerting on >10% loss — so the next firewall change pages them in 30 seconds instead of surfacing as a 60% revenue drop. The lesson on the wall: “A timeout is a question. Ask Azure where the packet went before you change a rule.”
The incident as a timeline, because the order of moves is the lesson:
| Time | Symptom | Action taken | Effect | What it should have been |
|---|---|---|---|---|
| 09:40 | Outbound timeouts, checkout at 41% | (alert fires) | — | Ask: where does the packet go? |
| 09:45 | Still failing | ping / curl from the node |
Both hang — proves nothing | ICMP is blocked anyway; don’t rely on it |
| 09:50 | Worse | Edit NSG rules on a hunch | No change; NSG now messy | Don’t change a gate you haven’t confirmed |
| 10:05 | Root cause found | Next Hop → None |
Black hole identified | This should have been move #1 |
| 10:07 | Confirmed | Effective Routes shows dead UDR next hop | Cause proven | — |
| 10:10 | Fixed | Update UDR to firewall’s new IP | Routing restored | Correct fix |
| 10:12 | Verified | Connection Troubleshoot → Reachable |
Recovery proven, not guessed | Verify with a tool, not the dashboard |
| +1 day | Prevented | Connection Monitor with loss alert | Next change pages in 30s | Watch continuously |
Advantages and disadvantages
Network Watcher’s approach — query the control plane and run agent-based tests — makes ambiguous timeouts diagnosable, but it has real limits worth weighing.
| Advantages (why these tools help you) | Disadvantages (why they fall short) |
|---|---|
| Control-plane tools (IP Flow Verify, Next Hop, Effective Routes/Rules) give a definitive Allow/Deny or hop with the responsible rule — no guessing | They evaluate Azure’s model; a guest-OS firewall (Windows Firewall, iptables) is invisible to them — only Connection Troubleshoot/Monitor see it |
| Most tools are free and read-only — safe to run anytime, even mid-incident, with zero blast radius | Connection Monitor and flow logs have ongoing cost (per-test + Log Analytics ingestion) |
| IP Flow Verify and Next Hop name the exact rule/route, so you fix one line, not “open everything” | They diagnose Azure networking; they can’t see inside a third-party NVA’s own rule engine — only that traffic reached it |
| Connection Troubleshoot tests the whole chain at once, including whether the port truly answers | It’s point-in-time; a flaky/intermittent fault may not reproduce on the one run |
| Connection Monitor turns silent 3am failures into alerts and graphs | Sources need the Network Watcher Agent extension; it can’t test from a host with no agent |
| Works even when the VM is unreachable (control-plane tools need no packet) | None and VirtualAppliance tell you routing to a hop, not what happens behind a down firewall |
| Effective views reveal overrides and overlaps you’d never spot rule-by-rule | The output is detailed JSON — you must know which field matters (this article’s tables) |
It’s right whenever a connection times out and you don’t know which layer is to blame, and shines on routed multi-hop topologies (hub-spoke, forced tunnelling) where the failure could be in any of five gates. It falls short on guest-OS issues (a host firewall, a service that isn’t listening) and third-party appliance internals — there, Connection Troubleshoot localises to the hop and you debug that hop with its own tools.
Hands-on lab
This lab stands up two small VMs, breaks connectivity with an NSG rule and a bad route, diagnoses each with Network Watcher, then tears it down. It uses B1s VMs and the free control-plane tools, so it costs a few rupees of compute. Run it in Cloud Shell.
Step 1 — Resource group and a VNet with two subnets.
az group create -n rg-nw-lab -l centralindia
az network vnet create -g rg-nw-lab -n vnet-lab \
  --address-prefix 10.0.0.0/16 \
  --subnet-name snet-app --subnet-prefix 10.0.1.0/24
az network vnet subnet create -g rg-nw-lab --vnet-name vnet-lab \
  -n snet-db --address-prefix 10.0.2.0/24
Step 2 — Two Linux VMs (source and destination), with the Network Watcher agent. The agent (the NetworkWatcherAgentLinux extension) is what lets Connection Troubleshoot run from the VM.
az vm create -g rg-nw-lab -n vm-source --image Ubuntu2204 --size Standard_B1s \
  --vnet-name vnet-lab --subnet snet-app --admin-username azureuser \
  --generate-ssh-keys --public-ip-address "" --nsg "nsg-source"
az vm create -g rg-nw-lab -n vm-dest --image Ubuntu2204 --size Standard_B1s \
  --vnet-name vnet-lab --subnet snet-db --admin-username azureuser \
  --generate-ssh-keys --public-ip-address "" --nsg "nsg-dest"

# Install the Network Watcher agent on the source so test-connectivity works
az vm extension set -g rg-nw-lab --vm-name vm-source \
  --name NetworkWatcherAgentLinux --publisher Microsoft.Azure.NetworkWatcher --version 1.4
Step 3 — Baseline, then break it with an NSG deny and catch it with IP Flow Verify. Start a listener on the destination, confirm Reachable, then add an outbound deny and prove it names your rule.
# Start a listener on vm-dest, then baseline-test from vm-source (expect Reachable)
az vm run-command invoke -g rg-nw-lab -n vm-dest --command-id RunShellScript \
  --scripts "nohup python3 -m http.server 8080 >/tmp/h.log 2>&1 &"
az network watcher test-connectivity -g rg-nw-lab \
  --source-resource vm-source --dest-resource vm-dest --dest-port 8080 --protocol Tcp \
  --query "{status:connectionStatus}" -o json     # -> { "status": "Reachable" }

# Now deny it, then ask IP Flow Verify why (expect Deny / DenyApp8080)
az network nsg rule create -g rg-nw-lab --nsg-name nsg-source -n DenyApp8080 \
  --priority 200 --direction Outbound --access Deny --protocol Tcp \
  --destination-port-ranges 8080 --destination-address-prefixes 10.0.2.0/24
SRC_IP=$(az vm show -g rg-nw-lab -n vm-source -d --query privateIps -o tsv)
DEST_IP=$(az vm show -g rg-nw-lab -n vm-dest -d --query privateIps -o tsv)
az network watcher test-ip-flow -g rg-nw-lab --vm vm-source --direction Outbound \
  --protocol Tcp --local ${SRC_IP}:0 --remote ${DEST_IP}:8080 \
  --query "{access:access, rule:ruleName}" -o json  # -> { "access":"Deny","rule":"DenyApp8080" }
az network nsg rule delete -g rg-nw-lab --nsg-name nsg-source -n DenyApp8080
Step 4 — Break routing and catch it with Next Hop, then read the effective views. Force the destination subnet to a non-existent appliance — a black hole — and watch Network Watcher report it.
az network route-table create -g rg-nw-lab -n rt-blackhole
az network route-table route create -g rg-nw-lab --route-table-name rt-blackhole \
  -n to-db --address-prefix 10.0.2.0/24 \
  --next-hop-type VirtualAppliance --next-hop-ip-address 10.0.1.250  # nothing listens here
az network vnet subnet update -g rg-nw-lab --vnet-name vnet-lab -n snet-app --route-table rt-blackhole
az network watcher show-next-hop -g rg-nw-lab --vm vm-source \
  --source-ip ${SRC_IP} --dest-ip ${DEST_IP} \
  --query "{hop:nextHopType, ip:nextHopIpAddress}" -o json  # -> VirtualAppliance / 10.0.1.250

# The merged views that explain the behaviour
NIC=$(az vm show -g rg-nw-lab -n vm-source --query "networkProfile.networkInterfaces[0].id" -o tsv)
az network nic show-effective-route-table --ids "$NIC" -o table
Step 5 — Teardown. Delete the resource group; nothing here is meant to live.
az group delete -n rg-nw-lab --yes --no-wait
You have now reproduced the two most common connectivity failures — an NSG deny and a routing black hole — and confirmed each with the one tool that names the cause. That is the entire skill.
Common mistakes & troubleshooting
This is the centerpiece. Below is the playbook: for each symptom, the root cause, the exact command or portal path to confirm it, and the fix. Scan the master table, then read the per-symptom detail for whichever row matches. The whole point is that every row ends in a definitive confirmation, not a hunch.
| # | Symptom | Root cause | Confirm (exact cmd / portal path) | Fix |
|---|---|---|---|---|
| 1 | VM can’t reach an IP:port, NSG suspected | A deny rule (yours or default) blocks the 5-tuple | az network watcher test-ip-flow ... --direction Outbound → access:Deny, ruleName:<x> |
Edit/raise priority of the named rule, or add an allow |
| 2 | Outbound traffic vanishes, no error | UDR for 0.0.0.0/0 points at a dead next hop |
az network watcher show-next-hop → nextHopType:None (or dead VirtualAppliance) |
Fix the UDR’s next-hop IP, or remove the bad route |
| 3 | “Rules look fine” but still blocked | A higher-priority rule in the other NSG overrides yours | az network nic list-effective-nsg → find the winning rule above yours |
Re-prioritise; remember subnet+NIC NSGs both apply |
| 4 | Inbound to a VM fails, outbound is fine | Destination NSG has no inbound allow (hits DenyAllInBound) |
test-ip-flow --direction Inbound on the destination → DenyAllInBound |
Add an inbound allow rule below priority 65500 |
| 5 | Reachable by IP, fails by name | DNS resolves wrong/not at all (esp. private endpoint) | test-connectivity --dest-address <FQDN> fails; IP test passes |
Wire up Private DNS zone / correct the resolver |
| 6 | Works at rest, fails under load | SNAT port exhaustion on outbound | test-connectivity shows intermittent loss; SNAT metrics non-zero failed |
Reuse connections; add NAT Gateway / more public IPs |
| 7 | Connection Troubleshoot says port closed, rules OK | Nothing listening on the destination port | test-connectivity → Unreachable, NSG Allow confirmed |
App team: start the service / fix the port |
| 8 | Spoke can’t reach another spoke | Peering missing “allow forwarded traffic”, or no UDR via hub | show-next-hop → unexpected Internet/None instead of via hub |
Enable forwarded traffic; add UDR to the hub firewall |
| 9 | On-prem unreachable over VPN/ER | Gateway down or BGP route not learned | show-next-hop → VirtualNetworkGateway; effective routes lack on-prem prefix |
Check gateway/BGP; the local route is fine |
| 10 | Private endpoint reached but app fails | DNS returns the public IP, not the private one | nslookup <fqdn> from the VM returns a public IP |
Link the privatelink DNS zone to the VNet |
| 11 | Traffic forced through firewall is dropped | The NVA/firewall itself denies or isn’t forwarding | show-next-hop→VirtualAppliance (correct); firewall logs show the drop |
Fix the firewall rule (Azure routing is fine) |
| 12 | test-connectivity errors “agent not found” |
Network Watcher agent extension missing on the source | az vm extension list ... lacks NetworkWatcherAgent* |
Install the agent extension on the source VM |
| 13 | Tools unavailable / commands fail in a region | Network Watcher disabled in that region | az network watcher list shows the region missing |
az network watcher configure --locations <region> --enabled true |
| 14 | ICMP test fails but app actually works | Relying on ping; ICMP is blocked, TCP is fine |
test-connectivity --protocol Tcp succeeds; ICMP fails |
Test TCP, not ICMP — ICMP failure is meaningless here |
The master table is the working reference; three rows deserve a closer look because they are the ones engineers most often get wrong.
Symptom 2 — A routing black hole (None or a dead appliance)
Traffic leaves and never returns, with no NSG involved. Confirm with az network watcher show-next-hop: a nextHopType of None means no route resolves the destination; a VirtualAppliance pointing at an IP nothing answers is the same failure one level down, and Effective Routes (az network nic show-effective-route-table) shows the offending UDR. Fix: correct the next-hop IP on the 0.0.0.0/0 (or specific) UDR, or remove the bad route. This is the failure ping/traceroute can never explain because the drop is silent and pre-OS.
Symptom 3 — The “other” NSG overrides your rule
NSGs apply at both subnet and NIC; people fix the rule in one while the other still blocks. Confirm with az network nic list-effective-nsg — it prints the merged set with priorities, and you’ll see a higher-priority deny (from the NSG you didn’t edit) sitting above your allow. Fix: adjust priorities so the allow wins, or remove the conflicting deny. The effective view is the only place this overlap is visible; rule-by-rule inspection hides it.
Symptom 14 — Stop trusting ping
The oldest trap: ping fails so people assume the network is down, but ICMP is denied by most NSGs and many endpoints while TCP on the app port works perfectly. Confirm: test-connectivity --protocol Tcp --dest-port <port> succeeds even though ICMP fails. Fix: there’s nothing to fix — test the protocol your app actually uses. A failed ping is not evidence of a network problem in Azure.
Best practices
- Reach for the control-plane tools first. IP Flow Verify and Next Hop are free, instant, and need no agent — run them before you touch a rule or route. They tell you which gate to even look at.
- Always test both directions and both ends. Outbound from the source and inbound on the destination are different NSGs; check both or you’ll fix the wrong one.
- Read the effective view when a single check surprises you. Effective Security Rules and Effective Routes reveal the overrides and overlaps that per-rule inspection hides.
- Distinguish
NonefromDeny. A black-holed route and a denied rule both look like a timeout — Next Hop versus IP Flow Verify tells you which, and they have completely different fixes. - Test by FQDN, not just IP, to catch DNS. An FQDN test also exercises name resolution — the hidden cause behind half of “private endpoint doesn’t work” tickets.
- Never diagnose with
ping. ICMP is blocked far more often than it’s allowed; test the actual TCP/HTTP path your app uses. - Put Connection Monitor on critical paths. Continuous tests with loss/latency alerts turn silent intermittent failures into pages and graphs.
- Bake the commands into your runbook. Make IP Flow Verify and Next Hop the first incident steps, before anyone edits a rule — the Finvault outage was a 20-minute detour for want of this.
- Don’t delete
NetworkWatcherRG. That auto-created resource group is the service for the region; removing it disables your tools. - Confirm the fix with a tool, not the dashboard. After a change, re-run Connection Troubleshoot/IP Flow Verify to prove recovery instead of waiting on user-facing metrics.
- Keep flow logs on for the audit trail. NSG/VNet flow logs (to storage, optionally Traffic Analytics) give you the historical “what was allowed/denied” record the point-in-time tools can’t.
Security notes
Network Watcher reads sensitive topology and touches real resources — treat access accordingly. Grant it via Azure RBAC at the smallest scope: Network Contributor covers running the tools, but for read-only diagnosis prefer Reader plus a narrow custom role for just the Microsoft.Network/networkWatchers/* actions you need (ipFlowVerify/action, nextHop/action, connectivityCheck/action). Don’t hand out broad contributor access just to let on-call run a reachability test.
Mind what each tool exposes: Effective Security Rules and Effective Routes reveal your entire firewalling and routing posture for a NIC — useful to an attacker mapping your network, so keep assignments tight and audited. Packet Capture is the most sensitive: it writes packets (which can contain unencrypted tokens or credentials in transit) to storage — restrict who can run it, lock down and encrypt the destination, set short retention. Connection Monitor and flow logs write to a Log Analytics workspace or storage; secure those like any telemetry sink with resource-context RBAC per How to Create a Log Analytics Workspace: Region, Access Modes and Resource-Context RBAC. And remember these tools diagnose controls but aren’t one — before you open a “deny” you found, understand why the rule exists, lest you punch a hole through a deliberate boundary.
Cost & sizing
The tools you reach for in an incident are free (the cost table in Enabling Network Watcher above lists each feature): IP Flow Verify, Next Hop and the Effective views are control-plane queries with no per-call charge, and Connection Troubleshoot is billed trivially per check. The costs that accumulate are the continuous features — Connection Monitor charges per test and ingests results into Log Analytics per GB; Packet Capture costs capture time plus .cap storage; and NSG/VNet flow logs cost storage per GB, with Traffic Analytics adding a processing charge.
Right-sizing: the free tools are always on once Network Watcher is enabled. Reserve Connection Monitor for paths whose failure is a real incident — app-to-database and app-to-critical-dependency hops — at a frequency matched to how fast you need to know (30–60 s for revenue paths, slower elsewhere), and keep flow logs on for audit but lifecycle-expire the storage. For a small estate, expect single-digit thousands of INR/month dominated by Log Analytics ingestion, not Network Watcher itself. To keep the observability bill in check, see Azure Monitor and Application Insights: Full-Stack Observability.
Interview & exam questions
Q1. What is the difference between IP Flow Verify and Next Hop? IP Flow Verify evaluates whether NSG rules allow or deny a specific 5-tuple and names the deciding rule (“is the firewall blocking this?”); Next Hop evaluates the route table to tell you where Azure sends a packet and names the route (“where does this packet go?”). One is about rules, the other routing — you often need both. (AZ-700, AZ-104.)
Q2. Next Hop returns a hop type of None. What does that mean and how do you fix it?
None means there is no route for that destination, so the packet is silently dropped — a black hole, not an NSG deny. The usual cause is a 0.0.0.0/0 UDR whose next hop points at a removed appliance IP; fix the UDR’s next-hop IP or add the missing route.
Q3. Why is a failed ping not proof of a network problem in Azure?
ping uses ICMP, which most NSGs and endpoints block by default, while the app uses TCP — so ICMP can fail while TCP on the app port succeeds. Always test the real protocol with Connection Troubleshoot over TCP.
Q4. Which Network Watcher tools require an agent on the VM, and which don’t? Connection Troubleshoot and Connection Monitor run an actual test from inside the VM, so they need the Network Watcher Agent extension. The control-plane tools (IP Flow Verify, Next Hop, Effective Routes/Rules) query Azure’s model and need no agent, working even when the VM is unreachable.
Q5. You added an allow rule but traffic is still denied. How do you find out why?
NSGs apply at both the subnet and the NIC, first-match-by-priority wins. Run Effective Security Rules (az network nic list-effective-nsg) to see the merged set — a higher-priority deny in the other NSG is likely beating your allow; re-prioritise or remove it.
Q6. When would you use Connection Monitor instead of Connection Troubleshoot? Connection Troubleshoot is a one-shot test for live diagnosis; Connection Monitor runs that test continuously, records loss/latency to Log Analytics, and alerts when reachability degrades. Use it to catch intermittent or off-hours failures and to baseline a path.
Q7. A private endpoint is reachable by IP but the app fails by hostname. What’s wrong?
The privatelink Private DNS zone isn’t linked to the VNet, so the FQDN resolves to the service’s public IP instead of the private endpoint’s private IP. Confirm with an FQDN-vs-IP test (or nslookup); fix by linking the privatelink.<service> zone to the VNet.
Q8. How does IP Flow Verify handle the case where no custom rule matches?
It falls through to the default rules and names the deciding one — e.g. DenyAllInBound (65500) for unsolicited inbound. If it names a default deny, the real problem is a missing explicit allow, not a wrong custom rule.
Q9. Connection Troubleshoot shows a hop ending at a VirtualAppliance with no further hops. What does that tell you?
Traffic is being forced through a firewall/NVA by a UDR, and the appliance dropped it or isn’t forwarding. Azure routing to the appliance is correct; the problem is the appliance’s own config — Network Watcher localised it to that hop for you.
Q10. What is the cost model for Network Watcher, at a high level? The control-plane tools are free and Connection Troubleshoot is billed trivially per check. The ongoing costs are Connection Monitor (per-test plus Log Analytics ingestion), Packet Capture (capture + storage), and flow logs (storage, plus Traffic Analytics if enabled).
Quick check
- Your VM can’t reach a SQL endpoint. Which single tool tells you in one run whether it’s the NSG, the route, or the listener — and roughly where it broke?
- Next Hop returns
Nonefor an internet destination. Is this an NSG deny or a routing problem, and what’s the usual cause? - You added an outbound allow rule but IP Flow Verify still says
Denyand names a rule you didn’t create with priority 200. What happened? - You need to know whether a path is failing intermittently at night. Which Network Watcher feature do you use, and where do its results go?
- A teammate says “the network is down —
pingfails.” Why might they be wrong, and how do you check properly?
Answers
- Connection Troubleshoot (
az network watcher test-connectivity) — it runs an end-to-end test from the source VM and returns a verdict plus a hop-by-hop list naming the failing hop (NSG rule, route, or closed port). You then drill in with IP Flow Verify or Next Hop. - A routing problem, not an NSG deny —
Nonemeans no route resolves the destination, so the packet is silently dropped. The usual cause is a0.0.0.0/0UDR whose next-hop appliance IP no longer exists (or a missing route). Fix the UDR. - A higher-priority deny (priority 200 beats your allow, since lower numbers win) is matching first. It likely lives in the other NSG (subnet vs NIC). Run Effective Security Rules to see the merged set and re-prioritise or remove the conflicting rule.
- Connection Monitor — it runs the reachability test continuously on a schedule, records loss/latency, and writes results to a Log Analytics workspace where you chart them and configure metric alerts.
pinguses ICMP, which is blocked by most NSGs and endpoints, so a failed ping proves nothing while the app’s TCP path may be fine. Check properly withtest-connectivity --protocol Tcp --dest-port <port>— test the protocol the app actually uses.
Glossary
- Network Watcher — Azure’s regional network-diagnostics service; hosts Connection Troubleshoot, Connection Monitor, IP Flow Verify, Next Hop, Effective Routes/Rules, Packet Capture and flow logs.
- Connection Troubleshoot — a one-shot reachability test run from a source VM to a destination IP/FQDN:port; returns a verdict and a hop-by-hop path naming the blocking hop.
- Connection Monitor — continuous, scheduled reachability testing with loss/latency recording, Log Analytics output, and metric alerts.
- IP Flow Verify — evaluates whether NSG rules allow or deny a specific 5-tuple and returns the name of the deciding rule.
- Next Hop — returns the route’s next-hop type (Internet, VnetLocal, VirtualAppliance, VirtualNetworkGateway, None, …) for a destination, plus the responsible route.
- Effective Security Rules — the merged, final NSG rule set Azure applies to a NIC (subnet NSG + NIC NSG + defaults).
- Effective Routes — the merged, final route table Azure applies to a NIC (system + UDR + BGP).
- NSG (Network Security Group) — a stateful set of allow/deny rules attached to a subnet and/or NIC, evaluated by priority with first-match-wins.
- UDR (User-Defined Route) — a custom route in a route table that overrides Azure’s default system routes to steer traffic to a chosen next hop.
- Next hop “None” — a route that resolves to no destination, silently dropping the packet — a black hole, distinct from an NSG deny.
- 5-tuple — source IP, source port, destination IP, destination port, and protocol — the flow definition NSG evaluates and IP Flow Verify tests.
- SNAT (Source NAT) — translation of outbound connections to a shared public IP using a finite port pool; exhaustion causes under-load outbound failures.
- Network Watcher Agent — the VM extension that lets Connection Troubleshoot and Connection Monitor run an actual test from inside the source VM.
- NetworkWatcherRG — the auto-created resource group that holds the per-region Network Watcher instances; deleting it disables the service.
Next steps
- Go deeper on the gates themselves in Diagnosing Azure VNet Connectivity: NSGs, UDRs, Effective Routes & Network Watcher.
- Master the rules IP Flow Verify reports in Azure NSG Rules Explained: Priorities, Default Rules and Augmented Security Rules for Beginners.
- Understand the routing Next Hop reveals in User-Defined Routes and Route Tables: Steering Azure Traffic the Way You Intend.
- Fix the DNS-and-private-IP cause behind name-resolution failures in Azure Private Endpoint vs Service Endpoint: Secure PaaS Access.
- Solve outbound SNAT pressure for good with How to Deploy Azure NAT Gateway for Predictable Outbound Connectivity.