The alarm you built six months ago did not page anyone last night, and the service was down for forty minutes. Or the opposite: an alarm has been screaming ALARM in a red dashboard tile for three days while every graph under it is flat and green, and nobody trusts the page anymore. Both are the same bug wearing two masks — a CloudWatch alarm whose evaluation does not match reality — and both come from a tiny set of very specific, very diagnosable causes. The skill is not “look at the alarm and see if it’s red.” The skill is knowing that an alarm is a pipeline — a metric identified by an exact dimension set, aggregated by a statistic over a period, evaluated M-of-N, gap-filled by a missing-data rule, resolved to a state, and only then wired to an action — and knowing the one describe-alarms field or get-metric-data result that proves which hop broke.
Most “the alarm didn’t fire” tickets are not subtle. They are a dimension set that is off by one key so get-metric-data returns an empty array; a TreatMissingData set to notBreaching on a heartbeat metric so a dead process resolves to green; a Period of 60 seconds on an EC2 basic-monitoring metric that only publishes every 300, so the alarm lives in INSUFFICIENT_DATA; an Average statistic that smooths a single pegged host down below the threshold; or an SNS subscription that has said PendingConfirmation since the day it was created. Each of these throws no exception. Each looks, at a glance, like a correctly configured alarm. And each has an exact confirming command.
This is the reference you keep open during the incident. It treats the alarm as the pipeline it is and walks every failure class in order: the three states and what each really means, the M-of-N evaluation math people misread, the TreatMissingData matrix that is the number-one reason an alarm won’t fire or won’t clear, the INSUFFICIENT_DATA catalog, the silent dimension mismatch = no data trap, statistic and period smoothing, percentiles / anomaly-detection / metric-math alarms, the “it alarmed but nothing happened” action failures, and the stuck-in-ALARM case. The heart of the article is a # → symptom → root cause → confirm → fix master table you can run under pressure, a TreatMissingData behavior matrix, and an M-of-N reference. Everything is shown in both aws CLI and Terraform, with real states, fields and defaults — never a hand-waved number. It maps directly to the monitoring and troubleshooting domains of SOA-C02, SAA-C03 and DVA-C02.
What problem this solves
An alarm exists for exactly one reason: to convert a metric threshold crossing into an action — a page, an email, a scale-out, an EC2 recovery — reliably, and only when it should. The failure modes are therefore of two kinds, and both are expensive:
- False negatives (won’t fire): the thing you built the alarm for happened and the alarm stayed
OKor sat inINSUFFICIENT_DATA. This is the outage that runs long because nobody was told. It is caused by a metric that never matched (dimension mismatch), a statistic that smoothed the event away, aTreatMissingDatarule that forced green, a threshold or M-of-N that never crossed, or an action that was never wired. - False positives and stuck states (fires wrong): the alarm fired when nothing was wrong, or it has been red for days. This erodes trust until people mute the page — and a muted page is the same as no page. It is caused by
breaching-on-gaps, a too-sensitive 1-of-1, a metric that stopped publishing whileTreatMissingData=missing, or a percentile on a pre-aggregated metric.
Who hits this: anyone who owns monitoring. The SRE who inherits 400 alarms and cannot tell which are load-bearing. The developer who “added an alarm” in the console and never confirmed the SNS subscription. The platform team whose Terraform sets treat_missing_data to the wrong string. The on-call engineer at 3 a.m. staring at a green alarm over a dead service. The cost of getting this wrong is not a CloudWatch bill — it is the outage the alarm was supposed to catch, and the trust it burns when it cries wolf.
Learning objectives
By the end of this article you can:
- Name the three alarm states —
OK,ALARM,INSUFFICIENT_DATA— and say exactly what each means and what fires on entry to each. - Read the M-of-N evaluation (
EvaluationPeriods= N,DatapointsToAlarm= M) and compute an alarm’s true reaction time asPeriod × N. - Apply the
TreatMissingDatamatrix (missing,notBreaching,breaching,ignore) deliberately, and diagnose the #1 “won’t fire / won’t clear” cause from it. - Confirm a dimension mismatch in one command —
get-metric-datareturns an emptyValuesarray — and fix it fromlist-metrics. - Diagnose statistic/period smoothing by re-querying the same window with
Maximum/p99and a shorter period. - Trace an unfired action —
PendingConfirmationSNS subscription, a blocking topic policy,ActionsEnabled=false, a stale action ARN. - Resolve a stuck-in-
ALARMalarm by correlating a dead metric with theTreatMissingDatasetting. - Build, break, diagnose and fix an alarm end to end in a free-tier lab, in both aws CLI and Terraform, then tear it down.
Prerequisites & where this fits
You should be comfortable with the AWS CLI and an IAM identity that can call cloudwatch:* and sns:* in a sandbox account, and you should know what a metric is (a namespace like AWS/EC2, a name like CPUUtilization, a set of dimensions like InstanceId=i-0abc, and a time series of datapoints). You should have written at least one alarm before — this article assumes you know what a threshold is and are here because one is misbehaving.
Where this sits: alarms are the decision layer of observability. Below them are metrics (emitted by services or your code via PutMetricData) and logs (from which you can extract metric filters). Above them are actions — SNS fan-out to email/Slack/PagerDuty, Auto Scaling policies, EC2 recovery, Systems Manager OpsItems. This article is the troubleshooting companion to building metrics and dashboards (see CloudWatch metrics, alarms & dashboards hands-on), to querying logs (see CloudWatch Logs Insights querying hands-on), to the SNS layer the actions land on (see SNS topics, fan-out & subscriptions hands-on), and it is the deep-dive behind the “alarm never fires” hop of why EC2 Auto Scaling won’t scale.
Core concepts
An alarm watches one thing: either a single metric, or a single metric-math expression (which may combine many metrics, including an anomaly-detection band). Everything else is how that one thing is fetched, aggregated, and judged. Internalise this pipeline and every failure has an address.
| Stage | What it does | Configured by | Where it breaks |
|---|---|---|---|
| Identify | Pin down which series: namespace + metric name + exact dimension set | Namespace, MetricName, Dimensions |
Dimension mismatch → empty series → no data (badge 1) |
| Aggregate | Collapse each period’s raw datapoints into one number | Statistic or ExtendedStatistic, Period |
Average smooths a spike; period longer than the event (badge 2) |
| Evaluate | Judge each period breaching vs not, across a window | ComparisonOperator, Threshold, EvaluationPeriods (N), DatapointsToAlarm (M) |
M-of-N misread → late/flappy (badge 3) |
| Gap-fill | Decide what a missing period counts as | TreatMissingData |
Wrong rule → won’t fire or won’t clear (badge 4) |
| Resolve | Produce a state | (output) OK / ALARM / INSUFFICIENT_DATA |
Empty window → INSUFFICIENT_DATA; dead metric → stuck (badge 5) |
| Act | Fire actions on state change | AlarmActions, OKActions, InsufficientDataActions, ActionsEnabled |
Unconfirmed SNS, bad ARN, actions disabled (badge 6) |
Two facts about this pipeline trip up almost everyone:
- An alarm fetches by an exact key. If the namespace, metric name, or any dimension key/value does not match a metric that is actually being published — including case and whitespace — CloudWatch does not error. It fetches an empty series. An empty series has no breaching datapoints, so the alarm never enters
ALARM; it sits inINSUFFICIENT_DATA(or whereverTreatMissingDataputs it). This is the single most common “why didn’t it fire” cause and it is invisible in the console. - Actions fire on state transition, not on state. An alarm that is already in
ALARMwhen you attach an action does not re-fire. Actions fire when the state changes (OK → ALARM,ALARM → OK, or intoINSUFFICIENT_DATAif you wired that). This is why “I attached the SNS topic but got no email” is often “the alarm was already red.”
The three states
| State | Meaning | Fires (on entry) | The trap |
|---|---|---|---|
OK |
The metric is inside the threshold across the evaluation window | OKActions (often unset) |
Nobody sets OKActions, so recovery is silent |
ALARM |
The threshold was breached for M of the last N periods | AlarmActions |
Fires only on the transition into ALARM, not while it stays there |
INSUFFICIENT_DATA |
Not enough datapoints in the window to judge (or the alarm was just created) | InsufficientDataActions (usually unset) |
The default home of a dimension mismatch or a period-too-short bug — and it looks “not-red,” so it hides |
A newly created alarm always starts in INSUFFICIENT_DATA until it has evaluated enough periods. That is normal for the first minutes. It is not normal an hour later — an alarm that lives in INSUFFICIENT_DATA permanently is one of the loudest signals in this whole article.
The full configuration reference
Every one of these knobs is a place the alarm can be “correct” and still wrong. This is the table you scan when someone says “the config looks fine.”
| Setting | CLI flag | Values | Default | When to change | Gotcha |
|---|---|---|---|---|---|
| Namespace | --namespace |
e.g. AWS/EC2, AWS/ApplicationELB, custom |
— | Always set | Custom namespaces are case-sensitive and easy to typo |
| Metric name | --metric-name |
e.g. CPUUtilization |
— | Always set | Wrong name = empty series, no error |
| Dimensions | --dimensions |
Name=…,Value=… list |
none | To pin one resource | Must match published set exactly and completely |
| Statistic | --statistic |
SampleCount Average Sum Minimum Maximum |
— | Per what you measure | Average hides spikes; Sum scales with traffic |
| Extended statistic | --extended-statistic |
p90 p99 p99.9 tm99 etc. |
— | Latency/tail | Meaningless on a metric that is already an average |
| Period | --period |
10, 30, or multiple of 60 (s) | — | Match publish rate | Must be ≥ the metric’s publish interval |
| Comparison | --comparison-operator |
GreaterThanThreshold, ≥, <, ≤, plus 3 anomaly ops |
— | Per direction | > vs ≥ matters at the exact boundary |
| Threshold | --threshold |
number | — | Per SLO | Ignored when using an anomaly band (use --threshold-metric-id) |
| Evaluation periods (N) | --evaluation-periods |
integer ≥ 1 | — | Reaction-time budget | Period × N is your true latency to page |
| Datapoints to alarm (M) | --datapoints-to-alarm |
1 ≤ M ≤ N | equals N | To ride out noise | Omitting it means M = N (all N must breach) |
| Missing data | --treat-missing-data |
missing notBreaching breaching ignore |
missing |
Per metric gappiness | The #1 won’t-fire / won’t-clear cause |
| Actions enabled | --actions-enabled / --no-actions-enabled |
true/false | true | To silence temporarily | Left false = a perfectly evaluating alarm that never acts |
| Alarm actions | --alarm-actions |
ARN list | none | Always, for a real alarm | An alarm with no actions is a dashboard colour, not a page |
| OK actions | --ok-actions |
ARN list | none | For “recovered” notices | Unset = silent recovery |
| Insufficient-data actions | --insufficient-data-actions |
ARN list | none | To catch dead metrics | Unset = a dead metric is silent |
The same setting has three different names depending on where you touch it — a frequent source of “the docs say X but my Terraform wants Y” confusion. Keep this mapping handy:
| Concept | Console label | aws CLI flag | Terraform argument |
|---|---|---|---|
| N (window) | “Evaluation periods” | --evaluation-periods |
evaluation_periods |
| M (breaching count) | “Datapoints to alarm” | --datapoints-to-alarm |
datapoints_to_alarm |
| Missing-data rule | “Treat missing data as” | --treat-missing-data |
treat_missing_data |
| Statistic | “Statistic” | --statistic |
statistic |
| Percentile | “Statistic” (custom) | --extended-statistic |
extended_statistic |
| Notify target | “Notification” | --alarm-actions |
alarm_actions |
| Recovery notify | “OK action” | --ok-actions |
ok_actions |
| Enable/disable | (toggle) | --actions-enabled |
actions_enabled |
The alarm state machine and the M-of-N evaluation
EvaluationPeriods (N) and DatapointsToAlarm (M) are the two most misread numbers in CloudWatch. The rule is simple once stated precisely: CloudWatch looks at the most recent N periods and enters ALARM if at least M of them are breaching. M defaults to N (all of them). Your reaction time — worst-case delay from “the problem starts” to “the alarm fires” — is Period × N, plus up to one period of publish/evaluation lag.
| N (eval periods) | M (datapoints) | Period | Reaction time (≈ Period × N) | Behaviour |
|---|---|---|---|---|
| 1 | 1 | 60s | ~1 min | Fires on a single breaching minute — sensitive, flappy |
| 3 | 3 | 60s | ~3 min | Fires only after 3 straight breaching minutes — steady |
| 3 | 2 | 60s | ~3 min | Fires if 2 of any 3 recent minutes breach — rides out one blip |
| 5 | 3 | 60s | ~5 min | “3 of 5” — classic noise-tolerant page |
| 2 | 2 | 300s | ~10 min | Slow; fine for a daily-ish metric, terrible for latency |
| 15 | 3 | 60s | up to 15 min | Waits far too long; a common “fires late” mistake |
| 1 | 1 | 10s | ~10s | High-resolution alarm (custom high-res metric only) |
The comparison operator decides what “breaching” means, and the three anomaly operators are a different family entirely — mixing them up is a common “why won’t it fire” cause. The choice of > vs ≥ matters at the exact boundary value.
| Comparison operator | Alarm breaches when | Use for |
|---|---|---|
GreaterThanThreshold |
value > threshold | CPU/latency/error ceilings |
GreaterThanOrEqualToThreshold |
value ≥ threshold | Inclusive ceilings (e.g. ≥ 100%) |
LessThanThreshold |
value < threshold | Floors (healthy-host count, throughput) |
LessThanOrEqualToThreshold |
value ≤ threshold | Inclusive floors (e.g. ≤ 0 heartbeats) |
GreaterThanUpperThreshold |
value above the anomaly band | Anomaly: only high side is bad |
LessThanLowerThreshold |
value below the anomaly band | Anomaly: only low side is bad |
LessThanLowerOrGreaterThanUpperThreshold |
value outside the band either way | Anomaly: any deviation is bad |
M-of-N is how you trade sensitivity against noise tolerance. 1-of-1 fires fastest and flaps most. M = N (say 3-of-3) requires a sustained breach and rides out single-datapoint spikes but is slower. M < N (say 3-of-5) is the sweet spot for most fleet metrics: it fires on a real trend but ignores one noisy reading. The classic mistakes are (a) leaving EvaluationPeriods high “to be safe,” which turns a 1-minute metric into a 15-minute page, and (b) using 1-of-1 on a naturally spiky metric, which pages on every transient.
One subtlety that causes “it fired earlier than my window should allow”: when some datapoints in the window are missing, CloudWatch does not simply wait. Depending on TreatMissingData, it may evaluate on the real datapoints it has, and it can reach back beyond the nominal window (the evaluation range) to find enough real datapoints to make a decision — which is exactly why the missing-data rule and M-of-N interact, and why the next section is the most important in the article.
Field in describe-alarms |
Tells you | Read it when |
|---|---|---|
StateValue |
Current state | Always first |
StateReason |
Human sentence explaining the current state | “why is it here” |
StateReasonData |
JSON with evaluatedDatapoints, threshold, startDate |
Prove M-of-N and see the actual values |
StateUpdatedTimestamp |
When it last transitioned | “is it stuck?” |
EvaluationPeriods / DatapointsToAlarm |
N and M | Reaction-time + flappiness |
Period |
Aggregation period | Compare to publish interval |
Statistic / ExtendedStatistic |
Aggregation | Smoothing diagnosis |
Dimensions |
The exact fetch key | Dimension-mismatch diagnosis |
TreatMissingData |
Gap rule | Won’t-fire/clear diagnosis |
ActionsEnabled / AlarmActions |
Whether/where it acts | “it alarmed but nothing happened” |
When describe-alarms shows the current state but you need the timeline — did it flap, did someone reconfigure it, did an action fire — reach for aws cloudwatch describe-alarm-history. Its HistoryItemType tells you what kind of event each entry is:
HistoryItemType |
Meaning | Use it to answer |
|---|---|---|
StateUpdate |
The alarm transitioned between states | “When did it go ALARM? Is it flapping?” |
Action |
An action (SNS/ASG/EC2) was invoked | “Did the notification actually fire?” |
ConfigurationUpdate |
Someone changed the alarm’s config | “Who broke it / when did the dims change?” |
TreatMissingData — the #1 reason it won’t fire (or won’t clear)
Real metrics have gaps. A Lambda that isn’t invoked emits no Errors datapoints. An SQS queue that’s empty may not emit. A host that died stops emitting entirely. TreatMissingData tells CloudWatch what a missing period counts as during evaluation, and choosing it wrong is the single most common reason an alarm behaves backwards. Memorise this matrix — it is the centre of gravity of the whole topic.
TreatMissingData |
A missing period is treated as… | Effect when data goes missing | Use it for | The danger |
|---|---|---|---|---|
missing (default) |
neither breaching nor OK — ignored, and if all periods are missing the alarm goes INSUFFICIENT_DATA |
Holds the last known state; all-missing → INSUFFICIENT_DATA |
Metrics that are normally continuous | A dead resource holds ALARM forever (stuck) or holds OK and never pages |
notBreaching |
good / under threshold | Missing data pushes toward / holds OK |
Naturally gappy “bad-event” metrics (e.g. 4xx, Errors) |
A resource that stopped emitting looks healthy — silent death |
breaching |
bad / over threshold | Missing data pushes toward / holds ALARM |
Heartbeats that must keep reporting | A gappy-but-fine metric pages constantly |
ignore |
not counted; state is not changed by gaps | Freezes the current state until real data returns | When you never want gaps to move the needle | Can mask a genuinely dead metric indefinitely |
Read the matrix through the two symptoms:
- “It won’t fire.” The metric went missing (the process crashed, the emitter stopped) and you set
notBreaching— so CloudWatch treated the silence as “everything’s fine” and heldOK. For anything that is supposed to keep emitting (a health heartbeat, a synthetic canary, a cron that pushes a “success” metric), missing data is bad news, and you wantbreaching. - “It won’t clear.” The alarm went
ALARM, then the metric stopped publishing (often because of the same incident), and you left the defaultmissing. Withmissing, CloudWatch holds the last state — so it stays red forever even after you fixed the service, because there are no new datapoints to move it back toOK. Restore the metric, or choosenotBreaching/ignoredeliberately.
| If you want a gap to mean… | Set TreatMissingData to |
Example metric |
|---|---|---|
| “Missing = the thing is broken, page me” | breaching |
Heartbeat, synthetic canary, HealthyHostCount |
| “Missing = quiet period, all good” | notBreaching |
4xxErrorRate, Errors, ThrottledRequests |
| “Missing = don’t touch my state” | ignore |
Manually managed alarms; noisy sensors |
| “Missing = hold last state / go unknown if all gone” | missing (default) |
Continuous, always-on metrics only |
The Terraform argument is treat_missing_data and it takes the same four strings — and yes, they are camelCase inside a string, which is a frequent silent typo (notbreaching or not_breaching are not valid and Terraform will reject them, but people copy the wrong casing from memory).
resource "aws_cloudwatch_metric_alarm" "heartbeat" {
  alarm_name          = "prod-worker-heartbeat-missing"
  namespace           = "Custom/Worker"
  metric_name         = "Heartbeat"
  dimensions          = { WorkerGroup = "billing" }
  statistic           = "Sum"
  period              = 60
  evaluation_periods  = 3
  datapoints_to_alarm = 3
  comparison_operator = "LessThanThreshold"
  threshold           = 1
  treat_missing_data  = "breaching" # a silent worker = page, do NOT let it read as OK
  alarm_actions       = [aws_sns_topic.pages.arn]
  ok_actions          = [aws_sns_topic.pages.arn]
}
INSUFFICIENT_DATA — the empty-window catalog
INSUFFICIENT_DATA means “I could not find enough datapoints in the evaluation window to make a call.” For the first few minutes of a new alarm this is normal. Persistently, it is a defect — and it has a short list of causes.
| # | Cause | Why it produces no datapoints | Confirm | Fix |
|---|---|---|---|---|
| 1 | Dimension mismatch | Fetch key matches no published metric | get-metric-data with the alarm’s dims → Values: [] |
Copy exact dims from list-metrics |
| 2 | Period < publish interval | e.g. Period=60 on EC2 basic (publishes every 300s) → most periods empty |
Compare Period to the metric’s cadence |
Set Period ≥ 300, or enable detailed monitoring |
| 3 | Resource stopped emitting | Instance stopped, function idle, queue deleted | get-metric-data shows data then a flatline of gaps |
Restore the emitter; pick the right TreatMissingData |
| 4 | Sparse / event-driven metric | Metric only exists when the event happens (Errors, 4xx) |
list-metrics shows it exists but datapoints are rare |
TreatMissingData=notBreaching; alarm on a rate over a longer period |
| 5 | High-res vs standard mismatch | Period=10/30 on a standard (60s) metric |
Period is 10 or 30 but metric is standard resolution |
Use Period≥60 for standard metrics |
| 6 | Wrong namespace/metric name | Typo → empty series | describe-alarms namespace/name vs list-metrics |
Fix the string |
| 7 | Metric in another region/account | Alarm looks in the wrong place | Region of alarm vs where metric is published | Create the alarm in the metric’s region, or use cross-account |
| 8 | Brand-new alarm | Not enough periods evaluated yet | StateUpdatedTimestamp is seconds ago |
Wait Period × N; it’s fine |
The interaction to remember: an alarm with a dimension mismatch (#1) or a too-short period (#2) will sit in INSUFFICIENT_DATA under the default missing — but if you set TreatMissingData=notBreaching on top of the bug, it will sit in a confident, wrong OK instead, which is far more dangerous because it looks healthy. A permanent INSUFFICIENT_DATA is at least honest; a bug hidden under notBreaching is a silent outage waiting to happen.
The most preventable cause on that list is #2 — a Period shorter than the metric’s publish interval. You cannot alarm faster than the source emits. Know the cadence of what you’re watching:
| Metric source | Default publish interval | Alarm Period floor |
|---|---|---|
| EC2 basic monitoring | 300s (5 min) | 300s (or enable detailed) |
| EC2 detailed monitoring | 60s (1 min) | 60s |
| ELB / ALB / NLB | 60s | 60s |
| Lambda, SQS, DynamoDB, API Gateway | 60s | 60s |
| RDS basic | 60s | 60s |
| Custom metric (standard resolution) | whatever you push | 60s |
| Custom metric (high resolution) | 1s (StorageResolution=1) | 10s or 30s |
| EBS (standard) | 300s | 300s |
Dimension mismatch = no data (the silent classic)
This deserves its own section because it is the failure that fools the most people and shows the fewest symptoms. An alarm fetches a metric by its complete dimension set. If that set does not exactly match a published metric, CloudWatch returns an empty series — no error, no warning, nothing red.
The ways to get the dimensions wrong are all quiet:
| Mistake | Example | Result |
|---|---|---|
| Missing a required dimension | Alarm on AWS/ApplicationELB RequestCount with only LoadBalancer but the metric is published per LoadBalancer and TargetGroup |
Empty (the published series has both) |
| Extra dimension not in the published set | Adding AvailabilityZone to a metric published without it |
Empty (metrics are keyed by the exact set) |
| Wrong value | InstanceId=i-0abc when the real id is i-0abcd, or a stale id after a redeploy |
Empty |
| Case / whitespace | Environment=Prod vs published Environment=prod |
Empty |
| Wrong dimension name | FunctionName vs the correct Resource for a Lambda per-version metric |
Empty |
| Aggregated vs per-resource | Alarming on a per-instance dimension when only the ASG-aggregate is published (or vice versa) | Empty |
| Autoscaled/ephemeral id | Dimension pinned to an instance id that no longer exists | Empty after the instance is replaced |
Because metrics are identified by the full, exact set of dimensions, “more specific” is not “a subset.” RequestCount for {LoadBalancer=app/x} and RequestCount for {LoadBalancer=app/x, TargetGroup=tg/y} are two different metrics. Alarming on the first when only the second is published gives you an empty series forever.
The confirmation is one command, and it is the most important diagnostic in this article. Take the alarm’s exact dimensions and ask get-metric-data for them:
aws cloudwatch get-metric-data \
  --metric-data-queries '[{
    "Id":"m1",
    "MetricStat":{
      "Metric":{
        "Namespace":"AWS/ApplicationELB",
        "MetricName":"HTTPCode_Target_5XX_Count",
        "Dimensions":[{"Name":"LoadBalancer","Value":"app/my-alb/50dc6c495c0c9188"}]
      },
      "Period":60,"Stat":"Sum"
    },"ReturnData":true
  }]' \
  --start-time "$(date -u -v-30M +%Y-%m-%dT%H:%M:%SZ)" \
  --end-time   "$(date -u +%Y-%m-%dT%H:%M:%SZ)"
If the response has "Values": [] (empty) while you know the load balancer is serving 5xxs, the dimension set is wrong — full stop. Now ask CloudWatch what dimensions the metric is actually published with:
aws cloudwatch list-metrics \
  --namespace AWS/ApplicationELB \
  --metric-name HTTPCode_Target_5XX_Count
The output enumerates every real dimension combination. Copy one verbatim — every Name, every Value, exact case — into the alarm. The fix is always “make the alarm’s dimensions identical to a row that list-metrics actually returns.”
| Namespace | Common metric | Dimension set that actually exists |
|---|---|---|
AWS/EC2 |
CPUUtilization |
InstanceId; or AutoScalingGroupName; or none (account-wide is not published) |
AWS/ApplicationELB |
HTTPCode_Target_5XX_Count |
LoadBalancer; or LoadBalancer+TargetGroup; or LoadBalancer+AvailabilityZone |
AWS/Lambda |
Errors |
FunctionName; or FunctionName+Resource (alias/version); or none (aggregate) |
AWS/SQS |
ApproximateNumberOfMessagesVisible |
QueueName |
AWS/RDS |
CPUUtilization |
DBInstanceIdentifier; or DBClusterIdentifier |
AWS/DynamoDB |
ThrottledRequests |
TableName; or TableName+Operation |
AWS/ApiGateway |
5XXError |
ApiName; or ApiName+Stage+Method+Resource |
| Custom | your metric | whatever you passed to PutMetricData — check it |
Learn to read what get-metric-data hands back — the shape of the result tells you which hop is broken:
get-metric-data result |
Means | Next step |
|---|---|---|
Values: [] (empty) |
Dimensions/namespace/name match no metric, or wrong region | list-metrics; copy the real dimension set |
Values present, none cross threshold under Average |
Statistic is smoothing the event | Re-query with Stat=Maximum / p99 |
Values cross under Maximum but not Average |
Confirmed smoothing miss | Alarm on Maximum/p99 |
| Values present but sparse (gaps) | Event-driven/sparse metric | Fix TreatMissingData; longer period |
StatusCode: PartialData |
The window is still being aggregated | Widen the time range; retry |
| Values stop at a timestamp, then nothing | Emitter died at that time | Correlate with the incident; restore it |
Statistic and period smoothing — the spike that never crosses
An alarm can have perfect dimensions, the right threshold, and still never fire because the statistic and period averaged the event out of existence. This is the second-nastiest failure and the one that most often produces “but the graph clearly shows a spike!”
The mechanism: a statistic collapses every raw datapoint in a period into one number. If you alarm on Average over a 5-minute period, a single host pegged at 100% for 30 seconds inside a fleet of twenty averages to a couple of percent — nowhere near the threshold. The spike is real; the aggregate hides it.
| Statistic | What it reports | Hides | Reveals | Alarm on it when |
|---|---|---|---|---|
Average |
Mean across the period | Spikes, single hot resources | Steady-state load | You care about sustained average, not peaks |
Maximum |
Highest datapoint in the period | Nothing (it’s the peak) | Any single spike | You care about “did anything peg” |
Minimum |
Lowest datapoint | Peaks | Floors (e.g. healthy-host floor) | “Did we drop below a floor” |
Sum |
Total across the period | Per-request detail | Throughput/volume | Counting events (requests, errors, invocations) |
SampleCount |
Number of datapoints | Values entirely | Whether data even flowed | Detecting emission gaps |
p90/p99/p99.9 |
Tail latency | The mean | The bad tail | Latency SLOs — the tail is the user pain |
Period is the twin knob. Even Maximum over a 15-minute period reports the max of 15 minutes; if you need to catch a 90-second event, a 15-minute period is too coarse. Match the period to the duration of the thing you’re catching and to the metric’s publish rate.
| Symptom | Likely statistic/period cause | Fix |
|---|---|---|
| “One host is pegged but no alarm” | Average over the fleet |
Alarm on Maximum, or per-instance, or p99 |
| “Latency spikes for users, alarm quiet” | Average latency hides the tail |
Alarm on p99/p99.9 |
| “Brief error burst, never fired” | Period too long averaged it out |
Shorten Period to 60s; use Sum |
| “Alarm reacts but way too slowly” | Long Period × N |
Shorten period and/or EvaluationPeriods |
| “Fleet is fine on average, one node dying” | Aggregate metric | Alarm per-resource or on Minimum of healthy count |
There is a related, subtler trap: percentiles on a metric that is already aggregated. If a service publishes a pre-computed Average latency (a single value per period, not a distribution), asking for p99 of it is meaningless — CloudWatch can only compute percentiles from metrics that carry the underlying sample distribution (StatisticValues or raw values). Percentiles are correct on AWS/ApplicationELB TargetResponseTime (distribution-backed) and nonsense on a home-grown metric you published as one averaged number per minute.
Percentiles, anomaly detection, and metric-math alarms
Beyond static thresholds, three alarm styles have their own failure modes.
Percentile availability. For high-traffic metrics, CloudWatch may return percentiles based on a sample rather than 100% of datapoints unless you set the alarm’s EvaluateLowSampleCountPercentile. If a period has very few samples, a p99 can be statistically noisy; the setting evaluate vs ignore decides whether the alarm evaluates or holds state on low samples.
| Setting | Value | Effect |
|---|---|---|
EvaluateLowSampleCountPercentile |
evaluate (default) |
Always evaluate the percentile, even on few samples |
EvaluateLowSampleCountPercentile |
ignore |
Don’t change state when the sample count is too low (avoids noisy pages) |
Anomaly-detection alarms don’t use a numeric Threshold — they compare the metric against a trained band ANOMALY_DETECTION_BAND(m1, 2) (the 2 is the band width in standard deviations). The alarm’s comparison operator must be one of the anomaly operators, and you point it at the band with --threshold-metric-id, not --threshold.
| Anomaly config item | Correct value | Common mistake |
|---|---|---|
| Comparison operator | LessThanLowerOrGreaterThanUpperThreshold (or …UpperThreshold / …LowerThreshold) |
Using GreaterThanThreshold (a static op) |
| Band reference | --threshold-metric-id ad1 pointing at ANOMALY_DETECTION_BAND(m1,2) |
Also setting --threshold (ignored/invalid) |
| Band width | The 2 in the expression |
Too tight (band ≈ 1) → constant false alarms |
| Training time | Needs history to learn the pattern | Alarming immediately → weird bands until trained |
Metric-math alarms evaluate an expression (e.g. an error rate = errors / requests * 100). The one gotcha that breaks them: exactly one entry in the Metrics array must have ReturnData=true — the expression you’re alarming on — and the raw inputs must have ReturnData=false. Get that wrong and the alarm has nothing to evaluate.
| Metric-math element | Requirement | Failure if wrong |
|---|---|---|
| The expression to alarm on | ReturnData: true, has Expression |
No true → “must specify exactly one” error |
| Raw input metrics | ReturnData: false, have MetricStat |
Multiple true → ambiguous, rejected |
Ids |
Unique, [a-z][a-zA-Z0-9_]* |
Bad id → validation error |
| Period alignment | Inputs and expression share a period | Mismatch → gaps in the expression series |
The alarm fired but nothing happened — action failures
Half of all “the alarm didn’t work” tickets are not evaluation bugs at all — the alarm correctly went to ALARM, and the action failed. The state machine did its job; the wiring downstream didn’t.
| # | Symptom | Root cause | Confirm | Fix |
|---|---|---|---|---|
| 1 | State went ALARM, no email |
SNS subscription still PendingConfirmation |
aws sns list-subscriptions-by-topic → SubscriptionArn: PendingConfirmation |
Click the confirmation link; re-subscribe and confirm |
| 2 | Nothing acts, ever | ActionsEnabled=false |
describe-alarms → ActionsEnabled: false |
Set --actions-enabled / actions_enabled = true |
| 3 | No email, subscription confirmed | Topic policy denies cloudwatch.amazonaws.com |
aws sns get-topic-attributes → inspect Policy |
Add a statement allowing SNS:Publish from CloudWatch |
| 4 | Cross-account alarm can’t notify | Topic policy doesn’t allow the alarm’s account | get-topic-attributes Policy principals |
Add the source account/ARN to the topic policy |
| 5 | ASG doesn’t scale on alarm | Stale/incorrect scaling-policy ARN | describe-alarms AlarmActions vs describe-policies |
Re-put the policy; update the action ARN |
| 6 | EC2 recover/stop didn’t happen | Wrong arn:aws:automate:… action or missing permissions |
AlarmActions string; the account’s default role |
Use arn:aws:automate:<region>:ec2:recover (correct verb) |
| 7 | Email once, never again | Actions fire on transition, not while ALARM |
describe-alarm-history shows one transition |
Expected — add re-notification via EventBridge if needed |
| 8 | Recovery never announced | OKActions unset |
describe-alarms → empty OKActions |
Add the SNS topic to --ok-actions too |
| 9 | Slack/PagerDuty silent, email works | The HTTPS/Lambda subscription is broken, not the alarm | SNS delivery status logs / CloudWatch NumberOfNotificationsFailed |
Fix the endpoint; enable SNS delivery-status logging |
| 10 | “It alarmed” but you set it via console test | set-alarm-state fires actions once, then real eval overrides |
describe-alarm-history |
Expected; use it only to test the wiring |
The confirmation flow for the number-one cause (unconfirmed subscription) is worth committing to muscle memory:
# 1. Is the subscription actually confirmed?
aws sns list-subscriptions-by-topic --topic-arn arn:aws:sns:ap-south-1:111122223333:alarms
# Look for "SubscriptionArn": "PendingConfirmation"  <-- the bug

# 2. Prove the alarm itself is wired and enabled
aws cloudwatch describe-alarms --alarm-names prod-5xx \
  --query 'MetricAlarms[0].{state:StateValue,enabled:ActionsEnabled,actions:AlarmActions}'

# 3. Fire the wiring on purpose to test end-to-end (temporary; next real eval overrides)
aws cloudwatch set-alarm-state --alarm-name prod-5xx \
  --state-value ALARM --state-reason "wiring test"
The SNS topic policy that lets CloudWatch publish (needed especially for cross-account, and a common omission) looks like this in Terraform:
data "aws_iam_policy_document" "allow_cw" {
  statement {
    actions   = ["SNS:Publish"]
    resources = [aws_sns_topic.alarms.arn]
    principals {
      type        = "Service"
      identifiers = ["cloudwatch.amazonaws.com"]
    }
    # For cross-account, scope to the alarm's account/ARN:
    condition {
      test     = "ArnLike"
      variable = "aws:SourceArn"
      values   = ["arn:aws:cloudwatch:ap-south-1:111122223333:alarm:*"]
    }
  }
}

resource "aws_sns_topic_policy" "alarms" {
  arn    = aws_sns_topic.alarms.arn
  policy = data.aws_iam_policy_document.allow_cw.json
}
Stuck in ALARM — a dead metric plus the wrong missing-data rule
An alarm that has been red for days over a flat, green metric is almost always this: the metric stopped publishing while TreatMissingData was left at the default missing. With missing, CloudWatch holds the last state when there’s no new data — so an alarm that happened to be in ALARM when the metric died stays in ALARM indefinitely. There are no new datapoints to move it back to OK. The fix is either to restore the metric source (the right long-term fix) or to choose a missing-data rule that resolves a dead metric the way you want.
| Stuck symptom | Root cause | Confirm | Fix |
|---|---|---|---|
ALARM for days, graph flat/empty |
Metric stopped; TreatMissingData=missing holds last state |
get-metric-data empty for recent periods; StateReason mentions missing datapoints |
Restore emitter; or set notBreaching/ignore per intent |
ALARM after resource deleted |
Alarm outlived its resource; dimension now matches nothing | list-metrics no longer lists the dimension |
Delete the alarm, or re-point it |
Won’t go back to OK after fix |
Fixed metric publishes again but under a new dimension (new instance id) | list-metrics shows a new id |
Alarm on the ASG-aggregate or a stable dimension, not an ephemeral id |
INSUFFICIENT_DATA forever |
Period < publish interval / dimension mismatch | Compare period to cadence; get-metric-data empty |
Fix period or dimensions |
Flaps ALARM↔INSUFFICIENT_DATA |
Sparse metric under missing |
Datapoints appear/vanish | notBreaching (if gaps are fine) or a longer period |
| Cleared in console, comes back red | Underlying condition still true; you only changed state manually | describe-alarm-history shows re-entry |
Fix the real condition; manual set-alarm-state is temporary |
Composite alarms and cross-account/region
Composite alarms combine child alarms with a boolean AlarmRule using ALARM("name"), OK(...), INSUFFICIENT_DATA(...) and AND/OR/NOT. They’re how you suppress noise (“page only if the 5xx alarm AND the health-check alarm are both firing”). Their failure modes are logic and suppression, not metrics.
| Composite element | Correct use | Failure mode |
|---|---|---|
AlarmRule |
ALARM("a") AND ALARM("b") |
Referencing a child by ARN vs name inconsistently |
Child in INSUFFICIENT_DATA |
Counts as neither ALARM nor OK unless you write INSUFFICIENT_DATA(...) |
A flaky child silently keeps the composite quiet |
ActionsSuppressor |
A “maintenance” child that mutes the composite | Left engaged → composite never pages |
| Suppressor wait/extension | ActionsSuppressorWaitPeriod grace |
Too long → real alarms suppressed |
| Deleting a child | Composite rule breaks | Rule references a name that no longer exists |
Cross-account / cross-region: an alarm evaluates a metric in the same account and region as the alarm, unless you deliberately build a metric-math alarm that pulls another account’s metric via a monitoring account (CloudWatch cross-account observability) with an AccountId on the query. The classic mistake is creating the alarm in us-east-1 while the metric is published in ap-south-1 — the alarm sits in INSUFFICIENT_DATA forever. Always confirm the alarm’s region matches the metric’s.
| Cross-account/region pitfall | Confirm | Fix |
|---|---|---|
| Alarm in wrong region | Alarm region vs metric region | Recreate alarm in the metric’s region |
| Cross-account metric not linked | No monitoring-account link | Enable cross-account observability; add AccountId to the query |
| SNS topic in another account | Topic policy principals | Allow the alarm’s account in the topic policy |
Architecture at a glance
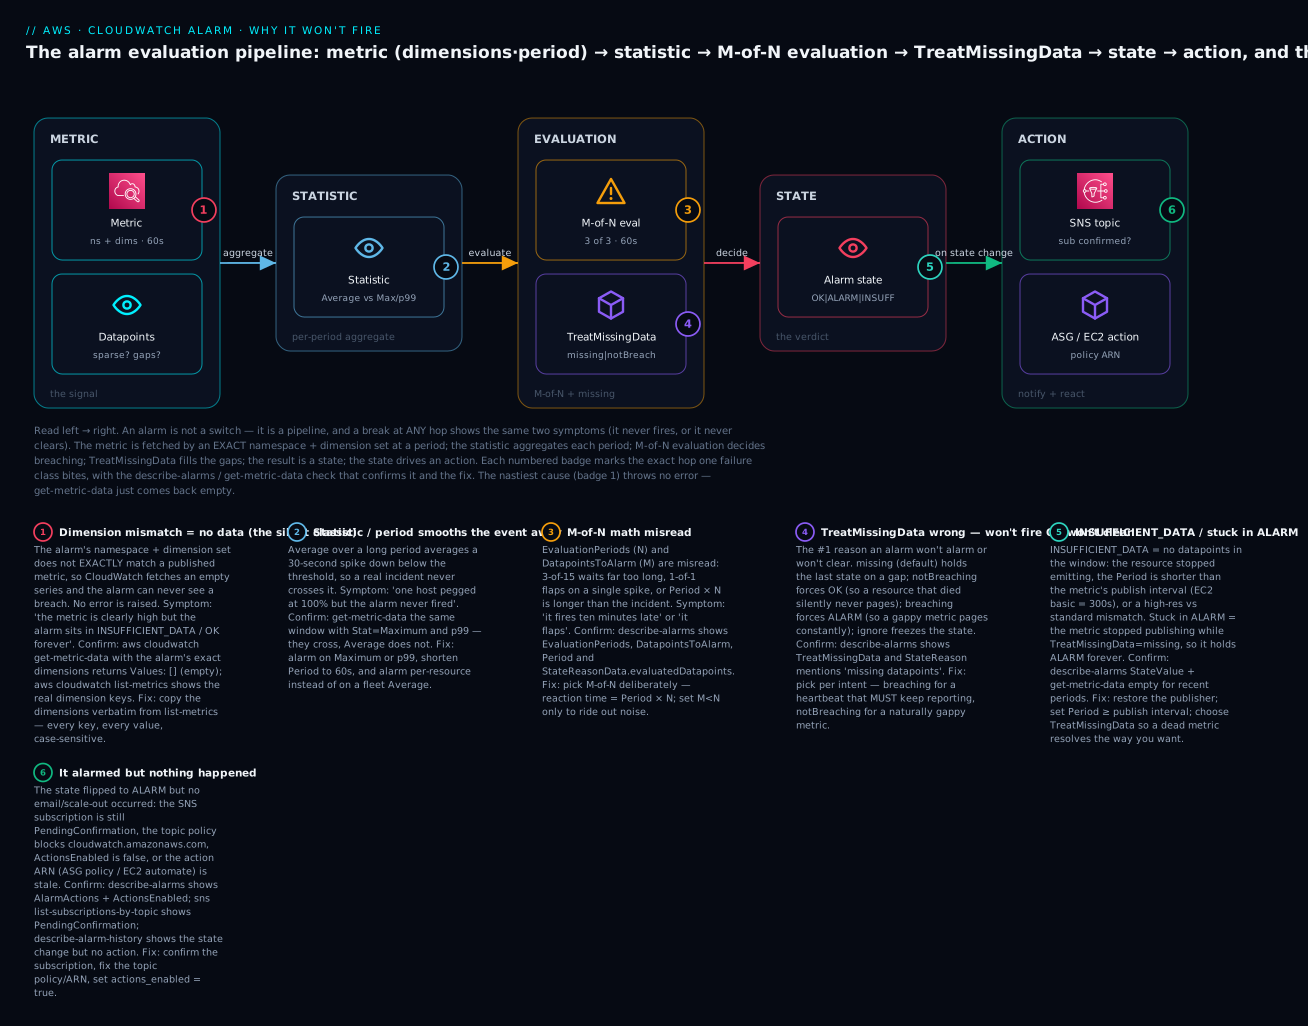
The diagram traces the real evaluation pipeline left to right — metric (namespace + exact dimensions, at a period) → statistic → M-of-N evaluation → TreatMissingData gap-fill → state → action — and drops a numbered badge at the exact hop each failure class bites. Follow the flow: a metric is fetched by an exact dimension set (badge 1, where a mismatch returns an empty series and the alarm can never see a breach); each period is collapsed by a statistic (badge 2, where Average/too-long-a-period smooths the spike away); the window is judged M-of-N (badge 3, where the N/M/period math makes it late or flappy); missing periods are filled by TreatMissingData (badge 4, the #1 won’t-fire/won’t-clear cause); the result is a state (badge 5, where an empty window gives INSUFFICIENT_DATA or a dead metric sticks it in ALARM); and only a state change drives an action (badge 6, where an unconfirmed SNS subscription or disabled actions means “it alarmed but nothing happened”). The legend narrates each number as symptom · confirm · fix, so the picture is both the architecture and the diagnostic map. The single habit it encodes: when an alarm misbehaves, run get-metric-data with the alarm’s exact dimensions first — an empty result sends you upstream (badges 1–2), a populated one sends you downstream (badges 3–6).
Real-world scenario
Northwind Retail runs a checkout service behind an Application Load Balancer, with an alarm named checkout-5xx-high that the platform team built during onboarding. During a Friday-evening flash sale, the target group started returning 5xxs — a downstream inventory call was timing out — and checkout was broken for roughly 35 minutes before a customer tweet reached the on-call engineer. The alarm never paged. Post-incident, the team found not one bug but a chain of three, each of which alone would have caused the miss.
First, the dimension mismatch. The alarm watched AWS/ApplicationELB HTTPCode_Target_5XX_Count with only {LoadBalancer=app/checkout-alb/…}. But the team had recently split checkout into two target groups, and the 5xx metric they cared about was published per {LoadBalancer, TargetGroup}. Running the reflex command told the whole story:
aws cloudwatch get-metric-data --metric-data-queries '[{"Id":"m1","MetricStat":{"Metric":{"Namespace":"AWS/ApplicationELB","MetricName":"HTTPCode_Target_5XX_Count","Dimensions":[{"Name":"LoadBalancer","Value":"app/checkout-alb/50dc6c495c0c9188"}]},"Period":60,"Stat":"Sum"}}]' --start-time 2026-07-10T13:00:00Z --end-time 2026-07-10T14:00:00Z
# -> "Values": []   (empty, during a window everyone knew had thousands of 5xxs)
list-metrics showed the real series carried a TargetGroup dimension. The alarm had been fetching an empty series since the day the second target group shipped — three weeks of a green alarm over a metric it literally could not see.
Second, even after they fixed the dimensions in a hurry, they discovered the alarm used Statistic=Average with Period=300. During a partial outage where one of four targets was throwing 5xxs, the average count per 5-minute period stayed low. They changed it to Sum over Period=60 with a 3-of-5 evaluation — catches a sustained burst in five minutes, ignores a single blip.
Third, and most damning: even a correctly firing alarm would have been silent, because the SNS topic’s only subscription — the on-call email alias — had read PendingConfirmation since it was created in Terraform. Nobody had ever clicked the confirmation link. aws sns list-subscriptions-by-topic made it obvious in one line.
The remediation was a policy, not a patch: every alarm now ships with treat_missing_data chosen deliberately, dimensions asserted against list-metrics in CI, and a synthetic set-alarm-state test in the deploy pipeline that fires each alarm’s SNS path once and asserts a delivery — so an unconfirmed subscription fails the build, not the incident. The flash-sale miss cost an estimated ₹18 lakh in abandoned carts; the fix cost an afternoon.
Advantages and disadvantages
CloudWatch alarms are the default, deeply integrated, cheap decision layer for AWS — but their defaults optimise for “don’t surprise you,” which is exactly why silent misconfigurations survive.
| Advantages | Disadvantages / sharp edges |
|---|---|
| Native to every AWS metric; zero infra to run | Fetch-by-exact-dimensions fails silently (empty series, no error) |
| Cheap (first 10 standard alarms free; then per-alarm/month) | TreatMissingData default (missing) causes stuck-in-ALARM |
| M-of-N gives real noise control | M-of-N and long periods make “fires late” easy to build |
| Anomaly detection + metric math for advanced cases | Percentiles need distribution-backed metrics; nonsense otherwise |
| Composite alarms suppress noise cleanly | Composite suppressors can mute real pages if left engaged |
| Actions integrate with SNS/ASG/EC2/SSM | Actions fire on transition only; unconfirmed SNS is invisible |
| Fully declarable in Terraform/CloudFormation | Easy to encode the wrong string (notBreaching casing) in IaC |
The through-line: alarms fail quietly. Nothing throws. The discipline that beats every disadvantage in this table is a habit, not a feature — always confirm with get-metric-data (does the series even exist and does it cross under the chosen statistic?) and list-subscriptions-by-topic (is the pipe connected?) before you trust an alarm.
Hands-on lab
This lab builds an alarm that never fires because of a dimension mismatch, diagnoses it with describe-alarms + an empty get-metric-data, and fixes it; then reproduces a statistic-smoothed miss (Average vs Maximum) and a stuck-in-ALARM (metric stops + wrong TreatMissingData), fixing each. It uses a custom metric so it is fully free-tier-friendly and needs no EC2. Set your region once:
export AWS_DEFAULT_REGION=ap-south-1
export ACCT=$(aws sts get-caller-identity --query Account --output text)
⚠️ Cost note: custom metrics, alarms beyond the first 10, and API calls beyond the free tier carry small charges. This lab stays within a handful of alarms and a trickle of put-metric-data calls — cents at most — and the teardown removes everything.
Step 1 — an SNS topic and a (deliberately unconfirmed, then confirmed) subscription
aws sns create-topic --name lab-alarms
export TOPIC=arn:aws:sns:${AWS_DEFAULT_REGION}:${ACCT}:lab-alarms
aws sns subscribe --topic-arn $TOPIC --protocol email \
  --notification-endpoint you@example.com
# EXPECTED: SubscriptionArn: "pending confirmation" — check your inbox, click Confirm.
aws sns list-subscriptions-by-topic --topic-arn $TOPIC \
  --query 'Subscriptions[].SubscriptionArn'
# Before confirming: ["PendingConfirmation"]   <-- the classic silent bug
# After  confirming: ["arn:aws:sns:...:lab-alarms:<uuid>"]
You just saw failure #1 of the action table with your own eyes. Confirm the subscription before continuing.
Step 2 — publish a custom metric with a specific dimension
# Publish "Latency" for App=checkout, one value a minute for a few minutes.
for i in 1 2 3; do
  aws cloudwatch put-metric-data --namespace "Lab/Checkout" \
    --metric-name Latency --unit Milliseconds \
    --dimensions App=checkout --value 120
  sleep 60
done
# Confirm the metric and its REAL dimensions:
aws cloudwatch list-metrics --namespace Lab/Checkout
# EXPECTED: one metric "Latency" with Dimensions [{App: checkout}]
Step 3 — build an alarm with the WRONG dimension (the silent classic)
Note the dimension value is checkouts (plural) — a realistic typo:
aws cloudwatch put-metric-alarm \
  --alarm-name lab-latency-BROKEN \
  --namespace Lab/Checkout --metric-name Latency \
  --dimensions Name=App,Value=checkouts \
  --statistic Average --period 60 \
  --evaluation-periods 1 --datapoints-to-alarm 1 \
  --comparison-operator GreaterThanThreshold --threshold 100 \
  --treat-missing-data missing \
  --alarm-actions $TOPIC
Now push a value that is way over the threshold under the correct dimension and watch the alarm ignore it:
aws cloudwatch put-metric-data --namespace Lab/Checkout \
  --metric-name Latency --dimensions App=checkout --value 5000
sleep 90
aws cloudwatch describe-alarms --alarm-names lab-latency-BROKEN \
  --query 'MetricAlarms[0].{state:StateValue,reason:StateReason}'
# EXPECTED: state = "INSUFFICIENT_DATA" — a 5000ms latency and the alarm is blind.
Step 4 — diagnose the mismatch in one command
# Ask get-metric-data for the alarm's EXACT (wrong) dimensions:
aws cloudwatch get-metric-data --metric-data-queries \
 '[{"Id":"m1","MetricStat":{"Metric":{"Namespace":"Lab/Checkout","MetricName":"Latency","Dimensions":[{"Name":"App","Value":"checkouts"}]},"Period":60,"Stat":"Average"}}]' \
  --start-time "$(date -u -v-15M +%Y-%m-%dT%H:%M:%SZ)" \
  --end-time   "$(date -u +%Y-%m-%dT%H:%M:%SZ)" \
  --query 'MetricDataResults[0].Values'
# EXPECTED: []   <-- empty. Proof: the alarm's dimensions match no published metric.

# Now ask what dimensions the metric REALLY has:
aws cloudwatch list-metrics --namespace Lab/Checkout \
  --query 'Metrics[].Dimensions'
# EXPECTED: [[{"Name":"App","Value":"checkout"}]]   <-- singular. There's the bug.
Step 5 — fix the dimension and watch it fire
aws cloudwatch put-metric-alarm \
  --alarm-name lab-latency-BROKEN \
  --namespace Lab/Checkout --metric-name Latency \
  --dimensions Name=App,Value=checkout \
  --statistic Average --period 60 \
  --evaluation-periods 1 --datapoints-to-alarm 1 \
  --comparison-operator GreaterThanThreshold --threshold 100 \
  --treat-missing-data missing --alarm-actions $TOPIC
aws cloudwatch put-metric-data --namespace Lab/Checkout \
  --metric-name Latency --dimensions App=checkout --value 5000
sleep 90
aws cloudwatch describe-alarms --alarm-names lab-latency-BROKEN \
  --query 'MetricAlarms[0].StateValue'
# EXPECTED: "ALARM"  (and an email, because you confirmed the subscription in step 1)
Step 6 — reproduce a statistic-smoothed miss
Build two alarms on the same metric — one on Average, one on Maximum — then publish a mix where the average stays low but one datapoint spikes. CloudWatch aggregates multiple put-metric-data calls in the same period:
aws cloudwatch put-metric-alarm --alarm-name lab-avg \
  --namespace Lab/Checkout --metric-name Spikey --dimensions Name=App,Value=checkout \
  --statistic Average --period 60 --evaluation-periods 1 --datapoints-to-alarm 1 \
  --comparison-operator GreaterThanThreshold --threshold 1000 --treat-missing-data notBreaching
aws cloudwatch put-metric-alarm --alarm-name lab-max \
  --namespace Lab/Checkout --metric-name Spikey --dimensions Name=App,Value=checkout \
  --statistic Maximum --period 60 --evaluation-periods 1 --datapoints-to-alarm 1 \
  --comparison-operator GreaterThanThreshold --threshold 1000 --treat-missing-data notBreaching
# One 9000ms spike among nine 50ms datapoints in the same minute:
for v in 50 50 50 50 9000 50 50 50 50; do
  aws cloudwatch put-metric-data --namespace Lab/Checkout --metric-name Spikey \
    --dimensions App=checkout --value $v
done
sleep 120
aws cloudwatch describe-alarms --alarm-names lab-avg lab-max \
  --query 'MetricAlarms[].{name:AlarmName,state:StateValue}'
# EXPECTED: lab-avg = OK (avg ~1044... may be borderline; raise the spike to be sure),
#           lab-max = ALARM. Average smoothed the spike; Maximum caught it.
If lab-avg also trips, push the spike higher relative to the baseline (e.g. one 50000 among many 10s) — the point is that Average needs a far bigger spike to cross than Maximum does.
Step 7 — reproduce and fix a stuck-in-ALARM
# An alarm that is ALARM now, with the default missing-data rule:
aws cloudwatch put-metric-alarm --alarm-name lab-stuck \
  --namespace Lab/Checkout --metric-name Heartbeat --dimensions Name=App,Value=checkout \
  --statistic Minimum --period 60 --evaluation-periods 1 --datapoints-to-alarm 1 \
  --comparison-operator LessThanThreshold --threshold 1 \
  --treat-missing-data missing --alarm-actions $TOPIC
aws cloudwatch put-metric-data --namespace Lab/Checkout \
  --metric-name Heartbeat --dimensions App=checkout --value 0   # 0 < 1 => breach
sleep 90
aws cloudwatch describe-alarms --alarm-names lab-stuck --query 'MetricAlarms[0].StateValue'
# EXPECTED: "ALARM". Now STOP publishing Heartbeat entirely and wait several minutes.
sleep 300
aws cloudwatch describe-alarms --alarm-names lab-stuck \
  --query 'MetricAlarms[0].{state:StateValue,reason:StateReason}'
# EXPECTED: still "ALARM" — with missing-data=missing, no new data means it holds ALARM forever.
The fix is to choose a missing-data rule that resolves a dead metric the way you intend. For a heartbeat that should keep beating, breaching is often right (a silent heartbeat IS bad). To let a gap clear the alarm instead, use notBreaching:
aws cloudwatch put-metric-alarm --alarm-name lab-stuck \
  --namespace Lab/Checkout --metric-name Heartbeat --dimensions Name=App,Value=checkout \
  --statistic Minimum --period 60 --evaluation-periods 1 --datapoints-to-alarm 1 \
  --comparison-operator LessThanThreshold --threshold 1 \
  --treat-missing-data notBreaching --alarm-actions $TOPIC
sleep 90
aws cloudwatch describe-alarms --alarm-names lab-stuck --query 'MetricAlarms[0].StateValue'
# EXPECTED: "OK" — with notBreaching, the ongoing gap now reads as fine and the alarm clears.
Step 8 — the whole thing in Terraform
For the “do it right the first time” version, here is the fixed alarm plus a correctly wired, policy-guarded SNS topic:
resource "aws_sns_topic" "alarms" { name = "lab-alarms-tf" }

resource "aws_sns_topic_subscription" "email" {
  topic_arn = aws_sns_topic.alarms.arn
  protocol  = "email"
  endpoint  = "you@example.com" # you still must click Confirm in the email
}

data "aws_iam_policy_document" "cw_publish" {
  statement {
    actions   = ["SNS:Publish"]
    resources = [aws_sns_topic.alarms.arn]
    principals { type = "Service", identifiers = ["cloudwatch.amazonaws.com"] }
  }
}
resource "aws_sns_topic_policy" "alarms" {
  arn    = aws_sns_topic.alarms.arn
  policy = data.aws_iam_policy_document.cw_publish.json
}

resource "aws_cloudwatch_metric_alarm" "latency" {
  alarm_name          = "lab-latency-tf"
  namespace           = "Lab/Checkout"
  metric_name         = "Latency"
  dimensions          = { App = "checkout" } # matches list-metrics EXACTLY
  statistic           = "Maximum"            # catch spikes, not averages
  period              = 60                    # >= publish interval
  evaluation_periods  = 3
  datapoints_to_alarm = 2                     # 2-of-3: rides out one blip
  comparison_operator = "GreaterThanThreshold"
  threshold           = 1000
  treat_missing_data  = "notBreaching"        # a quiet period is fine here
  alarm_actions       = [aws_sns_topic.alarms.arn]
  ok_actions          = [aws_sns_topic.alarms.arn]
  actions_enabled     = true
}
terraform init && terraform apply -auto-approve
# Confirm the email subscription, then verify:
aws cloudwatch describe-alarms --alarm-names lab-latency-tf \
  --query 'MetricAlarms[0].{dims:Dimensions,stat:Statistic,missing:TreatMissingData}'
Step 9 — teardown
aws cloudwatch delete-alarms --alarm-names \
  lab-latency-BROKEN lab-avg lab-max lab-stuck
# Terraform-created resources:
terraform destroy -auto-approve
# CLI-created topic:
aws sns delete-topic --topic-arn $TOPIC
Custom metrics cannot be deleted directly; they simply expire after 15 months of no new datapoints and cost nothing once you stop publishing. Everything billable (alarms, the topic) is gone.
Common mistakes & troubleshooting
This is the section to keep open at 3 a.m. Start with the master table — find your symptom, run the confirm command, apply the fix — then use the TreatMissingData matrix, the M-of-N reference, and the state reference below it. The one rule that orders the whole table: run get-metric-data with the alarm’s exact dimensions first. Empty result → the problem is upstream (identify/aggregate, rows 1–9). Populated result → downstream (evaluate/act, rows 10–24).
The diagnostic command set
These eight commands answer almost every alarm question. Keep them in a runbook:
| Command | Answers | Read the field |
|---|---|---|
aws cloudwatch describe-alarms --alarm-names X |
Current state + full config | StateValue, StateReason, Dimensions, TreatMissingData |
aws cloudwatch describe-alarm-history --alarm-name X |
The timeline / flapping / who changed it | HistoryItemType, HistorySummary |
aws cloudwatch get-metric-data … |
Does the series exist and does it cross? | Values (empty = mismatch) |
aws cloudwatch list-metrics --namespace N |
The real dimension sets published | Metrics[].Dimensions |
aws cloudwatch describe-alarms-for-metric … |
Which alarms watch this metric | reverse lookup |
aws cloudwatch set-alarm-state --alarm-name X --state-value ALARM |
Does the action wiring work? | fires actions once |
aws sns list-subscriptions-by-topic --topic-arn T |
Is the notification pipe connected? | PendingConfirmation = broken |
aws sns get-topic-attributes --topic-arn T |
Does the topic policy allow CloudWatch? | Policy principals |
Master playbook
| # | Symptom (state / behaviour) | Root cause | Confirm (describe-alarms / get-metric-data) |
Fix |
|---|---|---|---|---|
| 1 | Sits in INSUFFICIENT_DATA forever; metric clearly non-empty |
Dimension mismatch (missing/extra/wrong-value/case) | get-metric-data with alarm’s dims → Values: []; list-metrics shows the real set |
Copy dimensions verbatim from list-metrics |
| 2 | INSUFFICIENT_DATA, metric publishes every 5 min |
Period < publish interval (e.g. 60s on EC2 basic) | describe-alarms Period=60 vs metric cadence |
Set Period ≥ 300, or enable detailed monitoring |
| 3 | INSUFFICIENT_DATA on a high-res period |
High-res period (10/30s) on a standard metric | Period is 10/30 but metric is standard |
Use Period ≥ 60 |
| 4 | INSUFFICIENT_DATA; correct dims in another region |
Alarm created in the wrong region | Alarm region ≠ metric region | Recreate the alarm in the metric’s region |
| 5 | Sparse metric flaps INSUFFICIENT_DATA↔state |
Event-driven metric under missing |
get-metric-data shows rare datapoints |
notBreaching + longer Period, or alarm on a rate |
| 6 | Wrong namespace/metric name; empty series | Typo in Namespace/MetricName |
describe-alarms strings vs list-metrics |
Fix the string |
| 7 | Custom metric alarm never has data | PutMetricData never ran / different dims than the alarm |
list-metrics for your namespace |
Align emitter dimensions with the alarm |
| 8 | Metric exists but alarm never sees the value you expect | Alarming on aggregate vs per-resource (or vice versa) | list-metrics dimension combos |
Alarm on the combo that’s actually published |
| 9 | Alarm confidently OK over a dead resource |
Dimension/period bug masked by TreatMissingData=notBreaching |
get-metric-data empty and TreatMissingData=notBreaching |
Fix the real bug; reconsider missing-data rule |
| 10 | Real spike, alarm stays OK |
Average smooths the spike |
Re-query with Stat=Maximum/p99 → they cross |
Alarm on Maximum/p99; alarm per-resource |
| 11 | Brief burst, alarm stays OK |
Period too long averages the event out |
describe-alarms long Period |
Shorten Period to 60s; use Sum for counts |
| 12 | Latency SLO breached, alarm quiet | Average latency hides the tail |
Re-query p99/p99.9 |
Alarm on the percentile |
| 13 | p99 alarm behaves randomly |
Percentile on a pre-aggregated metric | Metric is one averaged value/period (no distribution) | Publish raw values / StatisticValues, or drop the percentile |
| 14 | Fires ~10–15 min late | Period × EvaluationPeriods too long |
describe-alarms Period, EvaluationPeriods |
Shorten both; reaction = Period × N |
| 15 | Flaps on every transient | 1-of-1 on a spiky metric |
EvaluationPeriods=1, DatapointsToAlarm=1 |
Use M-of-N (e.g. 3-of-5) |
| 16 | Never fires despite occasional breaches | M = N too strict (all N must breach) |
DatapointsToAlarm == EvaluationPeriods |
Lower M (e.g. 2-of-3) |
| 17 | Won’t clear after the fix | Metric stopped; TreatMissingData=missing holds ALARM |
get-metric-data empty for recent periods |
Restore metric; or notBreaching/ignore |
| 18 | Won’t fire when a process dies | TreatMissingData=notBreaching on a heartbeat |
describe-alarms TreatMissingData=notBreaching |
Set breaching for must-report metrics |
| 19 | Pages constantly, metric is fine | TreatMissingData=breaching on a gappy metric |
TreatMissingData=breaching + sparse data |
Set notBreaching |
| 20 | Anomaly alarm never/always fires | Static op or --threshold used with a band |
ComparisonOperator not an anomaly op |
Use anomaly op + --threshold-metric-id |
| 21 | Metric-math alarm rejected / no data | Not exactly one ReturnData=true |
describe-alarms Metrics[] |
One expression ReturnData=true, inputs false |
| 22 | State went ALARM, no email |
SNS subscription PendingConfirmation |
sns list-subscriptions-by-topic |
Confirm the subscription |
| 23 | Correct state, nothing acts | ActionsEnabled=false or stale action ARN |
describe-alarms ActionsEnabled, AlarmActions |
actions_enabled=true; fix/re-put the ARN |
| 24 | Cross-account notify fails | Topic policy blocks CloudWatch / other account | sns get-topic-attributes Policy |
Allow cloudwatch.amazonaws.com + source account |
TreatMissingData behavior matrix (memorise this)
TreatMissingData |
Missing period counts as | On all-missing | Best for | Fails when |
|---|---|---|---|---|
missing (default) |
ignored; holds last state | → INSUFFICIENT_DATA |
Continuous metrics | Dead metric → stuck in ALARM |
notBreaching |
good (under threshold) | → OK |
Gappy bad-event metrics | A dead emitter looks healthy |
breaching |
bad (over threshold) | → ALARM |
Heartbeats / canaries | Gappy-but-fine metric pages constantly |
ignore |
not counted; state frozen | state unchanged | Manually managed alarms | Masks a genuinely dead metric |
M-of-N (EvaluationPeriods = N, DatapointsToAlarm = M) reference
| Goal | N | M | Period | Notes |
|---|---|---|---|---|
| Fast, sensitive | 1 | 1 | 60s | Flaps; only for very stable metrics |
| Steady, sustained | 3 | 3 | 60s | 3 straight breaching minutes |
| Noise-tolerant | 5 | 3 | 60s | The default good page |
| Ride out one blip | 3 | 2 | 60s | 2 of any recent 3 |
| Slow / coarse metric | 2 | 2 | 300s | ~10-min reaction; not for latency |
| High-resolution | 1–3 | 1 | 10s | Requires a high-res custom metric |
Alarm state / status reference
| State / status | Meaning | Likely cause | Confirm | Fix |
|---|---|---|---|---|
INSUFFICIENT_DATA |
Not enough datapoints in window | Dimension mismatch, period<publish, dead emitter, brand-new | get-metric-data empty; StateUpdatedTimestamp |
Fix dims/period; restore emitter; or just wait if new |
ALARM (stuck) |
Threshold breached, holding | Metric stopped + missing |
get-metric-data empty recent |
Restore metric; change missing-data rule |
OK (false) |
Looks healthy, isn’t | Dimension bug + notBreaching |
get-metric-data empty + rule |
Fix dims; reconsider rule |
ALARM (flapping) |
Oscillating | 1-of-1 on spiky metric, or sparse+missing |
describe-alarm-history many transitions |
M-of-N; notBreaching; longer period |
| Action not fired | State changed, no notify | Unconfirmed SNS / ActionsEnabled=false |
list-subscriptions-by-topic; describe-alarms |
Confirm sub; enable actions |
The three nastiest, in prose
Dimension mismatch is the one that fools everyone, because the console shows a tidy, complete-looking alarm and no error anywhere. The alarm is fetching a metric that does not exist, so it can never breach. The tell is always the same: get-metric-data with the alarm’s exact dimensions returns an empty Values array. Never debug a “won’t fire” alarm any other way first — this one command splits the entire problem space in half. And remember that a metric with {A} and the same metric with {A, B} are different metrics; specificity is not subsetting.
TreatMissingData is the one that causes both headline symptoms — “it never fired” and “it won’t clear” — from a single setting. The mental model that fixes it: decide what silence means for this metric. If a gap means “the thing I’m watching is broken” (a heartbeat, a canary, a health count), silence is bad → breaching. If a gap means “nothing bad happened this minute” (errors, 4xx, throttles), silence is good → notBreaching. The default missing is only correct for metrics that are genuinely always-on, and it is precisely the default that manufactures stuck-in-ALARM alarms when a metric dies mid-incident.
Statistic/period smoothing is the one that survives code review, because the alarm looks reasonable — right metric, right threshold — and only fails on the specific shape of a real incident (a short spike, or one hot resource in a fleet). Average is a lie detector for “sustained load” and useless for “did anything peg.” When you catch a “the graph clearly spiked but the alarm was quiet,” re-run get-metric-data over the same window with Stat=Maximum and Stat=p99: if those cross the threshold and Average doesn’t, you’ve found it. The fix is to alarm on the statistic that matches the failure you fear, and to alarm per-resource when a single bad node is the risk.
Best practices
- Assert dimensions against
list-metrics. Never hand-type a dimension set; copy it from what’s actually published. In IaC, wire a CI check that fails if an alarm’s dimensions don’t appear inlist-metrics. - Choose
TreatMissingDatadeliberately, every time. Make it a required, reviewed field. “What does silence mean for this metric?” is the question; the answer picksbreachingvsnotBreaching. - Alarm on the statistic that matches the fear.
Maximum/p99for spikes and tails,Sumfor counts,Averageonly for genuine sustained-load SLOs. Alarm per-resource when one bad node is the risk. - Compute reaction time as
Period × Nand make it a budget. Don’t leaveEvaluationPeriodshigh “to be safe”; it directly delays the page. - Use
M-of-N(M < N) to ride out noise instead of raising the threshold — you keep sensitivity while ignoring single blips. - Always set
OKActionsto the same topic asAlarmActions, so “recovered” is announced and a stuck alarm is obvious. - Wire and test the action path. After creating an alarm, run
set-alarm-state --state-value ALARMonce and confirm a real notification arrives; assert every SNS subscription is confirmed, notPendingConfirmation. - Prefer stable dimensions over ephemeral ids. Alarm on the ASG-aggregate or a target group, not a single instance id that a redeploy will orphan.
- Alarm on missing data itself where it matters. For must-report metrics, an
INSUFFICIENT_DATA-action or abreachingrule catches a silently dead emitter. - Match
Periodto the metric’s publish interval. 60s for detailed monitoring / custom metrics; 300s for EC2 basic — never shorter than the source publishes. - Group with composite alarms to page on real coincidences and suppress noise — but audit
ActionsSuppressorso a maintenance mute doesn’t silence a real incident. - Standardise in Terraform with a module that defaults
treat_missing_data,ok_actions, and a confirmed-subscription check, so every alarm is correct by construction.
Security notes
Alarms are low-risk data, but their plumbing touches identity and notification paths that deserve least-privilege:
- Least privilege on who can change alarms.
cloudwatch:PutMetricAlarmandcloudwatch:DeleteAlarmslet someone silently disable your paging. Scope them; audit them in CloudTrail. A deleted orActionsEnabled=falsealarm is a security-relevant change (it blinds detection). - Protect the SNS topic policy. The topic that carries alarm notifications should allow
SNS:Publishonly fromcloudwatch.amazonaws.com(and, for cross-account, only the specific source alarm ARNs). An over-broad topic policy lets anyone publish fake “all clear” or spam your on-call. - Encrypt the topic with a KMS CMK if alarm bodies may carry sensitive dimension values (resource ids, account structure). Note the KMS key policy must let CloudWatch/SNS use the key, or delivery silently fails — a security control that becomes an availability bug if misconfigured.
- Don’t leak topology in alarm names/descriptions that flow to third-party endpoints (Slack, PagerDuty via HTTPS). Dimension values in a notification can expose internal naming.
- Guard
iam:PassRolefor action targets. EC2 recover/stop and SSM OpsItem actions run under service permissions; make sure the action ARNs and any associated roles are the ones you intend. - Alarm on your own guardrails. A composite or metric-filter alarm on
DeleteAlarms/PutMetricAlarmAPI calls (via CloudTrail → metric filter) catches someone disabling monitoring.
Cost & sizing
Alarms are cheap, but the bill has a few real drivers — and the free tier covers most learning and small workloads.
| Cost driver | Rough figure (USD, on-demand) | Notes / free tier |
|---|---|---|
| Standard-resolution alarm | ~$0.10 per alarm / month | First 10 alarms free |
| High-resolution alarm (10/30s) | ~$0.30 per alarm / month | Costs 3× a standard alarm |
| Composite alarm | ~$0.50 per alarm / month | One composite can replace many pages |
| Anomaly-detection alarm | ~$0.30 per alarm / month | Plus the underlying metrics |
Custom metric (PutMetricData) |
~$0.30 per metric / month | First 10 metrics free; high-cardinality dims multiply this |
GetMetricData API |
~$0.01 per 1,000 metrics requested | Dashboards and this-lab diagnostics are trivial |
| SNS notifications | Email free tier generous; HTTPS/SMS priced per delivery | SMS is the pricey one |
| CloudWatch Logs metric filters | Priced on ingested log GB, not the filter | Watch ingestion, not the alarm |
Sizing guidance: the cost of an alarm is negligible next to the cost of the incident it catches — do not economise by having too few alarms. The real cost trap is high-cardinality custom metrics: a metric dimensioned per-request-id or per-user explodes into thousands of billed metrics. Keep dimensions to bounded, low-cardinality keys (service, environment, target group), and prefer composite alarms to collapse a wall of child alarms into a few meaningful pages rather than paying for — and getting fatigued by — dozens of raw ones. In INR terms, a well-run alarm estate for a mid-size service (a few dozen alarms, a handful of custom metrics) runs on the order of ₹200–₹800/month — rounding error against a single hour of downtime.
Interview & exam questions
Q1. An alarm sits in INSUFFICIENT_DATA even though the metric is clearly being published. What’s the first thing you check? The dimension set. Run get-metric-data with the alarm’s exact dimensions — an empty Values array proves a mismatch — then list-metrics to see the real dimension keys and copy them verbatim. Metrics are identified by the complete, exact dimension set. (SOA-C02, SAA-C03)
Q2. Explain TreatMissingData and its four values. It decides how a missing period is evaluated: missing (default — ignore, hold last state, all-missing → INSUFFICIENT_DATA), notBreaching (treat as good → pushes OK), breaching (treat as bad → pushes ALARM), ignore (freeze state). It’s the #1 reason an alarm won’t fire (dead metric under notBreaching) or won’t clear (dead metric under missing). (SOA-C02)
Q3. An alarm is stuck in ALARM for days over a flat metric. Why? The metric stopped publishing while TreatMissingData=missing, so CloudWatch holds the last state (ALARM) with no new data to move it to OK. Fix by restoring the emitter or choosing notBreaching/ignore deliberately. (SOA-C02)
Q4. A single host pegs at 100% CPU but the fleet alarm never fires. What happened and how do you fix it? The alarm used Average, which smoothed the one hot host across the fleet below the threshold. Alarm on Maximum, on a per-instance dimension, or on p99. (SAA-C03, SOA-C02)
Q5. What is your true reaction time for an alarm with Period=60, EvaluationPeriods=5, DatapointsToAlarm=3? Worst case ≈ Period × EvaluationPeriods = 5 minutes (plus up to one period of lag). DatapointsToAlarm=3 means 3 of those 5 minutes must breach — noise-tolerant, not faster. (SOA-C02, DVA-C02)
Q6. You set an alarm’s SNS action but got no email when it fired. List the causes. SNS subscription PendingConfirmation; ActionsEnabled=false; topic policy blocks cloudwatch.amazonaws.com; stale/wrong action ARN; or the alarm was already in ALARM (actions fire on transition, not on state). (DVA-C02, SOA-C02)
Q7. Why might Period=60 produce a permanent INSUFFICIENT_DATA on an EC2 metric? EC2 basic monitoring publishes every 300 seconds, so a 60-second period has empty periods most of the time. Set Period ≥ 300 or enable detailed (1-minute) monitoring. (SOA-C02)
Q8. When are CloudWatch percentiles (p99) invalid? On a metric that is already pre-aggregated to a single value per period (no underlying distribution). Percentiles need raw datapoints or StatisticValues. ALB TargetResponseTime supports them; a home-grown averaged metric doesn’t. (SOA-C02)
Q9. How does an anomaly-detection alarm differ in configuration? No numeric --threshold; you point --threshold-metric-id at an ANOMALY_DETECTION_BAND(m1, 2) expression and use an anomaly comparison operator (LessThanLowerOrGreaterThanUpperThreshold, etc.). It needs training history. (SOA-C02, MLS)
Q10. What breaks a metric-math alarm? Not having exactly one Metrics[] entry with ReturnData=true (the expression to alarm on) while the raw inputs are ReturnData=false. Zero or multiple true entries are rejected. (DVA-C02)
Q11. How do you make an alarm ride out a single noisy datapoint without becoming insensitive? Use M-of-N with M < N (e.g. DatapointsToAlarm=3, EvaluationPeriods=5) instead of raising the threshold — it fires on a real trend but ignores one blip. (SOA-C02)
Q12. What’s the value of OKActions, and why is it commonly a mistake to omit it? It notifies on recovery (ALARM → OK). Omitting it means recovery is silent and a stuck/never-clearing alarm is easy to miss; wiring it to the same topic gives you both the page and the all-clear. (SOA-C02)
Quick check
- Your alarm is in
INSUFFICIENT_DATAand you’re sure the metric exists. What single command confirms whether the alarm’s dimensions match a real metric? - A heartbeat metric that “must always report” should use which
TreatMissingDatavalue so that silence pages you? - An alarm has
Period=60,EvaluationPeriods=10,DatapointsToAlarm=10. Why might it “fire too late,” and what’s the worst-case reaction time? - A fleet CPU alarm on
Averagemisses a single pegged host. Name two fixes. - The alarm went
ALARMbut no email arrived and the subscription is confirmed. Name two remaining causes.
Answers
aws cloudwatch get-metric-datawith the alarm’s exact dimensions — an emptyValuesarray proves a mismatch; thenlist-metricsshows the real dimension set to copy.breaching— a missing period is treated as bad, so a silent heartbeat drives the alarm intoALARM.Period × EvaluationPeriods= 600s = 10 minutes, andDatapointsToAlarm=10means all ten minutes must breach before it fires — both make it slow. LowerEvaluationPeriodsand/or useM < N.- Alarm on
Maximum(orp99) instead ofAverage; and/or alarm on a per-instance dimension rather than the fleet aggregate. ActionsEnabled=falseon the alarm; the SNS topic policy blockscloudwatch.amazonaws.com; a broken downstream endpoint (HTTPS/Lambda); or the alarm was already inALARM(no transition, so no re-fire).
Glossary
| Term | Definition |
|---|---|
| Alarm state | One of OK, ALARM, INSUFFICIENT_DATA; actions fire on entry to a state (on transition). |
INSUFFICIENT_DATA |
Not enough datapoints in the evaluation window to judge — the home of dimension/period bugs. |
| Dimension | A name/value pair that, as a complete set, uniquely identifies a metric series. |
| Dimension mismatch | Alarm dimensions don’t exactly match a published metric → empty series → never fires. |
TreatMissingData |
Rule for how a missing period is evaluated: missing/notBreaching/breaching/ignore. |
| Evaluation periods (N) | How many recent periods the alarm considers. |
| Datapoints to alarm (M) | How many of those N must breach to enter ALARM; defaults to N. |
| M-of-N | The evaluation model: ALARM if ≥ M of the last N periods breach. |
| Reaction time | Worst-case delay to fire ≈ Period × EvaluationPeriods. |
| Statistic | Per-period aggregate: Average, Sum, Minimum, Maximum, SampleCount, or a percentile. |
| Period | The aggregation interval; must be ≥ the metric’s publish interval. |
| Anomaly detection | Alarm against a trained band (ANOMALY_DETECTION_BAND) instead of a static threshold. |
| Metric math | An alarm on an expression combining metrics; exactly one ReturnData=true. |
| Composite alarm | An alarm whose state is a boolean rule over other alarms’ states. |
ActionsEnabled |
Whether the alarm actually fires its actions; false = evaluates but never acts. |
set-alarm-state |
CLI to force a state once (fires actions) to test wiring; next real evaluation overrides it. |
Next steps
- Build the metrics and dashboards these alarms sit on in CloudWatch metrics, alarms & dashboards hands-on.
- Turn logs into the metrics you alarm on with CloudWatch Logs Insights querying hands-on.
- Harden the notification path your alarms fire into with SNS topics, fan-out & subscriptions hands-on.
- See how a dead alarm shows up downstream in why EC2 Auto Scaling won’t scale.