Quick take: an Auto Scaling group (ASG) does not “scale” — a pipeline scales, and every link can break with the identical symptom: nothing happens. A metric feeds a CloudWatch alarm, the alarm drives a scaling policy, the policy adjusts DesiredCapacity, the group asks EC2 to launch, and the new instance must survive a health check inside the grace period. When someone says “Auto Scaling is broken,” they have observed the output of a six-stage control loop and drawn a one-word conclusion. This playbook takes you stage by stage — with the exact
describe-scaling-activitiesanddescribe-auto-scaling-groupsoutput that tells you which link snapped — and fixes the number-one real cause, which throws no error at all.
You watch CPUUtilization sit at 94% for fifteen minutes. The dashboard is red. The ASG’s desired count does not move. No new instances. No alarm email. No entry anywhere that says why. To the on-call engineer this reads as a single failure — “the Auto Scaling group isn’t scaling” — but “not scaling” is not a root cause; it is a symptom shared by at least a dozen distinct faults, most of which are silent. The alarm might be in INSUFFICIENT_DATA. The group might already be at MaxSize. A cooldown from the last action might still be counting down. The launch might be failing on Insufficient Capacity in that Availability Zone. A process might be suspended from a half-finished instance refresh three days ago. Each of these produces the same view — a flat desired count — and each has a completely different fix.
This article is a diagnostic tree, not a feature tour. You will learn to treat the scaling control loop as a series of hops and to ask, at each one, “did the signal make it through?” — because the single most valuable skill here is knowing which of the six links broke before you touch a single setting. We cover every failure class end to end: the dead or mis-aggregated alarm, the silent already-at-max cap (the #1 cause), cooldown and warmup blocking the next action, target-tracking’s hidden internals, the whole family of launch failures (ICE, vCPU quota, full subnet, invalid AMI/key/instance-profile, Spot), the health-check kill loop that masquerades as “won’t scale,” and the process-level traps (suspended processes, scheduled actions in the wrong timezone, scale-in protection). The heart of the article is a symptom → root cause → confirm → fix playbook, an Activity-History status-code reference, and a decision table — plus a hands-on lab where you reproduce two of these failures on purpose and read the evidence AWS leaves behind.
What problem this solves
In production, “the ASG won’t scale” is one of the most expensive incidents to misdiagnose, because the symptom is so generic that engineers reach for the wrong fix by reflex. The classic waste pattern: CPU is pegged, so someone assumes the alarm is broken, rewrites the scaling policy, redeploys, and nothing changes — because the group was at MaxSize the whole time and no alarm could ever have helped. Hours evaporate on the wrong link in the chain.
The pain is worse than a slow dashboard. A group that won’t scale out during a traffic spike drops requests, blows the SLA, and can cascade into a full outage when the surviving instances tip over. A group that won’t scale in after the spike burns money on idle capacity — a stuck scale-in is a silent budget leak nobody notices until the bill. A group stuck in a launch-and-kill loop (health-check flapping) looks like “not scaling” but is actually thrashing EC2 launches every few minutes, generating cost, log noise, and a cycling fleet that never stabilises. And the nastiest, Insufficient Capacity, means AWS itself cannot give you the instance type you asked for in that AZ — no config change on your side fixes it; you need instance-type and AZ diversification, which is an architecture decision you’d rather have made before the incident.
Everyone who runs stateless compute on EC2 hits this: web tiers behind an ALB, batch workers pulling from SQS, ECS-on-EC2 capacity providers (which are ASGs underneath), game servers, CI runner fleets. The people who resolve it in five minutes instead of five hours are the ones who know the control loop has six links and know the two describe-* commands that show which one broke.
Learning objectives
By the end of this article you can:
- Model the scaling control loop as six hops (metric → alarm → policy → group → launch → health) and localise a “won’t scale” symptom to exactly one of them.
- Read
describe-scaling-activitiesanddescribe-auto-scaling-groupsas your primary evidence — an empty activity history, aFailedStatusCode, aSuspendedProcesseslist,Desired == Max— and know what each proves. - Diagnose a dead alarm: wrong metric/dimensions, threshold never crossed,
period × evaluation-periodstoo slow,ALARMvsINSUFFICIENT_DATA, and a mis-chosen statistic that averages away the hot instance. - Recognise the silent already-at-max cap — the #1 cause — and alarm on it so it is never silent again.
- Untangle target-tracking internals: the hidden
AlarmHigh/AlarmLowit creates, why a too-high target never triggers, and how two policies fight. - Classify every launch failure — ICE,
VcpuLimitExceeded,InsufficientFreeAddressesInSubnet, invalid AMI/key/instance-profile, unavailable Spot — from the Activity-History status message, and apply the right fix (diversify, raise a quota, free IPs, fix the template). - Break and repair the health-check kill loop by getting
HealthCheckGracePeriod, the health-check type, and the health path right. - Reproduce two failures in a lab (max=desired, and a bad instance profile), read the evidence, fix them, and tear it all down.
Prerequisites & where this fits
You should be comfortable launching an EC2 instance and reading its console, know what a launch template, a security group, a subnet, and an Availability Zone are, and have the AWS CLI v2 configured with permission to run autoscaling:Describe*, cloudwatch:DescribeAlarms, and ec2:Describe*. Familiarity with CloudWatch metrics and alarms and with an Application Load Balancer (target groups + health checks) will make the ELB-health sections click faster.
Where this sits: Auto Scaling is the elasticity layer of an EC2 architecture. Below it is the launch template (which instance, which AMI, which IAM role) — if the template is wrong, scaling can’t launch, so this article leans on EC2 Auto Scaling & Launch Templates Hands-On. Beside it are the service quotas that cap how many vCPUs you may launch — covered in AWS Service Quotas & Limits. In front of it is the load balancer whose health checks the ASG can honour — see ALB & Target Groups Hands-On. And when capacity is the constraint, the answer is often Spot + instance diversification — the wave sibling EC2 Spot Instances: Savings & Interruptions. This article is the troubleshooting capstone that ties them together: when scaling misbehaves, the fault is almost always in one of those adjacent layers, surfacing as a flat desired count.
Core concepts
Before you can debug the loop you have to see it as a loop. An ASG is a controller with three numbers, a set of policies that move the middle number, and a health system that replaces instances that die. Get these definitions crisp and every symptom maps to a moving part.
The three sizes. An ASG is bounded by MinSize (never fewer), MaxSize (never more), and steered to DesiredCapacity (the target it drives toward). Scaling is the act of changing DesiredCapacity — everything else is machinery to decide the new value and to make reality match it. The single most important invariant: DesiredCapacity is always clamped to [MinSize, MaxSize]. A policy can compute “go to 8,” but if MaxSize is 4, desired becomes 4 — silently.
| Size | Meaning | Failure mode it causes | How you notice |
|---|---|---|---|
MinSize |
Floor; ASG relaunches to stay ≥ this | Blocks scale-in below it (may be intentional) | Desired never drops below Min despite low load |
MaxSize |
Ceiling; desired clamps to it | Blocks scale-out silently — the #1 cause | Desired == Max, activity history empty |
DesiredCapacity |
The target the ASG drives to | If stuck == Max, no scale-out; if == Min, no scale-in | Compare against Min/Max first, always |
The policy types. A scaling policy decides the new DesiredCapacity. There are five ways to drive it, and they behave very differently when something goes wrong.
| Policy type | How it decides | Cooldown / warmup model | Best for | Classic failure |
|---|---|---|---|---|
| Target tracking | Keeps a metric at a target (e.g. CPU 50%); AWS creates hidden alarms | Instance warmup (no simple cooldown) | Most web/API fleets | Target set too high → never scales out |
| Step scaling | Metric bands → step adjustments (+1 at 60%, +3 at 80%) | Instance warmup per policy | Aggressive/graduated response | Overlapping steps or wrong alarm |
| Simple scaling | One alarm → one adjustment, then wait | Cooldown (default 300s) blocks all actions | Legacy; avoid for new work | Cooldown swallows the next action |
| Scheduled action | Time-based change to Min/Max/Desired | n/a | Predictable daily/weekly cycles | Wrong timezone; Min override pins Desired |
| Predictive scaling | ML forecast provisions ahead of load | Runs alongside dynamic policies | Cyclical, forecastable demand | Forecast + MaxCapacityBreachBehavior caps it |
The alarm. For step and simple scaling you create a CloudWatch alarm and attach the policy to it. For target tracking, AWS creates and manages the alarms for you (you never see them in your IaC, but they exist in the console). An alarm has three states — OK, ALARM, INSUFFICIENT_DATA — and only a transition into ALARM fires a scale-out policy. This is why a dead metric (which parks the alarm in INSUFFICIENT_DATA) means nothing scales, even though nothing is technically “broken.”
Health checks and the grace period. An ASG continuously checks each instance’s health and replaces any it deems unhealthy. The health-check type decides what “healthy” means: EC2 (the instance status checks) or ELB (the load balancer’s health check) or a custom signal. The HealthCheckGracePeriod is how long after launch the ASG ignores health results, giving the app time to boot. Get this too short with ELB health checks and you get the kill loop: launch → not-yet-ready → “unhealthy” → terminate → relaunch, forever.
Cooldown vs warmup. A cooldown (simple scaling) is a group-wide pause after any action during which no further action fires. An instance warmup (step + target tracking) is per-instance: a newly launched instance’s metrics are excluded from the aggregate until it has warmed up, so a cold instance’s 100% CPU doesn’t trigger a runaway scale-out. Confusing the two is a common source of “why did it only scale once?”
Suspended processes. An ASG runs nine internal processes (Launch, Terminate, HealthCheck, ReplaceUnhealthy, AZRebalance, AlarmNotification, ScheduledActions, AddToLoadBalancer, InstanceRefresh). Any can be suspended — by you, or automatically during an instance refresh. A suspended Launch means the group cannot add instances; a suspended AlarmNotification means alarms are ignored entirely. This is the trap that survives across incidents.
Activity history. Every attempt the ASG makes — successful or failed — is recorded as a scaling activity with a StatusCode, a StatusMessage, a Cause, and a Description. This is your black box. aws autoscaling describe-scaling-activities is the single most important command in this article: it tells you whether the group tried and failed (a Failed activity with the reason) or never tried at all (an empty history — look upstream at the alarm or the cap).
The commands you will live in during any scaling incident:
| Command | Answers the question | Key fields to read |
|---|---|---|
aws autoscaling describe-auto-scaling-groups |
What are Min/Desired/Max? What’s suspended? | MinSize, DesiredCapacity, MaxSize, SuspendedProcesses, HealthCheckType, HealthCheckGracePeriod |
aws autoscaling describe-scaling-activities |
Did it try? Did it fail? Why? | StatusCode, StatusMessage, Cause, Description |
aws autoscaling describe-policies |
What policies exist and what alarm drives them? | PolicyType, TargetTrackingConfiguration, Alarms, StepAdjustments |
aws cloudwatch describe-alarms |
Is the alarm in ALARM? Right threshold/metric? | StateValue, MetricName, Dimensions, Threshold, Period, EvaluationPeriods |
aws autoscaling describe-scheduled-actions |
Is a schedule pinning Min/Max/Desired? | Recurrence, TimeZone, MinSize, MaxSize, DesiredCapacity |
aws ec2 describe-instances |
Are launched instances actually running? | State, SubnetId, AvailabilityZone |
Instance lifecycle states. An instance inside an ASG moves through a lifecycle, and two of these states are quiet “won’t scale/serve” causes — an instance in Standby is still counted toward DesiredCapacity but receives no traffic and isn’t health-managed, and one stuck in Pending:Wait is being held by a lifecycle hook that never completed.
| Lifecycle state | Meaning | Troubleshooting relevance |
|---|---|---|
Pending |
Launching, not yet ready | Normal, transient |
Pending:Wait |
Held by a launch lifecycle hook | Stuck here = a hook never signalled → launches stall |
Pending:Proceed |
Hook completed, finishing launch | Transient |
InService |
Live, health-managed, registered to the LB | The healthy steady state |
Standby |
Deliberately removed from service by you | Counted in Desired but gets no traffic, not health-checked — a silent “why isn’t it serving” |
Terminating |
Being removed | Normal on scale-in |
Terminating:Wait |
Held by a terminate lifecycle hook | Stuck here = scale-in / replacement stalls |
Terminating:Proceed |
Hook completed, finishing terminate | Transient |
EnteringStandby |
Transitioning into Standby | Transient |
Detaching |
Being removed from the ASG (not terminated) | Detached instances no longer scale or count |
The scaling control loop, end to end
Here is the whole loop and, at each hop, the thing that can make the signal die. Debugging is nothing more than walking this table top to bottom and finding the first hop where the answer is “no.”
| # | Hop | What must be true | If it isn’t → symptom | Confirm with |
|---|---|---|---|---|
| 1 | Metric exists and reports | The right metric is publishing datapoints | Alarm goes INSUFFICIENT_DATA; nothing fires |
aws cloudwatch get-metric-statistics |
| 2 | Alarm transitions to ALARM | Threshold crossed for evaluation-periods |
Never scales out | describe-alarms → StateValue |
| 3 | Policy is attached and enabled | The alarm’s action points at a live policy | Alarm rings, nothing acts | describe-policies → Alarms |
| 4 | Group has headroom | Desired < Max (out) / Desired > Min (in) |
Silent no-op | describe-auto-scaling-groups |
| 5 | Process not suspended | Launch/Terminate not in SuspendedProcesses |
No add/remove | describe-auto-scaling-groups |
| 6 | Launch succeeds | Capacity + quota + subnet + template valid | Desired rises, InService doesn’t | describe-scaling-activities → Failed |
| 7 | Health passes in grace | Instance healthy before grace ends | Kill loop; churn | describe-scaling-activities → Terminating |
The very first fork — before you read any config — is this one question, answered by describe-scaling-activities:
| What the activity history shows | It means | Go to |
|---|---|---|
| Empty (no recent activities) | The group never tried to scale | The alarm (hops 1–3) or the cap (hop 4) or a suspended process (hop 5) |
Activities with StatusCode = Successful but you wanted more |
It scaled, then stopped | Cooldown/warmup, or it hit Max, or the target is satisfied |
Activities with StatusCode = Failed |
It tried and EC2 refused | The launch failure reference (hop 6) — read StatusMessage |
Terminating seconds after Launching, repeating |
Health-check kill loop | The health section (hop 7) |
Internalise that fork and you have already halved every future incident: “did it try?” An empty history sends you upstream to the trigger and the cap; a Failed history sends you downstream to the launch. People waste hours because they never ask it.
Failure class 1 — the CloudWatch alarm never fires
For step and simple scaling, a scale-out that never happens usually means the alarm never entered ALARM. There are more ways to misconfigure an alarm than any other single object in this loop, so enumerate them.
| Misconfiguration | What you see | How to confirm | Fix |
|---|---|---|---|
| Wrong metric name | Alarm watches CPUCreditBalance, not CPUUtilization |
describe-alarms → MetricName |
Point at the intended metric |
| Wrong dimensions | Alarm scoped to one instance ID, not the ASG | describe-alarms → Dimensions |
Use AutoScalingGroupName dimension for fleet metrics |
| Threshold never crossed | CPU peaks at 68%, threshold is 70% | Overlay metric vs threshold | Lower the threshold or change the metric |
Period × EvaluationPeriods too long |
5-min period × 3 = 15 min to react; spike is over | describe-alarms → Period, EvaluationPeriods |
Shorten period (60s) and/or evaluation periods |
INSUFFICIENT_DATA |
Metric stopped publishing (instance gone, agent dead) | StateValue = INSUFFICIENT_DATA |
Fix the source, or set TreatMissingData |
| Wrong statistic | Maximum when you meant Average (or vice-versa) |
describe-alarms → Statistic |
Match the statistic to the intent |
| Aggregated away the hot instance | Average CPU across 10 nodes hides one at 100% |
Compare per-instance vs ASG average | Alarm on Maximum, or per-target metric |
DatapointsToAlarm (M-of-N) too strict |
3-of-3 needed; you get 2 breaching, 1 gap | describe-alarms → DatapointsToAlarm |
Loosen to M-of-N (e.g. 2 of 3) |
| Alarm disabled / no action | ActionsEnabled=false or empty AlarmActions |
describe-alarms → ActionsEnabled, AlarmActions |
Enable actions; attach the policy ARN |
ComparisonOperator inverted |
LessThanThreshold on a scale-out alarm |
describe-alarms → ComparisonOperator |
Use GreaterThanThreshold for scale-out |
The two that fool experienced engineers are INSUFFICIENT_DATA and aggregation. INSUFFICIENT_DATA is not an error state — it means the alarm has no datapoints to evaluate, most often because the metric source disappeared (an instance terminated, the CloudWatch agent died, or the metric is only emitted under load and there’s currently none). A scale-out alarm parked in INSUFFICIENT_DATA will not fire, and the default TreatMissingData behaviour (missing) keeps it there. The aggregation trap is subtler: if you alarm on the Average CPUUtilization across an ASG dimension, one instance pinned at 100% while nine idle at 10% yields an average of 19% — far below any sane threshold — so the fleet “isn’t scaling” while one box melts. For uneven load, alarm on the Maximum, or on a per-request metric like ALB RequestCountPerTarget, not the fleet average.
The alarm’s TreatMissingData setting decides what a gap in datapoints does — and the default (missing) is exactly what parks a scale-out alarm in INSUFFICIENT_DATA when the metric goes quiet:
TreatMissingData |
A missing datapoint is treated as | Effect on a scale-out alarm |
|---|---|---|
missing (default) |
Neither breaching nor not-breaching | Can sit in INSUFFICIENT_DATA → never fires |
notBreaching |
Within threshold (good) | Won’t false-fire, but also won’t scale on a gap |
breaching |
Breaching (bad) | Fires on missing data — noisy but catches a dead metric |
ignore |
Retains the current state | Alarm holds its last state through the gap |
Reaction time is a function you can compute. Period × EvaluationPeriods is the minimum time an alarm needs breaching datapoints before it fires:
| Period | EvaluationPeriods | DatapointsToAlarm | Fastest reaction | Use when |
|---|---|---|---|---|
| 60s | 1 | 1 | ~1 min | Spiky, need fast out (accept flapping) |
| 60s | 3 | 2 | ~2–3 min | Balanced default for web tiers |
| 60s | 5 | 5 | ~5 min | Smooth, avoids flapping on blips |
| 300s | 3 | 3 | ~15 min | Too slow for spikes — a common bug |
| 10s (high-res) | 3 | 2 | ~20–30s | Latency-critical, high-res custom metric |
Create a proper scale-out alarm and policy with both CLI and Terraform. In CLI (step scaling):
# Step-scaling policy: +2 instances when it fires
POLICY_ARN=$(aws autoscaling put-scaling-policy \
  --auto-scaling-group-name web-asg \
  --policy-name scale-out-cpu \
  --policy-type StepScaling \
  --adjustment-type ChangeInCapacity \
  --step-adjustments MetricIntervalLowerBound=0,ScalingAdjustment=2 \
  --estimated-instance-warmup 120 \
  --query PolicyARN --output text)

# Alarm on the ASG-average CPU, 60s period, 2-of-3 → fires the policy
aws cloudwatch put-metric-alarm \
  --alarm-name web-asg-cpu-high \
  --namespace AWS/EC2 --metric-name CPUUtilization \
  --dimensions Name=AutoScalingGroupName,Value=web-asg \
  --statistic Average --period 60 \
  --evaluation-periods 3 --datapoints-to-alarm 2 \
  --threshold 70 --comparison-operator GreaterThanThreshold \
  --treat-missing-data notBreaching \
  --alarm-actions "$POLICY_ARN"
resource "aws_autoscaling_policy" "scale_out" {
  name                   = "scale-out-cpu"
  autoscaling_group_name = aws_autoscaling_group.web.name
  policy_type            = "StepScaling"
  adjustment_type        = "ChangeInCapacity"
  estimated_instance_warmup = 120
  step_adjustment {
    scaling_adjustment          = 2
    metric_interval_lower_bound = 0
  }
}

resource "aws_cloudwatch_metric_alarm" "cpu_high" {
  alarm_name          = "web-asg-cpu-high"
  namespace           = "AWS/EC2"
  metric_name         = "CPUUtilization"
  dimensions          = { AutoScalingGroupName = aws_autoscaling_group.web.name }
  statistic           = "Average"
  period              = 60
  evaluation_periods  = 3
  datapoints_to_alarm = 2
  threshold           = 70
  comparison_operator = "GreaterThanThreshold"
  treat_missing_data  = "notBreaching"
  alarm_actions       = [aws_autoscaling_policy.scale_out.arn]
}
Failure class 2 — already at max capacity (the silent #1)
This is the number-one cause and it is invisible. The policy fires correctly, computes a new DesiredCapacity of, say, 8, the ASG clamps it to MaxSize (4), and — critically — records nothing. No failed activity. No alarm. No log line saying “I wanted more but I’m capped.” The activity history for the spike window is simply empty, and the desired count sits pinned at max. Engineers stare at a working alarm and a working policy and conclude the machinery is broken, when the machinery did exactly what it was told: it cannot exceed MaxSize.
The clamp is pure arithmetic. Walk these examples and the silence makes sense:
| Current Desired | Max | Policy computes | Actual new Desired | Activity recorded? | Result |
|---|---|---|---|---|---|
| 4 | 4 | 6 | 4 (clamped) | No | Silent no-op — the trap |
| 3 | 4 | 6 | 4 | Yes (3→4) | Scales the one it can, then silent |
| 2 | 4 | 3 | 3 | Yes (2→3) | Normal scale-out |
| 4 | 10 | 6 | 6 | Yes (4→6) | Normal — headroom exists |
| 1 | 1 | 2 | 1 | No | Min==Max==Desired: pinned, silent |
Confirming it takes ten seconds — and it should be your second command after describe-scaling-activities comes back empty:
aws autoscaling describe-auto-scaling-groups \
  --auto-scaling-group-names web-asg \
  --query 'AutoScalingGroups[0].{Min:MinSize,Desired:DesiredCapacity,Max:MaxSize,InService:length(Instances)}'
# { "Min": 2, "Desired": 4, "Max": 4, "InService": 4 }   ← Desired == Max: this is the whole bug
The fix is to raise MaxSize — but the real fix is to make the cap never silent again by alarming on it. CloudWatch publishes GroupDesiredCapacity and GroupMaxSize in AWS/AutoScaling (you must enable group metrics collection); an alarm on GroupDesiredCapacity >= GroupMaxSize for a few minutes turns the #1 silent failure into a page.
# Raise the ceiling
aws autoscaling update-auto-scaling-group \
  --auto-scaling-group-name web-asg --max-size 10

# Enable group metrics so you can even see the cap
aws autoscaling enable-metrics-collection \
  --auto-scaling-group-name web-asg --granularity "1Minute"
resource "aws_autoscaling_group" "web" {
  name             = "web-asg"
  min_size         = 2
  desired_capacity = 4
  max_size         = 10            # headroom — not equal to desired
  enabled_metrics  = ["GroupDesiredCapacity", "GroupMaxSize", "GroupInServiceInstances"]
  # ...
}
A related, equally silent variant: MinSize blocking scale-in. If the group won’t shrink after the spike, check Desired > Min. When Desired == Min, scale-in is a no-op by design, and — like the max case — it records nothing. Half of “why won’t it scale in” tickets are simply Min set higher than anyone remembers.
Failure class 3 — cooldown and warmup block the next action
You watched it scale out once, then nothing, even though load kept climbing. That is usually cooldown (simple scaling) or instance warmup (step/target tracking) doing its job — suppressing the next action so a single spike doesn’t stampede the fleet. The failure is not that they exist; it’s that they’re set too long, or that you expected the wrong one.
| Mechanism | Applies to | Scope | Default | What it blocks |
|---|---|---|---|---|
| Cooldown | Simple scaling | Group-wide | 300s | All scaling actions until it expires |
| Instance warmup | Step + target tracking | Per new instance | Policy EstimatedInstanceWarmup / DefaultInstanceWarmup |
Excludes the instance’s metrics from the aggregate while warming |
| Scale-in cooldown (TT) | Target tracking | Group-wide | none by default | Optional delay before scale-in |
The distinction that trips people: cooldown pauses the whole group (so simple scaling truly does nothing for 300s after any action), while warmup does not pause scaling — it just stops a cold, briefly-100%-CPU instance from being counted, so the aggregate metric settles correctly. If you’re on simple scaling and see exactly one action per five minutes, the cooldown is the cause; switch to target tracking or step scaling, which react continuously and use warmup instead of a blunt global pause.
# Simple-scaling policy carrying a 300s cooldown (the blocker)
aws autoscaling put-scaling-policy \
  --auto-scaling-group-name web-asg --policy-name simple-out \
  --policy-type SimpleScaling --adjustment-type ChangeInCapacity \
  --scaling-adjustment 2 --cooldown 60      # shorten to 60s, or move off simple scaling

# See "in cooldown" notes in the activity history
aws autoscaling describe-scaling-activities --auto-scaling-group-name web-asg \
  --query 'Activities[].{T:StartTime,S:StatusCode,C:Cause}' --output table
The default instance warmup is now taken from the group-level DefaultInstanceWarmup if set (recommended), overriding per-policy EstimatedInstanceWarmup. Set it to your app’s real boot-to-ready time. Too short and cold instances skew the metric (causing over-scaling); too long and the group is sluggish to react to genuine, sustained load.
The default timings and where each is configured, so you know which knob you’re actually turning:
| Timing setting | Applies to | Default | Where set |
|---|---|---|---|
| Simple-scaling cooldown | Simple scaling | 300s | Policy --cooldown or group DefaultCooldown |
EstimatedInstanceWarmup |
Step / target tracking | Falls back to DefaultInstanceWarmup |
Per policy |
DefaultInstanceWarmup |
Whole group (all dynamic policies) | Unset until you set it (recommended) | Group attribute |
| Target-tracking scale-in cooldown | Target tracking | None | target_tracking_configuration |
Predictive SchedulingBufferTime |
Predictive scaling | Provisions ahead of forecast | Predictive policy |
Failure class 4 — target-tracking internals
Target tracking feels like magic — “keep CPU at 50%” — precisely because it hides its machinery, and hidden machinery is hard to debug. Three things you cannot see are the usual culprits.
It creates hidden alarms. When you attach a target-tracking policy, AWS silently creates two CloudWatch alarms in your account — a high alarm to scale out and a low alarm to scale in — named like TargetTracking-web-asg-AlarmHigh-<uuid>. You did not write them, they aren’t in your Terraform, but they run your scaling. If someone deletes them by hand, or a cleanup script prunes “orphan” alarms, scaling quietly dies.
| Hidden object | Name pattern | Role | If deleted/broken |
|---|---|---|---|
| High alarm | TargetTracking-<asg>-AlarmHigh-* |
Fires scale-out | Never scales out |
| Low alarm | TargetTracking-<asg>-AlarmLow-* |
Fires scale-in | Never scales in |
| Managed policy | your policy name | Owns both alarms | Recreates alarms on update |
A too-high target never triggers. Target tracking scales out to pull the metric down to the target. If you set the target to CPUUtilization = 90%, the group only adds capacity when CPU exceeds 90% — so a fleet cruising at 85% is, by design, “at target” and will never scale out, even though it’s clearly hot. Target tracking also scales out faster than it scales in (it’s cautious about removing capacity), so a too-high target combined with steady load looks exactly like “won’t scale.”
| Target-tracking symptom | Root cause | Fix |
|---|---|---|
| Never scales out under obvious load | Target set too high (e.g. 90%) | Lower to a realistic target (40–60%) |
| Scales out but never in | Scale-in is intentionally conservative / disable_scale_in=true |
Check DisableScaleIn; allow scale-in |
| Two TT policies oscillate | Two policies on correlated metrics fighting | Consolidate to one metric or use step scaling |
| Scales on CPU but load is I/O | Wrong predefined metric | Use ALBRequestCountPerTarget or a custom metric |
| Ignores a hot instance | ASGAverageCPUUtilization is an average |
Custom metric on Maximum, or per-target |
Two policies fighting. If you attach two target-tracking policies on correlated metrics — say CPU and network — they can issue contradictory desired counts and the group oscillates or stalls. AWS’s rule is that when multiple policies apply, the ASG picks the one that yields the largest capacity for scale-out (safe) but this still produces confusing behaviour when policies disagree on scale-in. Prefer one dominant metric per group.
The predefined metrics you can target-track on — pick the one that actually reflects your bottleneck:
| Predefined metric spec | Tracks | Good for | Not for |
|---|---|---|---|
ASGAverageCPUUtilization |
Fleet-average CPU | CPU-bound web/app tiers | I/O- or memory-bound apps |
ASGAverageNetworkIn |
Bytes in per instance | Ingest/upload workloads | CPU work |
ASGAverageNetworkOut |
Bytes out per instance | Streaming/download tiers | CPU work |
ALBRequestCountPerTarget |
Requests per target | Request-driven APIs behind an ALB | Non-ALB workloads |
| Custom metric spec | Any metric (queue depth, RPS, latency) | SQS workers, custom KPIs | — |
resource "aws_autoscaling_policy" "cpu_tt" {
  name                   = "cpu-target-50"
  autoscaling_group_name = aws_autoscaling_group.web.name
  policy_type            = "TargetTrackingScaling"
  target_tracking_configuration {
    predefined_metric_specification {
      predefined_metric_type = "ASGAverageCPUUtilization"
    }
    target_value     = 50      # NOT 90 — too high never triggers
    disable_scale_in = false   # true here is a frequent "won't scale in" cause
  }
}
For an SQS-worker fleet, target-track on a custom metric like ApproximateNumberOfMessagesVisible / instance (backlog per worker), because CPU may stay low while the queue explodes — a textbook “CPU-based scaling won’t scale” bug.
Failure class 5 — the launch fails
Now the downstream half. DesiredCapacity went up — you can see it rise — but the InService count doesn’t follow, and describe-scaling-activities shows StatusCode = Failed. EC2 refused to launch. The StatusMessage/Cause names the reason exactly; this is the reference table to match it against.
| Failure | Activity StatusMessage (excerpt) | Root cause | Confirm | Fix |
|---|---|---|---|---|
| Insufficient Capacity (ICE) | We currently do not have sufficient <type> capacity in the Availability Zone |
AWS is out of that type in that AZ right now | Activity Failed; try another AZ/type |
Diversify types + AZs (mixed instances); retry; Capacity Reservation |
| vCPU quota | You have requested more vCPU capacity than your current vCPU limit of N / VcpuLimitExceeded |
Service quota for the instance family hit | Service Quotas console; Failed activity |
Request a quota increase (see quotas article) |
| Subnet full | There are not enough free addresses in subnet <id> / InsufficientFreeAddressesInSubnet |
Subnet CIDR exhausted of private IPs | describe-subnets → AvailableIpAddressCount |
Add larger/more subnets; free IPs |
| Invalid AMI | The image id '[ami-...]' does not exist / InvalidAMIID.NotFound |
AMI deregistered, wrong region, or private | Check launch template AMI vs region | Update template to a valid AMI |
| Invalid instance profile | Invalid IAM Instance Profile name / not authorized iam:PassRole |
Profile deleted, wrong name, or missing PassRole | Template IamInstanceProfile; IAM policy |
Fix the profile ARN; grant iam:PassRole |
| Missing key pair | The key pair '<name>' does not exist / InvalidKeyPair.NotFound |
Key referenced by template deleted/other region | Template KeyName |
Recreate/point to a valid key (or drop it — use SSM) |
| Unsupported type in AZ | Your requested instance type <type> is not supported in your requested AZ |
That type isn’t offered in that AZ | describe-instance-type-offerings |
Choose an AZ that offers it, or another type |
| Spot capacity | Could not launch Spot Instances. There is no Spot capacity available |
No Spot capacity / max price too low | Spot request history; Failed activity |
Raise max price; diversify types; capacity-optimized |
| Invalid launch template version | You must use a valid fully-formed launch template |
Bad template version / referenced default deleted | describe-launch-template-versions |
Pin a valid $Latest/$Default version |
| SG/subnet mismatch | Security group <id> and subnet <id> belong to different networks |
SG in a different VPC than the subnet | Compare VPC IDs | Use an SG in the subnet’s VPC |
| EBS/encryption/KMS | Client.InternalError on encrypted AMI |
ASG role can’t use the KMS key for the encrypted AMI | KMS key policy | Grant the service-linked role KMS access |
| Instance profile propagation | Transient Invalid IAM Instance Profile right after creation |
New profile not yet propagated | Retry after ~30–60s | Add a depends_on/wait after creating the profile |
Three of these deserve emphasis. ICE (Insufficient Capacity) is the one you cannot fix with configuration on your side — AWS genuinely has no spare m5.24xlarge in ap-south-1a at that moment. The engineering answer is diversification: an ASG with a mixed instances policy across several instance types and all AZs, using a capacity-optimized allocation strategy, so the launch succeeds on whatever is available instead of insisting on one type in one AZ. vCPU quota looks identical from the app’s view (instances just don’t appear) but the StatusMessage says “vCPU limit”; the fix is a quota-increase request, and the prevention is a CloudWatch alarm on the AWS/Usage vCPU metric at ~80% of the limit. Invalid instance profile is the launch failure engineers cause most often themselves: they delete or rename an IAM role a launch template still references, or forget iam:PassRole, and every launch fails instantly — you’ll reproduce exactly this in the lab.
The ICE fix as a mixed-instances ASG:
resource "aws_autoscaling_group" "web" {
  name                = "web-asg"
  min_size            = 2
  desired_capacity    = 4
  max_size            = 12
  vpc_zone_identifier = [aws_subnet.a.id, aws_subnet.b.id, aws_subnet.c.id]  # all AZs

  mixed_instances_policy {
    instances_distribution {
      on_demand_base_capacity                  = 2
      on_demand_percentage_above_base_capacity = 50
      spot_allocation_strategy                 = "capacity-optimized"   # dodges ICE
    }
    launch_template {
      launch_template_specification {
        launch_template_id = aws_launch_template.web.id
        version            = "$Latest"
      }
      override { instance_type = "m5.large" }
      override { instance_type = "m5a.large" }   # diversify family
      override { instance_type = "m6i.large" }
      override { instance_type = "m5n.large" }
    }
  }
}
When you diversify to dodge ICE, the allocation strategy decides how the ASG picks from your instance-type overrides. Capacity-optimized (or price-capacity-optimized) is the ICE-avoidance default because it launches where capacity actually exists:
| Allocation strategy | Picks | Best for | ICE / interruption risk |
|---|---|---|---|
price-capacity-optimized |
Balances price and available capacity | Cost + stability (recommended default) | Low |
capacity-optimized |
Pools with the most spare capacity | Avoiding ICE and Spot interruptions | Lowest interruption |
capacity-optimized-prioritized |
Capacity, honouring your type order | Preferred types first, still capacity-aware | Low |
lowest-price |
The cheapest N pools | Pure cost, interruption-tolerant batch | Higher |
diversified (Spot Fleet) |
Spread evenly across all pools | Maximum spread | Low, but not capacity-aware |
Failure class 6 — the health-check kill loop
This one masquerades. The group is launching — repeatedly — but every new instance is terminated within a minute or two and relaunched, so the InService count never grows and it presents as “won’t scale.” The activity history is the giveaway: alternating Launching and Terminating entries, the terminations reading “instance failed ELB health checks.”
The mechanism: you set HealthCheckType = ELB (so the ASG honours the load balancer’s opinion of health), but the HealthCheckGracePeriod is shorter than the app’s real boot time. The instance launches, the ALB health check hits /healthz before the app is listening, marks it unhealthy, and the ASG — no longer in the grace window — dutifully replaces the “unhealthy” instance. Boot, fail, kill, repeat.
| Cause of the kill loop | How to confirm | Fix |
|---|---|---|
| Grace period < boot time | Activities: Terminating … failed ELB health checks ~grace seconds after launch |
Raise HealthCheckGracePeriod above true boot (e.g. 300s) |
| Health path wrong (404/302) | describe-target-health → Target.ResponseCodeMismatch |
Fix path or widen the matcher |
| Health-check port not listening | Target.Timeout / connection refused |
Open SG; ensure app binds the port |
| App boots slower than expected | Boot logs vs grace period | Increase grace; speed boot; use a warm AMI |
ELB type but no LB attached |
HealthCheckType=ELB, target group empty |
Attach the target group, or use EC2 type |
| Health check hits a heavy route | Target flaps under load | Point health check at a light /healthz |
The two health-check types behave very differently, and choosing ELB without a matching grace period is the trap:
| Health-check type | “Healthy” means | Detects app-level failure? | Kill-loop risk |
|---|---|---|---|
EC2 (default) |
Instance status checks pass (hypervisor + OS reachable) | No — a hung app on a running instance is “healthy” | Low; but masks app death |
ELB |
Instance passes the load balancer’s health check | Yes — real app health | High if grace period too short |
Custom (set-instance-health) |
Whatever your automation reports | Yes, on your terms | Depends on your logic |
The kill loop is really a race between two clocks — the app’s boot-to-healthy time and the health check’s time-to-unhealthy (Interval × UnhealthyThreshold). These are the tunables on both sides of that race:
| Setting | Where | Effect on the kill loop |
|---|---|---|
HealthCheckGracePeriod |
ASG | The primary fix — must exceed real boot-to-healthy time |
Health check Interval |
Target group | How often the LB probes (e.g. 30s) |
UnhealthyThreshold |
Target group | Consecutive fails before “unhealthy” (× interval = time-to-unhealthy) |
HealthyThreshold |
Target group | Consecutive passes before “healthy” — slows recovery if high |
Health check Timeout |
Target group | Per-probe timeout; too low flaps a slow-but-alive app |
Matcher (success codes) |
Target group | Must match what /healthz actually returns (200) |
# The fix is almost always: raise the grace period above real boot time
aws autoscaling update-auto-scaling-group \
  --auto-scaling-group-name web-asg \
  --health-check-type ELB \
  --health-check-grace-period 300      # was 60s and shorter than a 150s boot
resource "aws_autoscaling_group" "web" {
  # ...
  health_check_type         = "ELB"
  health_check_grace_period = 300   # MUST exceed boot-to-first-healthy time
}
The subtle version: EC2 health checks are too lenient (a wedged app on a running box is “healthy,” so the ASG never replaces it and the ALB serves errors), while ELB health checks with a short grace are too strict (the kill loop). The correct posture is ELB health checks plus a grace period comfortably above your measured boot time, and a health endpoint that returns 200 only when the app is genuinely ready.
Failure class 7 — schedules, protection, termination and suspended processes
The last family isn’t about metrics at all — it’s about the group’s governance settings quietly overriding or disabling scaling.
Suspended processes. Any of nine processes can be suspended, and a suspended process is a silent kill switch. The most damaging are Launch, Terminate, and AlarmNotification.
| Process | Suspending it means | Symptom |
|---|---|---|
Launch |
ASG cannot add instances | Never scales out, no launch activities |
Terminate |
ASG cannot remove instances | Never scales in; unhealthy nodes never replaced |
AlarmNotification |
Alarms are ignored | Dynamic scaling entirely dead |
ScheduledActions |
Scheduled changes don’t apply | Time-based scaling silent |
HealthCheck |
Health status not updated | Unhealthy instances not caught |
ReplaceUnhealthy |
Unhealthy instances not replaced | Fleet degrades silently |
AZRebalance |
No rebalancing across AZs | Skew after an AZ event |
AddToLoadBalancer |
New instances not registered to the LB | Scales but new nodes get no traffic |
InstanceRefresh |
Refreshes can’t run | Rollouts stall |
The trap is that an instance refresh automatically suspends certain processes while it runs, and a refresh that fails or is cancelled mid-flight can leave them suspended. Days later, scaling is dead and nobody remembers the refresh. Always check:
aws autoscaling describe-auto-scaling-groups --auto-scaling-group-names web-asg \
  --query 'AutoScalingGroups[0].SuspendedProcesses'
# [] means none suspended. Anything here is a prime suspect.

# Resume the ones you didn't mean to suspend
aws autoscaling resume-processes --auto-scaling-group-name web-asg \
  --scaling-processes Launch Terminate AlarmNotification
Scheduled actions override Min/Max/Desired at a point in time, and their two classic bugs are timezone and ordering/pinning. A scheduled action with no TimeZone runs in UTC — so an action meant for 8 a.m. IST fires at 1:30 p.m. IST. And a scheduled action that sets MinSize = 10 will pin desired at 10 and block any scale-in below it until the next action changes Min.
| Scheduled-action gotcha | Effect | Fix |
|---|---|---|
No TimeZone set |
Runs in UTC, not local | Set TimeZone (e.g. Asia/Kolkata) |
Sets MinSize high |
Pins Desired up; blocks scale-in | Set Desired, not Min, for a temporary bump |
| Overlapping recurrences | Later action clobbers earlier | Order and space cron recurrences |
One-off StartTime in the past |
Never runs | Use a future time or Recurrence |
| Action disabled/deleted | Expected change never happens | describe-scheduled-actions to verify |
resource "aws_autoscaling_schedule" "morning_bump" {
  scheduled_action_name  = "morning-bump"
  autoscaling_group_name = aws_autoscaling_group.web.name
  recurrence             = "0 8 * * MON-FRI"
  time_zone              = "Asia/Kolkata"   # without this it's UTC
  min_size               = 2                 # keep Min low
  desired_capacity       = 8                 # bump Desired, not Min
  max_size               = 12
}
Scale-in protection and termination policy. Instance scale-in protection stops the ASG from terminating a protected instance during scale-in; if every instance is protected (e.g. NewInstancesProtectedFromScaleIn = true set group-wide), scale-in can do nothing and desired stays high. The termination policy decides which instance to remove on scale-in; a misordered policy won’t block scale-in outright but can produce surprising choices (killing your newest instance first).
| Termination policy | Removes | Use when |
|---|---|---|
Default |
Balances AZ, then oldest launch config/template | General purpose |
OldestInstance |
Longest-running first | Regular refresh of old nodes |
NewestInstance |
Most-recent first | Testing a new launch template |
OldestLaunchTemplate |
Instances on the oldest template | Rolling template upgrades |
OldestLaunchConfiguration |
Oldest launch config | Legacy LC migrations |
ClosestToNextInstanceHour |
Nearest the billing hour | Cost-minimising (legacy hourly) |
AllocationStrategy |
Rebalances to the preferred mix | Mixed-instances / Spot fleets |
| Scale-in protection scope | Effect | Confirm |
|---|---|---|
Group-level NewInstancesProtectedFromScaleIn |
All new instances protected | describe-auto-scaling-groups → NewInstancesProtectedFromScaleIn |
| Per-instance protection | Only flagged instances protected | describe-auto-scaling-instances → ProtectedFromScaleIn |
| All instances protected | Scale-in cannot remove anyone | Desired stuck high after load drops |
Lifecycle hooks. One more governance trap sits between launch and InService: a lifecycle hook pauses an instance in Pending:Wait (or Terminating:Wait) until your automation signals CONTINUE. A hook whose automation never answers stalls scaling until the heartbeat times out, then abandons or continues per its default result — a launch that looks frozen for up to an hour.
| Lifecycle-hook aspect | Setting | “Won’t scale” failure it causes |
|---|---|---|
| Transition | autoscaling:EC2_INSTANCE_LAUNCHING |
Instance stuck in Pending:Wait if never signalled |
| Heartbeat timeout | HeartbeatTimeout (default 3600s) |
Launch appears frozen for up to an hour |
| Default result | ABANDON or CONTINUE |
ABANDON terminates the new instance → looks like “won’t scale” |
| Signal | complete-lifecycle-action |
A missing signal is the stall — automate it |
Reading the evidence: Activity History status codes
Everything above converges on one artefact: the scaling activity. Learn to read its StatusCode and you can classify any failure without guessing. These are the values you’ll see:
| StatusCode | Meaning | What it tells you |
|---|---|---|
PendingSpotBidPlacement |
Placing a Spot request | Spot flow in progress |
WaitingForSpotInstanceRequestId |
Awaiting Spot request ID | Spot provisioning |
WaitingForSpotInstanceId |
Spot request placed, awaiting instance | Spot capacity being found |
WaitingForInstanceId |
On-Demand launch issued, awaiting ID | Normal, transient |
PreInService |
Instance launched, not yet in service | Booting / registering |
InProgress |
Activity underway | Normal, transient |
WaitingForInstanceWarmup |
New instance warming up | Warmup in effect (metrics excluded) |
WaitingForELBConnectionDraining |
Draining before terminate | Graceful scale-in |
MidLifecycleAction |
Paused on a lifecycle hook | A hook is holding the instance |
Successful |
Completed | It worked |
Failed |
Could not complete | Read StatusMessage/Cause — this is the launch-failure reference |
Cancelled |
Superseded/cancelled | A newer activity replaced it |
A Failed activity carries the exact reason. Match its StatusMessage/Cause to this failure-code reference (the same causes as class 5, indexed for fast lookup during an incident):
| StatusMessage / Cause fragment | Class | One-line fix |
|---|---|---|
insufficient <type> capacity in the Availability Zone |
ICE | Diversify types + AZs (mixed instances) |
more vCPU capacity than your current vCPU limit / VcpuLimitExceeded |
Quota | Request a vCPU quota increase |
not enough free addresses in subnet / InsufficientFreeAddressesInSubnet |
Subnet | Add/enlarge subnets; free IPs |
image id '[ami-...]' does not exist / InvalidAMIID.NotFound |
AMI | Point template at a valid AMI |
Invalid IAM Instance Profile name |
Profile | Fix profile name/ARN |
not authorized to perform: iam:PassRole |
IAM | Grant iam:PassRole to the caller |
key pair '<name>' does not exist / InvalidKeyPair.NotFound |
Key | Fix/remove KeyName |
instance type <type> is not supported in your requested AZ |
AZ | Use an AZ that offers the type |
no Spot capacity available |
Spot | Raise max price; diversify; capacity-optimized |
valid fully-formed launch template |
Template | Pin a valid template version |
Security group ... and subnet ... belong to different networks |
VPC | Use SG in the subnet’s VPC |
failed ELB health checks (on Terminating) |
Health | Raise grace period; fix health path |
Pull the last failures in one command and read them like a log:
aws autoscaling describe-scaling-activities \
  --auto-scaling-group-name web-asg --max-items 10 \
  --query 'Activities[].{Time:StartTime,Status:StatusCode,Msg:StatusMessage,Cause:Cause}' \
  --output table
Architecture at a glance
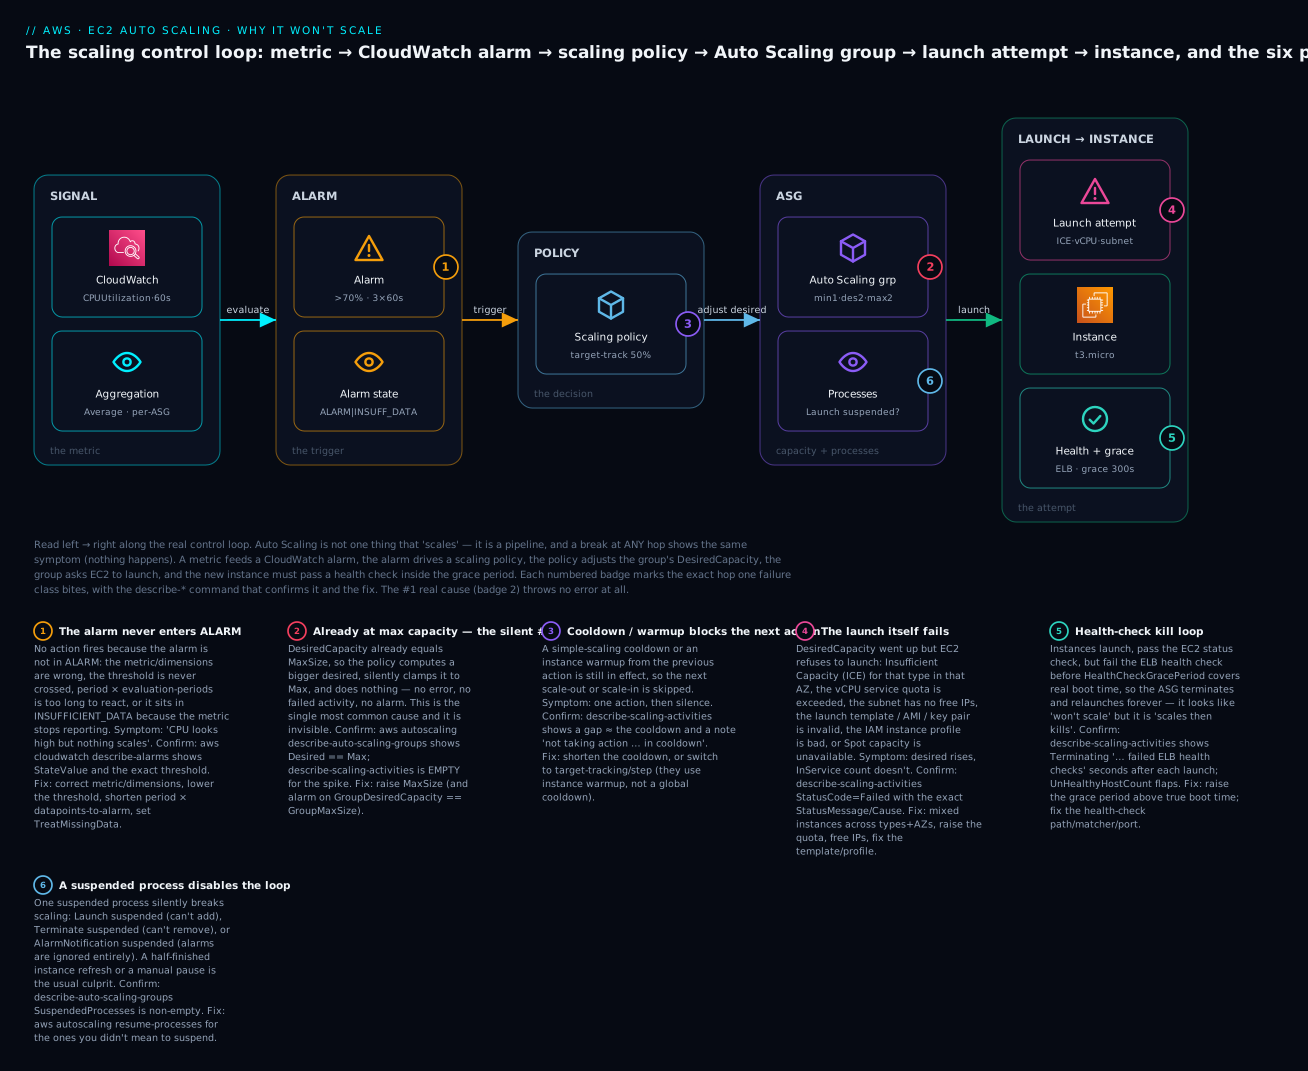
The diagram traces the real control loop left to right — metric → CloudWatch alarm → scaling policy → Auto Scaling group → launch attempt → instance — and drops a numbered badge at the exact hop each failure class bites. Follow the flow: a metric (CloudWatch, aggregated per-ASG) feeds an alarm whose failure to enter ALARM is badge 1; the alarm drives a scaling policy whose cooldown/warmup is badge 3; the policy raises the group’s DesiredCapacity, where the silent already-at-max cap is badge 2 and a suspended process is badge 6; the group asks EC2 to launch, where ICE, vCPU quota, a full subnet and a bad template are badge 4; and the new instance must pass a health check inside the grace period — the kill loop is badge 5. The legend narrates each number as symptom · confirm · fix, so the picture is both the architecture and the diagnostic map. The single most important reading habit the diagram encodes: run describe-scaling-activities first to learn whether the group tried and failed (badges 4–5, downstream) or never tried (badges 1–3, 6, upstream).
Real-world scenario
Trailhead Logistics runs a fleet of route-optimisation workers on an ASG behind an internal ALB in ap-south-1, normally 6 c5.xlarge instances, MaxSize 20. On the morning of a national sale, order volume tripled in twenty minutes. The dashboards lit up: queue depth climbing, CPU on every worker pinned near 100%. The ASG’s desired count moved from 6 to 9 — and then stopped. Requests started timing out. The on-call declared a Sev-2 and, reasonably, assumed the scaling policy was too timid, so they lowered the target-tracking target from 60% to 40% and redeployed. Desired didn’t budge. Twenty more minutes gone.
The engineer who fixed it ran the two commands in order. First, describe-scaling-activities — and it was not empty: it showed three Failed activities, each stamped We currently do not have sufficient c5.xlarge capacity in the Availability Zone you requested (ap-south-1a). This was ICE, not a policy problem. The group was pinned in a single AZ (a legacy vpc_zone_identifier with only one subnet) and hard-wired to one instance type. AWS simply had no more c5.xlarge in ap-south-1a during the region-wide sale spike. No target change on Earth would have helped — the launches were failing at the EC2 layer.
The immediate mitigation was surgical: they added the two other AZ subnets to the group (update-auto-scaling-group --vpc-zone-identifier with all three) and switched to a mixed instances policy overriding c5.xlarge, c5a.xlarge, c6i.xlarge, and m5.xlarge with a capacity-optimized allocation strategy. Within four minutes the next scaling activity succeeded — on c5a.xlarge in ap-south-1b, whatever had capacity — and desired climbed to 17 as the backlog drained.
The post-mortem changed three things. They made multi-AZ + multi-type the default for every worker ASG, because single-AZ single-type is an ICE incident waiting for a busy day. They added a CloudWatch alarm on failed scaling activities (via an EventBridge rule on the EC2 Instance Launch Unsuccessful event) so the next ICE pages with the cause attached instead of presenting as “won’t scale.” And they wrote the fork into the runbook as step one: describe-scaling-activities first — empty means look up at the alarm and the cap; Failed means read the EC2 reason. The three-hour outage would have been a five-minute diversification the moment someone read the activity history.
Advantages and disadvantages
Auto Scaling’s design — a decoupled control loop with rich activity history — is exactly what makes it both powerful and confusing to debug. The signals are all there; they’re just spread across six objects.
| Advantages (why the model works) | Disadvantages / gotchas |
|---|---|
| Decoupled loop: swap metrics/policies without touching the group | Six independent links; a break anywhere looks identical (nothing scales) |
describe-scaling-activities is a complete black box of every attempt |
The #1 failure (at Max) records nothing — silence by design |
| Target tracking is one line (“keep CPU at 50%”) | It hides its alarms and warmup — hard to see why it didn’t act |
| Clamps to Min/Max so a bad policy can’t launch 1,000 instances | The same clamp silently swallows legitimate scale-out |
| Mixed instances + allocation strategies dodge ICE | Requires up-front architecture; default single-type invites ICE |
| Health checks auto-replace dead instances | A short grace + ELB health = a kill loop that mimics “won’t scale” |
| Suspended processes let you pause safely for maintenance | A forgotten suspension (or failed refresh) is a silent kill switch |
| Scheduled + predictive handle known cycles | Timezone/Min-pinning bugs make schedules misfire quietly |
The through-line: Auto Scaling is observable to the point of being self-diagnosing — but only if you read the activity history and the group’s own numbers first, instead of assuming “not scaling” means “the policy is wrong.”
Hands-on lab
You will reproduce two real “won’t scale” failures on purpose, read the exact evidence AWS records, and fix each — then tear it all down. First the silent already-at-max cap (the #1 cause), then a launch failure via a deliberately broken IAM instance profile, reading the Failed activity. This is free-tier-friendly (one t3.micro at a time), but ⚠️ running instances cost money — do the teardown at the end.
Step 0 — Prerequisites
aws sts get-caller-identity
export AWS_REGION=ap-south-1
export VPC=vpc-0abc...                          # a VPC
export SUBNETS="subnet-0aaa,subnet-0bbb"        # two subnets in two AZs
export AMI=$(aws ssm get-parameters --names \
  /aws/service/ami-amazon-linux-latest/al2023-ami-kernel-default-x86_64 \
  --query 'Parameters[0].Value' --output text)
echo "AMI=$AMI"
Step 1 — A launch template (valid, to start)
LT_ID=$(aws ec2 create-launch-template --launch-template-name asg-lab-lt \
  --launch-template-data "{\"ImageId\":\"$AMI\",\"InstanceType\":\"t3.micro\"}" \
  --query 'LaunchTemplate.LaunchTemplateId' --output text)
echo "LT_ID=$LT_ID"
Step 2 — An ASG with the trap baked in: max == desired
aws autoscaling create-auto-scaling-group \
  --auto-scaling-group-name asg-lab \
  --launch-template "LaunchTemplateId=$LT_ID,Version=\$Latest" \
  --min-size 1 --desired-capacity 2 --max-size 2 \
  --vpc-zone-identifier "$SUBNETS"
aws autoscaling enable-metrics-collection \
  --auto-scaling-group-name asg-lab --granularity "1Minute"

# Wait for the two instances to come InService
aws autoscaling describe-auto-scaling-groups --auto-scaling-group-names asg-lab \
  --query 'AutoScalingGroups[0].{Desired:DesiredCapacity,Max:MaxSize,InService:length(Instances)}'
# { "Desired": 2, "Max": 2, "InService": 2 }
Step 3 — Try to scale out, and watch the silence
# Ask for +2 via a simple set-desired above Max
aws autoscaling set-desired-capacity \
  --auto-scaling-group-name asg-lab --desired-capacity 4 || true
Expected: the command fails with New desired capacity 4 is above max capacity 2 if you set it directly. A policy wouldn’t error — it would clamp silently. Simulate the silent path by executing a scaling policy instead:
POLICY_ARN=$(aws autoscaling put-scaling-policy --auto-scaling-group-name asg-lab \
  --policy-name lab-out --policy-type SimpleScaling \
  --adjustment-type ChangeInCapacity --scaling-adjustment 2 \
  --query PolicyARN --output text)
aws autoscaling execute-policy --auto-scaling-group-name asg-lab --policy-name lab-out

# Now read the evidence: the activity history for the "scale-out"
aws autoscaling describe-scaling-activities --auto-scaling-group-name asg-lab \
  --max-items 5 --query 'Activities[].{S:StatusCode,C:Cause}' --output table
Expected: no new launch activity for the executed policy — the desired was already at Max (2), so it clamped to 2 and did nothing. describe-auto-scaling-groups still shows Desired: 2, Max: 2. This is the silent #1 cause reproduced. You have a working policy, a working execute call, and zero scaling — because of one number.
Step 4 — Fix it: raise MaxSize
aws autoscaling update-auto-scaling-group --auto-scaling-group-name asg-lab --max-size 4
aws autoscaling execute-policy --auto-scaling-group-name asg-lab --policy-name lab-out

aws autoscaling describe-scaling-activities --auto-scaling-group-name asg-lab \
  --max-items 3 --query 'Activities[].{S:StatusCode,D:Description}' --output table
# Now you see: Launching a new EC2 instance ...  (Desired went 2 -> 4)
Step 5 — Reproduce a launch failure: a bad instance profile
Create a new launch-template version that references an IAM instance profile that does not exist, then scale and read the Failed activity.
# A launch-template version pointing at a non-existent instance profile
aws ec2 create-launch-template-version --launch-template-id $LT_ID \
  --source-version 1 \
  --launch-template-data "{\"IamInstanceProfile\":{\"Name\":\"does-not-exist-profile\"}}"
aws ec2 modify-launch-template --launch-template-id $LT_ID --default-version 2

# Force a launch with the broken version: raise desired
aws autoscaling update-auto-scaling-group --auto-scaling-group-name asg-lab \
  --max-size 6 --desired-capacity 6
Wait ~60s, then read the Activity History:
aws autoscaling describe-scaling-activities --auto-scaling-group-name asg-lab \
  --max-items 5 \
  --query 'Activities[?StatusCode==`Failed`].{S:StatusCode,M:StatusMessage}' --output table
Expected: one or more Failed activities with a StatusMessage naming the bad profile — e.g. Invalid IAM Instance Profile name. DesiredCapacity shows 6, but the InService count is stuck at the instances launched on the good version. This is a launch failure reproduced, and you read the exact cause from the activity history — the same technique that solves an ICE or a quota incident.
Step 6 — Fix and confirm
# Point the default version back to the good one
aws ec2 modify-launch-template --launch-template-id $LT_ID --default-version 1
# New launches now use version 1 (no bad profile). Watch it recover:
aws autoscaling describe-scaling-activities --auto-scaling-group-name asg-lab \
  --max-items 5 --query 'Activities[].{S:StatusCode,D:Description}' --output table
Step 7 — Teardown ⚠️
aws autoscaling delete-auto-scaling-group --auto-scaling-group-name asg-lab \
  --force-delete                                   # terminates instances too
aws ec2 delete-launch-template --launch-template-id $LT_ID
Everything here is inside the free-tier compute envelope if you delete promptly, but instances billed per-second while running are the only cost — the --force-delete above terminates them.
The whole ASG + policy + launch template as Terraform, so you can reproduce the max-cap trap declaratively and flip it:
resource "aws_launch_template" "lab" {
  name_prefix   = "asg-lab-"
  image_id      = data.aws_ssm_parameter.al2023.value
  instance_type = "t3.micro"
}

resource "aws_autoscaling_group" "lab" {
  name                = "asg-lab"
  min_size            = 1
  desired_capacity    = 2
  max_size            = 2                # the trap: == desired. Change to 4 to fix.
  vpc_zone_identifier = var.subnet_ids
  launch_template {
    id      = aws_launch_template.lab.id
    version = "$Latest"
  }
  enabled_metrics = ["GroupDesiredCapacity", "GroupMaxSize", "GroupInServiceInstances"]
}
What each step of the lab proved, mapped back to the failure classes so the technique — not just the commands — transfers to a real incident:
| Lab step | Reproduced | Failure class | Evidence you read |
|---|---|---|---|
| 2–3 | Desired == Max silent no-op |
Class 2 (at max) | Empty scaling activity; Desired == Max |
| 4 | Fix by raising MaxSize |
— | A new Launching activity appears |
| 5 | Bad instance profile → launch failure | Class 5 (launch) | Failed activity: Invalid IAM Instance Profile name |
| 6 | Fix by reverting the template version | — | Launches succeed on the good version |
Common mistakes & troubleshooting
This is the playbook — keep it open during an incident. Each row is symptom → root cause → confirm (the exact command/field) → fix. Work it top-down; the first rows are the most common and the cheapest to check.
| # | Symptom | Root cause | Confirm | Fix |
|---|---|---|---|---|
| 1 | Won’t scale out; activity history empty | Desired == Max — the silent #1 |
describe-auto-scaling-groups → Desired == Max |
Raise MaxSize; alarm on GroupDesiredCapacity >= GroupMaxSize |
| 2 | Won’t scale in; sits above load | Desired == Min (Min too high) |
describe-auto-scaling-groups → Desired == Min |
Lower MinSize |
| 3 | Metric high, no scale-out | Alarm in INSUFFICIENT_DATA (metric stopped) |
describe-alarms → StateValue |
Fix metric source; set TreatMissingData |
| 4 | One hot instance, no scale-out | Alarm on Average masks it |
describe-alarms → Statistic=Average |
Alarm on Maximum or per-target metric |
| 5 | Threshold looks close, never fires | Threshold never actually crossed | Overlay metric vs Threshold |
Lower threshold / change metric |
| 6 | Reacts far too slowly | Period × EvaluationPeriods too long |
describe-alarms → Period, EvaluationPeriods |
Shorten period (60s) and evaluation periods |
| 7 | Scales once, then stops | Simple-scaling cooldown (300s) | describe-scaling-activities → “in cooldown” |
Shorten cooldown; move to target-tracking/step |
| 8 | Target tracking never scales out | Target set too high (e.g. 90%) | describe-policies → TargetValue |
Lower target to 40–60% |
| 9 | Target tracking never scales in | DisableScaleIn=true |
describe-policies → DisableScaleIn |
Set disable_scale_in=false |
| 10 | Scaling died after someone “cleaned up alarms” | Deleted the hidden TargetTracking-* alarm |
describe-alarms for the managed alarm |
Re-put the policy (recreates alarms) |
| 11 | Desired rises, InService doesn’t | Launch failing (Failed activity) |
describe-scaling-activities → Failed + message |
Match message to the launch-failure reference |
| 12 | Failed: “insufficient capacity” |
ICE in that type/AZ | Activity StatusMessage |
Mixed instances across types + AZs, capacity-optimized |
| 13 | Failed: “vCPU limit” |
Service quota exceeded | Service Quotas console | Request increase; alarm on AWS/Usage at 80% |
| 14 | Failed: “not enough free addresses” |
Subnet exhausted | describe-subnets → AvailableIpAddressCount |
Add/enlarge subnets |
| 15 | Failed: “Invalid IAM Instance Profile” |
Profile deleted/renamed or no PassRole |
Template IamInstanceProfile; IAM |
Fix profile; grant iam:PassRole |
| 16 | Failed: “image id does not exist” |
AMI deregistered / wrong region | Template ImageId vs region |
Update to a valid AMI |
| 17 | Failed: “key pair does not exist” |
Key deleted/other region | Template KeyName |
Fix/remove key (use SSM) |
| 18 | Launches then terminates in ~1 min, repeating | Health-check kill loop (grace too short) | Activities: Terminating … failed ELB health checks |
Raise HealthCheckGracePeriod; fix health path |
| 19 | Dynamic scaling entirely dead | AlarmNotification/Launch suspended |
describe-auto-scaling-groups → SuspendedProcesses |
resume-processes |
| 20 | Scales but new nodes get no traffic | AddToLoadBalancer suspended |
SuspendedProcesses includes AddToLoadBalancer |
resume-processes AddToLoadBalancer |
| 21 | Scheduled bump fires at wrong time | Schedule in UTC (no TimeZone) |
describe-scheduled-actions → TimeZone |
Set TimeZone; use Desired not Min |
| 22 | Can’t scale in at all | All instances scale-in protected | describe-auto-scaling-groups → NewInstancesProtectedFromScaleIn |
Disable protection where not needed |
| 23 | Spot fleet won’t grow | No Spot capacity / price too low | Activity no Spot capacity |
Diversify types; capacity-optimized; raise price |
Beyond the table, prose on the three that eat the most hours.
The silent max cap (badge 2). The most expensive minutes in any scaling incident are the ones spent debugging a policy that works perfectly. When DesiredCapacity == MaxSize, the policy computes a bigger number, the ASG clamps it, and nothing is recorded — no failed activity, no alarm, no log. Engineers see a healthy alarm firing and a healthy policy and conclude the whole system is broken, when it did exactly what it’s designed to do. The tell is always the same: describe-scaling-activities is empty for the spike window while desired sits pinned at max. Make it your second command, and permanently defeat it with an alarm on GroupDesiredCapacity >= GroupMaxSize.
Insufficient Capacity, ICE (badge 4). This is the failure you cannot fix by changing your configuration, because the constraint is on AWS’s side: there is genuinely no more of that instance type in that Availability Zone at that moment, usually during a regional demand spike. The activity history is explicit — “We currently do not have sufficient <type> capacity” — but only if you read it; from the app’s perspective it’s identical to every other “won’t scale.” Chasing it with policy changes is futile. The only durable answer is diversification: a mixed-instances policy spanning several instance types across every AZ with a capacity-optimized allocation strategy, so a launch succeeds on whatever is available. Single-type, single-AZ groups are ICE incidents waiting for a busy day.
The health-check kill loop (badge 5). This one hides as “won’t scale” while the group is frantically trying to scale — launching an instance every couple of minutes and terminating it just as fast. The cause is HealthCheckType = ELB with a HealthCheckGracePeriod shorter than the app’s real boot time: the instance launches, the ALB health check hits it before the app is listening, marks it unhealthy, and the ASG replaces the “failing” instance the moment the grace window closes. The activity history shows the tell-tale alternation of Launching and Terminating … failed ELB health checks a fixed number of seconds apart. The fix is almost never the scaling policy — it’s raising the grace period above your measured boot-to-healthy time and making sure the health endpoint returns 200 only when the app is truly ready.
The decision table for the first sixty seconds of an incident:
| If you see… | It’s probably… | Do this first |
|---|---|---|
| Activity history empty | At-max cap, dead alarm, or suspended process | Check Desired vs Max, SuspendedProcesses, alarm StateValue |
Activities Failed with a message |
A launch failure (ICE/quota/subnet/template) | Read the StatusMessage; match the launch reference |
Launching+Terminating alternating |
Health-check kill loop | Raise grace period; check describe-target-health |
| Scaled once then stopped | Cooldown/warmup, or hit Max | Check cooldown, then Desired vs Max |
Alarm never ALARM |
Wrong metric/threshold/period, or INSUFFICIENT_DATA |
describe-alarms; fix metric/threshold/period |
| Scales out but never in | DisableScaleIn, Min too high, or protection |
Check DisableScaleIn, MinSize, scale-in protection |
| Everything looks right, still nothing | A suspended process | describe-auto-scaling-groups → SuspendedProcesses |
Best practices
- Run
describe-scaling-activitiesfirst, always. It forks the entire investigation into “never tried” (upstream: alarm, cap, suspension) versus “tried and failed” (downstream: launch). Skipping this is why incidents run long. - Alarm on the silent #1. Enable group metrics and alarm on
GroupDesiredCapacity >= GroupMaxSizeso an at-max cap pages you instead of hiding. - Never set
MaxSize == DesiredCapacityin steady state — always leave headroom, or scale-out is capped from the first spike. - Prefer target tracking with a realistic target (40–60%) over simple scaling; it reacts continuously and uses warmup instead of a blunt cooldown.
- Diversify to survive ICE: mixed-instances policy across multiple instance types and every AZ, with a capacity-optimized allocation strategy. Single-type single-AZ is fragile.
- Set
HealthCheckGracePeriodabove measured boot time when using ELB health checks, and point the health check at a lightweight/healthzthat only returns 200 when truly ready. - Alarm on failed scaling activities via an EventBridge rule (
EC2 Instance Launch Unsuccessful) so ICE/quota/template failures page with the cause attached. - Alarm on vCPU usage at 80% of the quota (
AWS/Usage) so a quota-driven launch failure is predicted, not discovered. - Audit
SuspendedProcessesafter every instance refresh — a failed or cancelled refresh can leaveLaunch/Terminatesuspended for days. - Set
TimeZoneon every scheduled action and changeDesiredCapacity, notMinSize, for temporary bumps so you don’t pin the floor. - Use
DefaultInstanceWarmupat the group level, set to real boot-to-ready time, so cold instances don’t skew the metric and cause over-scaling. - Keep one dominant scaling metric per group — two fighting target-tracking policies oscillate.
The alarm/observability set that makes a “won’t scale” page arrive with the diagnosis attached:
| Alarm / signal | Fires when | It means | Points you at |
|---|---|---|---|
GroupDesiredCapacity >= GroupMaxSize |
Desired pinned at max | The silent #1 cap | Raise MaxSize |
EventBridge EC2 Instance Launch Unsuccessful |
Any failed launch | ICE / quota / subnet / template | The launch reference |
AWS/Usage vCPU ≥ 80% of quota |
Approaching the quota | Quota-driven failure imminent | Request an increase |
UnHealthyHostCount flapping |
Instances failing health then replaced | Kill loop | Grace period / health path |
GroupInServiceInstances < Desired (sustained) |
Desired > actual for minutes | Launch failing or kill loop | describe-scaling-activities |
CloudWatch alarm INSUFFICIENT_DATA |
Metric stopped reporting | Scaling trigger dead | Fix the metric source |
Security notes
- Split diagnostic from remediation permissions. The on-call needs
autoscaling:Describe*,cloudwatch:DescribeAlarms, andec2:Describe*to read the loop — none of which can change capacity. Reserveautoscaling:UpdateAutoScalingGroup,SetDesiredCapacity,ResumeProcesses, andiam:PassRolefor a separate remediation role. A read-only diagnostic role resolves most incidents without any write access. iam:PassRoleis the sharp edge. For an ASG to launch instances with an instance profile, the principal creating/updating the group needsiam:PassRolefor that role. Scope it to the specific role ARN with aConditiononiam:PassedToService = ec2.amazonaws.com— neverResource: "*", which lets a caller attach any role (including admin) to a new instance and pivot.- The service-linked role is required. Auto Scaling uses the
AWSServiceRoleForAutoScalingservice-linked role to call EC2/ELB/CloudWatch on your behalf. If it’s missing or its permissions are tampered with (e.g. it can’t use a KMS key for an encrypted AMI), launches fail with opaqueClient.InternalError— a security-adjacent failure that presents as “won’t scale.” - Least-privilege launch templates. The instance profile a launch template attaches should carry only what the workload needs; a scaled fleet multiplies any over-permissioned role across every instance. Review the profile before it scales to dozens of boxes.
- Protect the scaling configuration from drift. Someone hand-editing
MaxSize, suspending a process, or deleting a target-tracking alarm in the console is a common cause of silent scaling death; enforce the config via Terraform and detect drift, and log allautoscaling:*mutations in CloudTrail so “who set Max to Desired?” has an answer. - Guard scheduled actions. A scheduled action that raises
MinSizeis effectively a standing capacity floor (and cost floor); restrict who can create them and review recurrences so an errant schedule can’t pin a large, expensive fleet.
Cost & sizing
Auto Scaling itself is free — you pay only for the EC2 instances, plus small charges for the CloudWatch metrics and alarms that keep it observable. But the failures in this article have real cost signatures worth knowing.
| Cost driver | How it’s charged | Rough figure | Note |
|---|---|---|---|
| Auto Scaling service | Free | ₹0 | You pay for instances, not the ASG |
| EC2 instances (the fleet) | Per-second, per instance | e.g. t3.micro ~₹0.85/hr (~$0.0104) |
Right-sizing Min/Desired is the real lever |
| CloudWatch detailed monitoring | Per instance for 1-min metrics | ~₹250/instance/month (~$3.50) | Basic (5-min) is free; detailed speeds scaling reaction |
| CloudWatch alarms | Per alarm | ~₹8/alarm/month (~$0.10) | Standard alarms; the observability set above is a few ₹ |
| Group metrics collection | Free | ₹0 | Enable it — needed to see the at-max cap |
| Won’t-scale-in leak | Idle instances billed | Whole instances × hours | A stuck scale-in is a silent budget leak |
| Kill-loop churn | Launches + brief runtime | Per-second, but repeated | Thrash generates cost + log volume |
Sizing guidance to avoid capacity-driven failures:
| Concern | Signal to watch | Action |
|---|---|---|
| Scale-out capped | GroupDesiredCapacity == GroupMaxSize |
Raise MaxSize with real headroom |
| ICE risk | Repeated Failed “insufficient capacity” |
Diversify types + AZs; add Spot with capacity-optimized |
| vCPU quota ceiling | AWS/Usage vCPU near limit |
Request increase before the peak |
| Over-scaling from cold instances | Scale-out immediately after each launch | Set DefaultInstanceWarmup to real boot time |
| Slow reaction wasting SLA | Long Period × EvaluationPeriods |
Detailed monitoring + 60s period |
| Scale-in leak | Desired stuck high after load drops |
Check Min, DisableScaleIn, scale-in protection |
The single biggest hidden cost here isn’t the ASG — it’s a group that won’t scale in because MinSize is too high, DisableScaleIn is set, or every instance is scale-in-protected. It runs a full fleet through every quiet night and weekend, and because “extra capacity” never pages anyone, it can leak for months. Alarm on GroupInServiceInstances staying above expected off-peak levels, not just on scale-out failures.
Interview & exam questions
1. An ASG won’t scale out during a spike; the alarm and policy look correct. What is the single most likely cause and how do you confirm it in ten seconds? The group is already at MaxSize — the #1 silent cause. The policy computes a higher desired, the ASG clamps it to Max, and records nothing. Confirm with describe-auto-scaling-groups and compare DesiredCapacity to MaxSize; if equal, raise MaxSize. (SAA-C03, SOA-C02)
2. What is the first command you run in any “won’t scale” incident and what does its output fork into? aws autoscaling describe-scaling-activities. An empty history means the group never tried (look upstream: dead alarm, at-max cap, or a suspended process); a Failed activity means it tried and EC2 refused (read the StatusMessage for ICE/quota/subnet/template). (SOA-C02)
3. Explain Insufficient Capacity (ICE) and why no configuration change on your side fixes it. ICE means AWS has no more of the requested instance type in the requested AZ at that moment. The launch fails with “We currently do not have sufficient <type> capacity.” Because the constraint is on AWS’s capacity, the durable fix is diversification — a mixed-instances policy across multiple types and all AZs with a capacity-optimized allocation strategy. (SAA-C03, ANS-C01)
4. A target-tracking policy set to keep CPU at 90% never scales out under obvious load. Why? Target tracking adds capacity only to pull the metric down to the target. At a 90% target, a fleet cruising at 85% is “at target,” so it never scales out even though it’s clearly hot. Lower the target to a realistic 40–60%. (SAA-C03)
5. Distinguish cooldown from instance warmup. Cooldown (simple scaling) is a group-wide pause after any action during which no further action fires (default 300s). Instance warmup (step/target tracking) is per-instance — it excludes a newly launched instance’s metrics from the aggregate while it boots, so a cold instance’s spike doesn’t cause runaway scaling. Cooldown blocks scaling; warmup doesn’t. (SOA-C02)
6. An instance launches and is terminated ~60 seconds later, repeatedly, and the group “won’t scale.” What’s happening and what’s the fix? The health-check kill loop: HealthCheckType = ELB with a HealthCheckGracePeriod shorter than the app’s boot time, so the ALB marks the not-yet-ready instance unhealthy and the ASG replaces it. Fix by raising the grace period above real boot time and correcting the health path/matcher. (SOA-C02, ANS-C01)
7. Where does target tracking store the logic that actually triggers scaling, and how can it silently break? In two CloudWatch alarms AWS creates and manages (TargetTracking-<asg>-AlarmHigh/AlarmLow-*), not in your IaC. If a cleanup script or a person deletes those alarms, scaling dies silently; re-putting the policy recreates them. (SAA-C03)
8. Name three ways a suspended process manifests as “won’t scale.” Suspended Launch → can’t add instances; suspended Terminate → can’t scale in or replace unhealthy; suspended AlarmNotification → alarms ignored so dynamic scaling is entirely dead. Confirm with describe-auto-scaling-groups → SuspendedProcesses; a failed instance refresh is a common cause. (SOA-C02)
9. A scaling activity shows Failed with “You have requested more vCPU capacity than your current vCPU limit.” What is this and how do you prevent recurrence? A service-quota (vCPU) limit for that instance family. Request a quota increase via Service Quotas, and prevent recurrence by alarming on the AWS/Usage vCPU metric at ~80% of the limit so you raise it before the peak. (SOA-C02, CLF-C02)
10. Why might an alarm on Average CPUUtilization across an ASG fail to scale a fleet where one instance is pegged at 100%? Averaging hides the hot instance — one node at 100% among nine at 10% averages 19%, below any sane threshold. For uneven load, alarm on Maximum or on a per-target metric like ALB RequestCountPerTarget. (SAA-C03)
11. A group scales out fine but never scales in. Give three distinct causes. DesiredCapacity == MinSize (Min too high); target-tracking DisableScaleIn = true; or scale-in protection (NewInstancesProtectedFromScaleIn) on all instances. Each blocks scale-in independently. (SOA-C02)
12. What does INSUFFICIENT_DATA on a scale-out alarm mean for scaling, and what causes it? The alarm has no datapoints to evaluate, so it can’t transition to ALARM and nothing scales. Common causes: the metric source disappeared (instance terminated, agent died) or the metric only publishes under load. Fix the source or set TreatMissingData appropriately. (SOA-C02)
Quick check
- What is the first command you run in a “won’t scale” incident, and what do an empty history versus a
Failedactivity each tell you? - The #1 silent cause of no scale-out is what condition between two of the three ASG sizes, and how do you confirm it?
- Why does a target-tracking target of 90% often “never scale out,” and what should it be?
- An instance launches then terminates ~60s later on repeat — name the failure and its one-line fix.
- Which
describe-auto-scaling-groupsfield reveals a process-level kill switch, and name the three most damaging processes to have suspended?
Answers
aws autoscaling describe-scaling-activities. Empty = the group never tried to scale (look upstream: dead alarm, at-max cap, or a suspended process).Failed= it tried and EC2 refused (read theStatusMessagefor ICE, vCPU quota, full subnet, or a bad template).DesiredCapacity == MaxSize. The policy computes a higher desired, the ASG clamps it to Max, and records nothing. Confirm withdescribe-auto-scaling-groupsand compareDesiredCapacitytoMaxSize; the fix is to raiseMaxSize.- Target tracking only adds capacity to pull the metric down to the target, so at 90% a fleet at 85% is “at target” and won’t scale out. Set a realistic target of 40–60%.
- The health-check kill loop —
HealthCheckType = ELBwith aHealthCheckGracePeriodshorter than boot time. Fix: raise the grace period above real boot-to-healthy time (and fix the health path). SuspendedProcesses. The three most damaging:Launch(can’t add),Terminate(can’t remove/replace), andAlarmNotification(alarms ignored — dynamic scaling entirely dead). Resume withresume-processes.
Glossary
- Auto Scaling group (ASG) — a managed collection of EC2 instances kept between
MinSizeandMaxSizeand steered toDesiredCapacityby policies and health checks. - DesiredCapacity — the target instance count the ASG drives toward; always clamped to
[MinSize, MaxSize]. Scaling is changing this number. - Scaling activity — a recorded attempt to change capacity, with a
StatusCode(Successful/Failed/…),StatusMessage, andCause; the primary evidence in any incident. - Target tracking — a policy that keeps a metric at a target value using two CloudWatch alarms AWS creates and manages for you.
- Step scaling — a policy that maps metric bands to step adjustments; uses instance warmup rather than a global cooldown.
- Simple scaling — a legacy policy: one alarm, one adjustment, then a group-wide cooldown (default 300s) that blocks all actions.
- Cooldown — a post-action, group-wide pause (simple scaling) during which no further scaling happens.
- Instance warmup — a per-instance period during which a new instance’s metrics are excluded from the aggregate so a cold instance’s spike doesn’t cause over-scaling.
- Health-check grace period — seconds after launch during which the ASG ignores health results; too short with
ELBhealth checks causes the kill loop. - Insufficient Capacity / ICE — AWS has no more of the requested instance type in the requested AZ right now; fixed by diversifying types and AZs, not by config.
- Mixed instances policy — an ASG configuration spanning multiple instance types (and Spot/On-Demand) with an allocation strategy (e.g. capacity-optimized) to survive ICE.
- Suspended process — one of nine ASG processes (Launch, Terminate, AlarmNotification, …) turned off, silently disabling part or all of scaling.
- Scale-in protection — a flag that stops the ASG from terminating specific (or all new) instances during scale-in.
INSUFFICIENT_DATA— a CloudWatch alarm state meaning no datapoints to evaluate; a scale-out alarm stuck here never fires.iam:PassRole— the permission a principal needs to let an ASG launch instances with an instance profile; a missing grant is a frequent launch-failure cause.
Next steps
- Build the fleet you just learned to debug, template-first: EC2 Auto Scaling & Launch Templates Hands-On.
- Fix the launch failures that come from limits: AWS Service Quotas & Limits: Finding Them, Requesting Increases & Avoiding Throttling.
- Get the health checks the ASG honours right at the load-balancer layer: Application Load Balancer & Target Groups Hands-On, and when it’s a 503 not a scaling issue, the ALB 5xx troubleshooting playbook.
- Beat Insufficient Capacity with diversification and cheaper compute: EC2 Spot Instances: Savings & Interruptions.
- When a launched instance is running but unreachable (not a scaling problem), work the EC2 SSH connect-timeout playbook and the VPC connectivity troubleshooting playbook.