The incident is open, the graph is red, and you have one question: what actually happened at 02:14? The answer is in the logs — a few thousand lines buried inside a few million, scattered across a Lambda log group, an ECS task’s stream, and an API Gateway access log. If your logs are unstructured text, the next twenty minutes are grep-by-eyeball and copy-paste archaeology. If they are structured JSON in Amazon CloudWatch Logs and you know Logs Insights, the answer is one query: filter level="ERROR" | stats count() by errorCode, bin(5m) — and you have the error rate, the top failing code, and the exact minute it started, in the time it took to read this sentence.
CloudWatch Logs is the default destination for almost everything on AWS — Lambda writes there automatically, ECS ships there through the awslogs driver, API Gateway, RDS, VPC Flow Logs and the CloudWatch agent all land there — which makes it the one place you can correlate a whole system. But “it’s all in CloudWatch” is not the same as “you can find it.” The difference is a handful of concepts most teams never learn properly: the log group / log stream object model and its retention cost trap, the log class you pick at creation, structured JSON logging and the Embedded Metric Format that turn log lines into queryable fields and free metrics, metric filters that convert a log pattern into a CloudWatch metric and then an alarm, subscription filters that stream matching events in real time to Lambda, Kinesis, Firehose or OpenSearch, and the Logs Insights query language — fields, filter, stats … by … bin(), parse, sort, dedup, diff — that lets you interrogate all of it at scale.
This is the hands-on, production-grade reference for all of it. You will learn the query language option by option, build a metric-filter-to-alarm pipeline and a subscription filter to Lambda in both aws CLI and Terraform, ship structured JSON and EMF, and — because logs are where money quietly leaks — control the ingestion, storage and per-GB-scanned costs that make CloudWatch Logs one of the most commonly over-spent line items on a bill. It maps directly to the observability domains of SOA-C02 and DVA-C02, and the monitoring pieces of SAA-C03.
What problem this solves
Logs are only useful if you can find the line that matters, count how often it happens, and be told when it spikes — fast, under pressure, without SSH-ing into anything. On AWS there is no host to tail: Lambda has no filesystem you can watch, Fargate tasks are gone the moment they stop, and a fleet of a hundred instances produces a hundred rotating files you will never open by hand. CloudWatch Logs solves the collection problem — everything streams to one durable, centralized service — but collection without structure and query is a landfill, not an observability tool.
What breaks without this knowledge is your incident response and your budget, together. A team ships everything as console.log("something failed: " + err) unstructured text; six months later an outage hits and they cannot compute an error rate because “error” appears in forty different free-text shapes and nothing is a field. Another team never sets retention, so every log group keeps data forever at $0.03/GB-month and the “storage” line on the bill quietly overtakes the compute it describes. A third runs a Logs Insights query over Never expire log groups across a 30-day window and is surprised by the query bill, because Insights charges per GB scanned and they scanned terabytes to find twelve lines. A fourth wires a subscription filter to a Lambda, sees nothing arrive, and spends an afternoon before discovering the missing resource-based policy that lets CloudWatch Logs invoke the function. None of these are exotic — they are the default behaviour of the service when you do not configure against it.
Who hits this: every team running anything on AWS past “hello world.” It bites hardest on people new to the log-group/stream model and the retention default, on anyone computing SLOs or error budgets from logs (structure is non-negotiable), on teams streaming logs to a SIEM or a data lake (subscription filters + IAM), and on anyone whose CloudWatch bill grew faster than their traffic (ingestion, retention and scanned-GB, in that order). The fix is always the same shape: structure the logs at the source, set retention and the right log class, query with Logs Insights instead of eyeballing, and turn the patterns that page you into metric filters and alarms.
Here is the whole surface on one screen — the moving parts, what each one is for, and the failure it prevents — so you can orient before the deep dive:
| Building block | What it does | The failure it prevents |
|---|---|---|
| Log group / stream | The container + per-source ordered stream of events | “Where do these logs even go?” |
| Retention | Auto-deletes events after N days | Never expire bill creep; or logs gone too soon |
| Log class (Standard / IA) | Cost vs feature trade-off, set at creation | Paying full price for rarely-queried logs |
| Structured JSON logging | Fields auto-discovered by Insights | Regex archaeology instead of filter field=x |
| Embedded Metric Format | Log line and a metric in one write | High-cardinality metrics without PutMetricData throttling |
| Metric filter | Log pattern → CloudWatch metric | Alarming on things only visible in logs |
| Subscription filter | Real-time stream of matching events out | Getting logs into a SIEM / lake / search |
| Logs Insights | Query language over the logs | Computing rates, percentiles, top-N at scale |
| Cross-account observability | One monitoring account queries many | Hopping accounts during an incident |
Learning objectives
By the end of this article you can:
- Explain the CloudWatch Logs object model — log groups, log streams, log events — and set retention and the log class deliberately instead of inheriting the expensive defaults.
- Get logs in from Lambda, ECS/Fargate (the
awslogsdriver), API Gateway (execution + access logs), and EC2/on-prem via the unified CloudWatch agent. - Emit structured JSON logs whose fields Logs Insights auto-discovers, and use the Embedded Metric Format to publish metrics straight from a log line.
- Write Logs Insights queries fluently:
fields/display,filter(like,in, regex=~),stats … by … bin(),sort,limit,parse(glob and regex),dedup,diff, and the@message/@timestamp/@logStreamsystem fields. - Build a metric filter → CloudWatch alarm from a log pattern, and stream matching events in real time with a subscription filter to Lambda / Kinesis Data Streams / Firehose / OpenSearch.
- Run cross-log-group and cross-account queries, save reusable queries, and use Live Tail and the natural-language query generator.
- Diagnose the classic failures — a query that returns nothing, a
parsethat won’t match, a metric filter with no data, a subscription filter that won’t deliver — and control ingestion, storage and scanned-GB cost.
Prerequisites & where this fits
You should be comfortable running aws from a shell, reading JSON with --query, and reading a Terraform aws provider block. You should know what a CloudWatch metric and an alarm are at a basic level, what Lambda, ECS/Fargate and API Gateway are, and that IAM roles and resource-based policies exist. No prior Logs Insights experience is assumed — that is what this builds.
This sits at the centre of the Observability track. It is the logs half of the picture whose metrics-and-alarms half lives in CloudWatch Metrics, Alarms & Dashboards, Hands-On; when an alarm you built here should have fired but didn’t, Why Your CloudWatch Alarm Isn’t Triggering is the companion playbook. For container workloads the deeper per-container telemetry is in Container Insights for EKS & ECS. The single richest source of the structured logs this article queries is Lambda — pair it with AWS Lambda Errors, Timeouts & Cold Starts: The Troubleshooting Playbook. And two of the biggest producers of logs you will query are covered in VPC Flow Logs for Network Troubleshooting and CloudTrail, Config & Audit Compliance.
Before the deep dive, fix where each layer lives so you look in the right place first:
| Layer | What lives here | You touch it when… | First tool |
|---|---|---|---|
| Producer | Your app / an AWS service emitting log lines | Logs are missing or unstructured | The source’s logging config |
| Ingestion path | Native integration, awslogs, the CW agent |
Nothing arrives at the log group | Driver/agent config + IAM |
| Log group | Retention, log class, KMS, filters | Cost creep, or wrong retention | describe-log-groups |
| Analyze | Logs Insights, Live Tail, metric filters | Finding, counting, alarming | Logs Insights console/API |
| Route out | Subscription filters, export to S3 | Feeding a SIEM/lake/search | Subscription filter + destination IAM |
| Cross-account | OAM sink + link, monitoring account | One pane over many accounts | Observability Access Manager |
Core concepts
The object model: groups, streams, events
CloudWatch Logs has exactly three nesting levels, and getting them straight removes half of all confusion.
| Object | What it is | Key rules | Example |
|---|---|---|---|
| Log event | A single timestamped record (a line, or a JSON object) | Up to 256 KB per event; has an event timestamp and an @ingestionTime |
{"level":"ERROR","msg":"..."} |
| Log stream | An ordered sequence of events from one source (one function instance, one container, one host) | Name ≤ 512 chars, no : or *; events should arrive roughly in time order |
2026/07/14/[$LATEST]a1b2c3… |
| Log group | The container that holds many streams and carries all the settings | Retention, log class, KMS key, metric filters, subscription filters, tags, data-protection policy live here | /aws/lambda/orders-api |
The settings that matter are all on the group, not the stream: retention, encryption, the log class, and the filters. A stream is just where a particular producer writes; you almost never manage streams directly — the producer creates them. Queries and alarms operate at the group level (or across several groups).
The system fields Logs Insights gives you for free
Every log event, whatever its shape, exposes a set of @-prefixed system fields. These are the backbone of every query — learn them cold.
| Field | Meaning | Use it for |
|---|---|---|
@message |
The raw, unparsed log event text | filter @message like /timeout/; parse @message … |
@timestamp |
The event’s own timestamp | stats … by bin(5m); sorting by time |
@ingestionTime |
When CloudWatch received it | Diagnosing ingestion lag vs event time |
@logStream |
The stream (source instance) it came from | Isolating one container/function instance |
@log |
The log group identifier (account-id:group-name) |
Telling groups apart in a multi-group query |
@logGroup |
The log group name | Grouping results by source group |
@ptr |
Opaque pointer to the full record | GetLogRecord to fetch the whole event |
@type |
Event type (e.g. Lambda REPORT) |
Filtering to Lambda platform lines |
For Lambda specifically, the REPORT/platform lines are further parsed into @requestId, @duration, @billedDuration, @memorySize, @maxMemoryUsed and @initDuration — which is why you can query cold-start distributions without any custom logging. For JSON events, every key becomes a field automatically (next section).
How each AWS source ships logs
You rarely write to CloudWatch Logs by hand; a service or agent does it. Knowing the mechanism per source tells you where to look when logs are missing.
| Source | Mechanism | Default log group | Gotcha |
|---|---|---|---|
| Lambda | Native (managed) | /aws/lambda/<fn> |
Needs logs:CreateLogGroup/Stream/PutLogEvents in the execution role (the managed AWSLambdaBasicExecutionRole grants it) |
| ECS on Fargate/EC2 | awslogs log driver (or FireLens) |
You name it (awslogs-group) |
Task execution role needs logs perms; set awslogs-create-group or pre-create the group |
| API Gateway (REST) | Execution + access logs | API-Gateway-Execution-Logs_<id>/<stage> + your access-log group |
Requires an account-level CloudWatch role ARN set once via update-account |
| API Gateway (HTTP) | Access logs | Your chosen group | Set AccessLogSettings on the stage |
| VPC Flow Logs | Vended logs | Your chosen group | Different (cheaper, tiered) vended-logs pricing |
| RDS / Aurora | Log exports | /aws/rds/instance/<db>/<logtype> |
Enable per-log-type export; engine-specific |
| EC2 / on-prem | Unified CloudWatch agent | You define it in agent config | Agent needs CloudWatchAgentServerPolicy; config in SSM |
| EKS control plane | Native (opt-in) | /aws/eks/<cluster>/cluster |
Enable each log type; container logs need the agent/Fluent Bit |
| CloudTrail | Optional CWL delivery | CloudTrail/<name> |
Also (usually) goes to S3; CWL copy is for alarming |
Log groups, retention & the log class
Retention — the default is a cost trap
Every log group has a retention setting that auto-deletes events older than N days. The default is Never expire, which means every log group you ever create keeps data forever at storage prices. This is the single most common CloudWatch overspend. The allowed values are a fixed set — you cannot pick an arbitrary number of days:
| Retention (days) | Typical use | Notes |
|---|---|---|
| 1, 3, 5 | High-volume debug/verbose logs | Cheapest; enough for live troubleshooting |
| 7, 14 | App logs you triage within a sprint | A sane default for most services |
| 30, 60, 90 | Operational logs, short-term trends | 90 covers a quarter |
| 120, 150, 180 | Semi-compliance, seasonal analysis | |
| 365, 400 | Yearly retention / light audit | 400 = ~13 months |
| 545, 731 | ~18 months / 2 years | |
| 1096, 1827 | 3 years / 5 years | |
| 2192, 2557, 2922, 3288, 3653 | 6, 7, 8, 9, 10 years | Long compliance; consider export to S3 instead |
Never expire (default) |
(avoid unless intentional) | The bill creeps forever — set retention on every group |
The other group-level settings are the rest of your control surface:
| Setting | What it controls | Default | When to change |
|---|---|---|---|
| Retention | Auto-delete age | Never expire | Always set it — pick from the list above |
| Log class | Standard vs Infrequent Access | Standard | IA for rarely-queried, high-volume logs (set at creation) |
| KMS key | Encryption at rest with a CMK | AWS-owned key | Compliance / customer-managed key requirements |
| Metric filters | Log pattern → metric | none | To alarm on a log pattern (Standard class only) |
| Subscription filters | Real-time stream out | none | To feed Lambda/Kinesis/OpenSearch (max 2 per group) |
| Data protection policy | Mask/audit sensitive data (PII) | none | Redact emails/cards/secrets in logs (Standard only) |
| Field index | Index a field to cut query cost/latency | none | High-cardinality fields you filter on constantly |
| Tags | Cost allocation / ownership | none | Attribute the log bill to a team |
# Create a group with 30-day retention and encryption; then confirm retention
aws logs create-log-group --log-group-name /app/orders --kms-key-id "$CMK_ARN"
aws logs put-retention-policy --log-group-name /app/orders --retention-in-days 30
aws logs describe-log-groups --log-group-name-prefix /app/orders \
  --query 'logGroups[].{name:logGroupName,days:retentionInDays,class:logGroupClass}'

# Find every Never-expire group in the account (the cost audit one-liner)
aws logs describe-log-groups \
  --query 'logGroups[?retentionInDays==null].logGroupName' --output text
resource "aws_cloudwatch_log_group" "orders" {
  name              = "/app/orders"
  retention_in_days = 30            # never leave this unset
  log_group_class   = "STANDARD"    # or "INFREQUENT_ACCESS"
  kms_key_id        = aws_kms_key.logs.arn
  tags              = { team = "payments", env = "prod" }
}
The log class: Standard vs Infrequent Access
CloudWatch Logs has two log classes. You choose at creation and cannot change it afterward (you would create a new group and repoint the producer). Infrequent Access costs roughly half the ingestion price but drops the features you would only use on hot, operational logs.
| Capability | Standard | Infrequent Access (IA) |
|---|---|---|
| Ingestion price | Full (≈ $0.50/GB) | ≈ 50% lower (≈ $0.25/GB) |
| Logs Insights queries | Yes | Yes |
GetLogEvents / GetLogRecord / FilterLogEvents |
Yes | Yes |
| Export to S3 | Yes | Yes |
| Metric filters | Yes | No |
| Subscription filters | Yes | No |
| Live Tail | Yes | No |
| Data protection (masking) | Yes | No |
| Alarms on metric filters | Yes | No (no metric filters) |
| Change class later | — | No (immutable; recreate) |
| Best for | App logs you alarm/stream/tail | High-volume logs you only occasionally query (audit, debug archives) |
The decision is simple: if you will alarm on it, stream it, or tail it, it must be Standard. If it is a high-volume firehose you keep “just in case” and query maybe monthly (verbose debug, some vended logs, forensic archives), IA halves the ingestion bill with no query penalty.
Naming conventions worth following
Group names are hierarchical by convention (the / is just a character, but tooling and the console lean on it). Match the AWS conventions so operators find things fast:
| Pattern | For | Example |
|---|---|---|
/aws/lambda/<fn> |
Lambda (fixed) | /aws/lambda/orders-api |
/ecs/<cluster>/<service> |
ECS (your choice) | /ecs/prod/checkout |
/aws/apigateway/<name> or a custom name |
API GW access logs | /aws/apigateway/orders-http |
/aws/rds/instance/<db>/<type> |
RDS exports (fixed) | /aws/rds/instance/orders/postgresql |
/app/<domain>/<service> |
Your own apps | /app/payments/settlement |
/aws/vpc/flowlogs/<vpc> |
Flow logs (your choice) | /aws/vpc/flowlogs/vpc-0abc |
Getting logs in: the agent & native integrations
The unified CloudWatch agent
For anything with a filesystem — EC2, on-prem servers, containers you manage — the unified CloudWatch agent tails files and ships lines to CloudWatch Logs (and can collect host metrics in the same pass). Its config is a single JSON document, usually stored in SSM Parameter Store and pushed with the AmazonCloudWatch-ManageAgent SSM document.
| Config section | Purpose | Key keys |
|---|---|---|
agent |
Global agent behaviour | metrics_collection_interval, region, debug |
logs.logs_collected.files.collect_list[] |
Which files to tail → which group | file_path, log_group_name, log_stream_name, timestamp_format, multi_line_start_pattern, retention_in_days, log_group_class |
logs.logs_collected.windows_events |
Windows Event Log channels | event_name, event_levels |
metrics |
Host metrics (CPU/mem/disk) | namespace, append_dimensions, metrics_collected |
The collect_list entry is the one you edit most. log_stream_name supports {instance_id}/{hostname} placeholders so each host gets its own stream; multi_line_start_pattern groups stack traces into one event; and you can set retention_in_days right in the agent config so groups are never born Never expire.
{
  "logs": {
    "logs_collected": {
      "files": {
        "collect_list": [
          {
            "file_path": "/var/log/app/*.log",
            "log_group_name": "/app/orders",
            "log_stream_name": "{instance_id}",
            "timestamp_format": "%Y-%m-%dT%H:%M:%S",
            "multi_line_start_pattern": "{timestamp_format}",
            "retention_in_days": 30
          }
        ]
      }
    }
  }
}
The awslogs driver for ECS/Fargate
Containers on ECS ship logs through the awslogs log driver in the task definition’s logConfiguration. (For fan-out to non-CloudWatch destinations you use FireLens/Fluent Bit, but for CloudWatch itself awslogs is native and simplest.)
| Option | Purpose | Note |
|---|---|---|
awslogs-group |
Target log group | Pre-create it, or set awslogs-create-group=true |
awslogs-region |
Region of the group | Usually the task’s region |
awslogs-stream-prefix |
Prefix for per-container streams | Yields prefix/container/task-id streams |
awslogs-create-group |
Auto-create the group | Needs logs:CreateLogGroup on the execution role |
awslogs-datetime-format |
Multi-line by timestamp | Groups tracebacks into one event |
awslogs-multiline-pattern |
Multi-line by regex | Alternative to datetime |
mode |
blocking (default) or non-blocking |
Non-blocking avoids stalling the app if CWL is slow (may drop) |
max-buffer-size |
Buffer for non-blocking mode | Tune with mode=non-blocking |
"logConfiguration": {
  "logDriver": "awslogs",
  "options": {
    "awslogs-group": "/ecs/prod/checkout",
    "awslogs-region": "ap-south-1",
    "awslogs-stream-prefix": "checkout",
    "mode": "non-blocking",
    "max-buffer-size": "25m"
  }
}
API Gateway: execution vs access logs
API Gateway produces two kinds of logs, and people constantly confuse them:
| Log type | Content | Where | Turn on |
|---|---|---|---|
| Execution logs | Per-request internal trace (auth, mapping, integration) at ERROR or INFO |
API-Gateway-Execution-Logs_<id>/<stage> (managed name) |
Stage settings: log level + optionally full request/response data |
| Access logs | One structured line per request, your format via $context variables |
A log group you choose | Stage AccessLogSettings with a format string |
Access logs are where you put the fields you actually query. Build the format from $context variables so each line is JSON:
$context variable |
Meaning |
|---|---|
$context.requestId |
Unique request ID (correlate with backend) |
$context.status |
HTTP status returned to the client |
$context.integrationLatency |
Time the backend took |
$context.responseLatency |
Total time API GW took |
$context.identity.sourceIp |
Caller IP |
$context.error.message |
Gateway-level error (auth, throttle) |
$context.integration.status |
Backend status (may differ from status) |
For REST APIs you must set an account-level CloudWatch role once (aws apigateway update-account --patch-operations op=replace,path=/cloudwatchRoleArn,value=<role>), or logging silently does nothing — a classic “no logs” cause.
Structured JSON logging & the Embedded Metric Format
Text vs JSON — why structure changes everything
Logs Insights auto-discovers fields from JSON events. If your handler emits {"level":"ERROR","route":"/pay","latencyMs":812,"orderId":"o-91"}, then level, route, latencyMs and orderId are all queryable fields without any parse, and latencyMs is a number you can average and percentile. Emit the same information as ERROR /pay took 812ms for o-91 and every query starts with a fragile parse or regex. Structure at the source is the highest-leverage thing you can do for future-you.
| Aspect | Unstructured text | Structured JSON |
|---|---|---|
| Field access | parse/regex every query |
filter route="/pay" directly |
| Numeric ops | Must cast parsed strings | avg(latencyMs), pct(latencyMs,99) natively |
| Nested data | Painful | Flattened as a.b.c, arrays as a.0 |
| Field discovery | None | Auto (up to ~1000 fields/event) |
| Correlation | Grep for an ID | filter orderId="o-91" across services |
| Cost of a query | Higher (scan + parse) | Lower (filter on a field) |
Nested JSON is flattened with dot notation, so {"http":{"status":500}} is queried as filter http.status = 500. Modern Lambda runtimes (and the Lambda JSON log format) make level, timestamp and requestId first-class; turn that on and structured logging costs you nothing.
The Embedded Metric Format (EMF)
EMF is a JSON log convention that lets you emit a log line and a CloudWatch metric in the same write. You add an _aws block describing which top-level members are metrics and which are dimensions; CloudWatch asynchronously extracts the metrics from the log — no PutMetricData call, no API throttling, and you keep the raw line for Logs Insights.
| EMF element | Purpose |
|---|---|
_aws.Timestamp |
Metric timestamp (epoch ms) |
_aws.CloudWatchMetrics[] |
The metric directives array |
.Namespace |
Target metric namespace |
.Dimensions |
Array of dimension-set arrays (each inner array = one dimension combination) |
.Metrics[] |
{ Name, Unit, StorageResolution } for each metric member |
| (top-level members) | The actual metric values and dimension values live as normal JSON keys |
{
  "_aws": {
    "Timestamp": 1752460440000,
    "CloudWatchMetrics": [{
      "Namespace": "Orders",
      "Dimensions": [["Service","Route"]],
      "Metrics": [{ "Name": "LatencyMs", "Unit": "Milliseconds" }]
    }]
  },
  "Service": "checkout", "Route": "/pay",
  "LatencyMs": 812, "orderId": "o-91"
}
That single line becomes an Orders namespace metric LatencyMs dimensioned by Service + Route, and a fully queryable Insights record. Compare the three ways to get a custom metric:
| Approach | How | Best for | Watch out |
|---|---|---|---|
PutMetricData API |
Explicit SDK call per metric | Precise, immediate metrics | API throttling at high cardinality; extra code path |
| Metric filter | Pattern over existing log lines | Alarming on logs you already emit | Standard class only; sparse if no default value |
| EMF | Structured log with _aws block |
High-cardinality app metrics + the raw log | Metrics extracted async (slight delay); ingestion cost |
The Logs Insights query language, in depth
A Logs Insights query is a pipeline of commands separated by |, evaluated top to bottom over the events in your selected log group(s) and time range. This section is the heart of the article.
The commands
| Command | What it does | Example |
|---|---|---|
fields |
Select or compute fields (expressions allowed) | fields @timestamp, latencyMs, latencyMs/1000 as sec |
display |
Restrict output columns (last one wins) | display @timestamp, route, status |
filter |
Keep only matching events | filter status >= 500 |
parse |
Extract new fields from a field (glob or regex) | parse @message "took *ms" as ms |
stats |
Aggregate, optionally grouped by |
stats count() by route |
sort |
Order rows asc/desc | sort latencyMs desc |
limit |
Cap returned rows (max 10,000) | limit 20 |
dedup |
Drop duplicate rows by field list | dedup orderId |
diff |
Compare this period to the previous equal one | diff (after a stats) |
pattern |
Cluster events into recurring patterns | pattern @message |
unmask |
Reveal data-protection-masked text (needs perm) | fields unmask(@message) |
fields and display
fields both selects existing fields and creates new ones with expressions (arithmetic, string and date functions), aliased with as. display narrows the final columns. Use fields to derive; use display to present.
fields @timestamp, @message, latencyMs / 1000 as latencySec
| filter latencySec > 1
| display @timestamp, route, latencySec
| sort latencySec desc
| limit 25
filter — like, in, regex
filter is where you narrow. It supports the full comparison and boolean set, plus substring/regex matching.
| Operator | Meaning | Example |
|---|---|---|
= != < <= > >= |
Comparison (numeric + string) | filter status >= 500 |
and or not |
Boolean combination | filter status>=500 and route="/pay" |
like |
Substring (quotes) or regex (/…/) |
filter @message like /timed out/ |
not like |
Negated match | filter @message not like "health" |
in [ … ] |
Membership | filter status in [500, 502, 503, 504] |
not in [ … ] |
Non-membership | filter route not in ["/health","/ping"] |
=~ |
Regex match (alias for like /…/) |
filter route =~ /^\/api\/v[12]\// |
ispresent(f) |
Field exists on the event | filter ispresent(orderId) |
isempty(f) / isblank(f) |
Empty / blank string checks | filter not isblank(userId) |
The distinction that trips people: = is exact, like "x" is substring, and like /x/ is regex. filter level="ERROR" matches only the exact value; filter @message like "ERROR" matches anywhere in the line.
stats … by … bin() — the workhorse
stats aggregates, and by groups. The magic ingredient for time series is bin(period), which buckets @timestamp into intervals so you get a value per interval — the shape of almost every dashboard-style query.
| Aggregate | Returns |
|---|---|
count() |
Number of matching events |
count_distinct(f) |
Distinct values of a field |
sum(f) / avg(f) |
Sum / mean of a numeric field |
min(f) / max(f) |
Extremes |
pct(f, n) |
The n-th percentile (e.g. pct(latencyMs,99)) |
stddev(f) |
Standard deviation |
earliest(f) / latest(f) |
First/last value by time |
# Error rate per 5 minutes, split by route
filter status >= 500
| stats count() as errors by route, bin(5m)
| sort bin(5m) asc
# p50 / p90 / p99 latency per minute from a JSON field
filter ispresent(latencyMs)
| stats pct(latencyMs,50) as p50,
        pct(latencyMs,90) as p90,
        pct(latencyMs,99) as p99 by bin(1m)
bin() takes s/m/h/d units (bin(30s), bin(5m), bin(1h)). Choose the bin to match the window — 5-minute bins over an hour, hourly bins over a week.
parse — glob and regex extraction
When a log is not clean JSON, parse pulls fields out of a string. It has two modes:
| Mode | Syntax | When | Gotcha |
|---|---|---|---|
| Glob | parse @message "text * more *" as a, b |
Simple, positional extraction | * matches greedily-but-bounded; the literal text around it must match exactly, spaces included |
| Regex | parse @message /(?<a>\d+)ms.*(?<b>\w+)/ |
Complex/validated extraction | Use named capture groups (?<name>…); escape metacharacters; extracted values are strings — cast for numeric compares |
# Glob: pull a latency number out of "…took 812ms…"
parse @message "took *ms" as latencyStr
| fields latencyStr * 1 as latencyMs      # cast to number
| stats pct(latencyMs, 99) by bin(5m)
# Regex: extract status and path from an access line, with named groups
parse @message /"(?<method>\w+)\s(?<path>\S+)"\s(?<status>\d{3})/
| filter status >= "500"
| stats count() by path, status
parse operates on @message by default but can target any field (parse someField "…"). You can chain multiple parse commands. The most common failure — covered in the playbook — is a glob whose surrounding literal text doesn’t match the real line character-for-character.
sort, limit, dedup, diff
sort f asc|descorders results; combine withlimitfor top-N (sort errors desc | limit 10).limit ncaps output (max 10,000 rows). Insights returns at most this many; narrow withfilter/statsfirst.dedup f1, f2keeps the first row per unique combination — perfect for “one line perorderId” or collapsing retries.diffcompares the current time range to the immediately preceding equal range, surfacing what changed (new error patterns, count deltas) — invaluable for “what’s different since the deploy.”
# Top 10 noisiest error messages, one row each
filter level="ERROR"
| stats count() as n by errorType
| sort n desc
| limit 10
Timeseries & visualizations
Any query whose results include bin() in the by clause can be flipped from a table to a line/stacked-area chart in the console (Visualization tab). stats … by bin(5m) with no other grouping gives one line; adding a dimension (by route, bin(5m)) gives one line per value — the standard “errors by route over time” panel. You can add these visualizations straight onto a CloudWatch dashboard.
Natural-language query generation
CloudWatch Logs Insights includes an AI-powered query generator: you type a plain-English prompt (“show me the 99th percentile latency per minute for failed requests”) and it produces a Logs Insights query you can run or refine. It is excellent for remembering syntax under pressure and for discovering fields, but read the query before running it — it can pick the wrong field or a wide time range, and Insights bills per GB scanned. Treat it as a fast first draft, not an oracle. (CloudWatch has also added OpenSearch PPL and SQL dialects for Logs Insights; this article teaches the original Logs Insights language, which remains the default and the most widely documented.)
The query cookbook
Keep this table open — each row turns a vague “it’s slow / it’s failing” into a confirmed answer in one paste. (Pipes shown as \| for the table; use a real | when you paste.)
| Goal | Query |
|---|---|
| Error rate per 5 min | filter status>=500 | stats count() as errs by bin(5m) |
| Top failing routes | filter status>=500 | stats count() by route | sort count() desc | limit 10 |
| p99 latency per minute | filter ispresent(latencyMs) | stats pct(latencyMs,99) by bin(1m) |
| Count by log level | stats count() by level |
| Slowest 20 requests | sort latencyMs desc | limit 20 | display @timestamp,route,latencyMs |
| Unique users hitting an error | filter level="ERROR" | stats count_distinct(userId) |
| Parse a latency from text | parse @message "took *ms" as ms | stats avg(ms*1) |
| One line per order (dedup retries) | filter ispresent(orderId) | dedup orderId |
| Which instance is noisy | filter level="ERROR" | stats count() by @logStream | sort count() desc |
| Requests from one IP | filter sourceIp="203.0.113.9" | sort @timestamp desc |
| Lambda cold-start p99 | filter @type="REPORT" | stats pct(@initDuration,99) by bin(5m) |
| Memory pressure | filter @type="REPORT" | stats max(@maxMemoryUsed) as used, avg(@memorySize) as limit by bin(5m) |
| What changed since deploy | filter level="ERROR" | stats count() by errorType | diff |
| 5xx by status family | filter status in [500,502,503,504] | stats count() by status, bin(5m) |
Saved queries
Any query you write can be saved (console “Queries” folder, or PutQueryDefinition via API) with a name and folder, and reused across the team. Saved queries are stored per account/region and show up in everyone’s Insights console — build a shared library of your incident queries so nobody re-derives the p99 query at 3 a.m.
aws logs put-query-definition --name "incident/5xx-rate" \
  --log-group-names /app/orders \
  --query-string 'filter status>=500 | stats count() by bin(5m)'
Metric filters: a log pattern becomes an alarm
Logs Insights answers questions when you ask. To be paged automatically, you convert a recurring log pattern into a CloudWatch metric with a metric filter, then alarm on that metric. The filter scans incoming events and, for each match, publishes a value to a metric.
| Element | What it is | Notes |
|---|---|---|
| Filter pattern | What to match (text terms, JSON selectors, or regex) | Empty pattern = every event (a raw count) |
| Metric name / namespace | The metric it publishes to | Your custom namespace |
| Metric value | The value per match | 1 for a count, or $.latency to publish a field’s value |
| Default value | Value emitted when no event matches in a period | Set to 0 so the metric isn’t sparse (critical for alarms) |
| Dimensions | Up to 3, sourced from JSON fields | Each unique combo becomes a billable custom metric |
| Unit | The metric unit | e.g. Count, Milliseconds |
The filter pattern language (distinct from Logs Insights QL — this is the older filter syntax) has three flavours:
| Style | Syntax | Example |
|---|---|---|
| Unstructured terms | Space-separated terms (AND), "quoted phrase", -exclude, ?a ?b (OR) |
ERROR -Deprecation |
| Space-delimited fields | [ ] with positional fields + conditions |
[ip, id, user, ts, request, status_code=4*, size] |
| JSON selectors | { $.field = value } with &&, ||, =, !=, <, >, wildcards * |
{ $.level = "ERROR" && $.status >= 500 } |
Metric filters now also support regular expressions in the pattern ({ $.msg = %timed out% }), which makes matching JSON string fields far more precise than glob wildcards.
The three ways to get a metric from logs, side by side:
| Metric filter | EMF | PutMetricData |
|
|---|---|---|---|
| You need | Logs you already emit | To add an _aws block |
Explicit API calls |
| Cardinality | Low (≤3 dims) | High | High (but throttles) |
| Cost model | Custom metric per dim combo | Ingestion + extracted metrics | Per-metric + API |
| Log kept? | Yes (it’s still a log) | Yes | No |
| Best for | Alarming on a known string | App metrics + raw line | Bespoke, immediate |
# Metric filter: count ERROR lines into a custom metric, defaulting to 0
aws logs put-metric-filter --log-group-name /app/orders \
  --filter-name error-count --filter-pattern '{ $.level = "ERROR" }' \
  --metric-transformations \
    metricName=AppErrors,metricNamespace=Orders,metricValue=1,defaultValue=0

# Alarm: page if > 5 errors in 5 minutes (missing data treated as notBreaching)
aws cloudwatch put-metric-alarm --alarm-name orders-error-spike \
  --namespace Orders --metric-name AppErrors --statistic Sum \
  --period 300 --evaluation-periods 1 --threshold 5 \
  --comparison-operator GreaterThanThreshold \
  --treat-missing-data notBreaching \
  --alarm-actions "$SNS_TOPIC_ARN"
resource "aws_cloudwatch_log_metric_filter" "errors" {
  name           = "error-count"
  log_group_name = aws_cloudwatch_log_group.orders.name
  pattern        = "{ $.level = \"ERROR\" }"
  metric_transformation {
    name          = "AppErrors"
    namespace     = "Orders"
    value         = "1"
    default_value = "0"          # so the metric is continuous, not sparse
  }
}

resource "aws_cloudwatch_metric_alarm" "error_spike" {
  alarm_name          = "orders-error-spike"
  namespace           = "Orders"
  metric_name         = "AppErrors"
  statistic           = "Sum"
  period              = 300
  evaluation_periods  = 1
  threshold           = 5
  comparison_operator = "GreaterThanThreshold"
  treat_missing_data  = "notBreaching"
  alarm_actions       = [aws_sns_topic.alerts.arn]
}
The default value = 0 detail is the one that separates a working alarm from a broken one: without it, periods with no matching events produce no data point, the metric is sparse, and your alarm can sit in INSUFFICIENT_DATA instead of counting. That failure mode is the whole subject of Why Your CloudWatch Alarm Isn’t Triggering.
Subscription filters & Live Tail: streaming logs out
A subscription filter delivers matching log events, in near real time, to a streaming destination — the mechanism behind “send our logs to the SIEM / the data lake / OpenSearch.” Events are delivered base64-encoded and gzip-compressed, so the consumer must decompress them.
| Destination | How | IAM requirement |
|---|---|---|
| Lambda | CWL invokes the function per batch | Resource-based policy on the function allowing logs.<region>.amazonaws.com to InvokeFunction, scoped by the log-group ARN |
| Kinesis Data Streams | CWL puts records to the stream | An IAM role CWL assumes (trust logs.amazonaws.com) with kinesis:PutRecord |
| Amazon Data Firehose | CWL delivers to a Firehose stream → S3/OpenSearch/Splunk | A role with firehose:PutRecord* (Firehose then transforms/loads) |
| OpenSearch | Via a managed Lambda (console wizard) or through Firehose | The Lambda/Firehose role + OpenSearch access policy |
| Cross-account | CWL → a destination (Kinesis) in another account | A destination resource + destination access policy in the target account |
Two scoping levels exist:
| Scope | What it covers | Limit | Use |
|---|---|---|---|
| Log-group subscription filter | One specific group | 2 per log group | Targeted streaming of one service’s logs |
| Account-level subscription policy | All (or a selection of) groups in the account | 1 account-level policy | Blanket “ship everything to the SIEM” with include/exclude patterns |
# Grant CloudWatch Logs permission to invoke the destination Lambda (the step people miss)
aws lambda add-permission --function-name log-forwarder \
  --statement-id cwlogs --action lambda:InvokeFunction \
  --principal logs.ap-south-1.amazonaws.com \
  --source-arn "arn:aws:logs:ap-south-1:111122223333:log-group:/app/orders:*"

# Subscribe: stream only 5xx lines to the Lambda in real time
aws logs put-subscription-filter --log-group-name /app/orders \
  --filter-name to-lambda --filter-pattern '{ $.status >= 500 }' \
  --destination-arn "arn:aws:lambda:ap-south-1:111122223333:function:log-forwarder"
resource "aws_lambda_permission" "cwlogs" {
  statement_id  = "cwlogs"
  action        = "lambda:InvokeFunction"
  function_name = aws_lambda_function.forwarder.function_name
  principal     = "logs.ap-south-1.amazonaws.com"
  source_arn    = "${aws_cloudwatch_log_group.orders.arn}:*"
}

resource "aws_cloudwatch_log_subscription_filter" "to_lambda" {
  name            = "to-lambda"
  log_group_name  = aws_cloudwatch_log_group.orders.name
  filter_pattern  = "{ $.status >= 500 }"
  destination_arn = aws_lambda_function.forwarder.arn
  depends_on      = [aws_lambda_permission.cwlogs]
}
Live Tail
Live Tail is an interactive, near-real-time stream of matching events straight into the console (or via StartLiveTail) — the CloudWatch equivalent of tail -f across a log group, with filtering and keyword highlighting. It is the fastest way to watch a deploy or reproduce an issue live. It is billed per minute of an active session (≈ $0.01/min), so start it to watch, and stop it when you’re done — an idle-forgotten Live Tail session is a small but real recurring charge. Live Tail requires the Standard log class.
Cross-log-group & cross-account queries
A single Insights query can span up to 50 log groups — select several groups (or use SOURCE/log-group-class selection in the newer console) to correlate a request across services in one pass. Use @log/@logGroup to tell the sources apart in the results.
For cross-account, the modern mechanism is CloudWatch cross-account observability, built on Observability Access Manager (OAM). You designate a monitoring account, create a sink in it, and create a link from each source account — after which the monitoring account can query the source accounts’ Logs, Metrics and Traces as if local.
| Piece | Lives in | Role |
|---|---|---|
| Monitoring account | Central | Where operators run queries + dashboards |
| Sink | Monitoring account | The endpoint source accounts attach to |
| Link | Source account | Grants the sink access to this account’s telemetry |
| Shared types | — | AWS::Logs::LogGroup, AWS::CloudWatch::Metric, AWS::XRay::Trace, App Insights |
| Query scope | How | Note |
|---|---|---|
| Single group | Pick one group | The default |
| Multiple groups | Select up to 50 | Correlate across services |
| By log-group class | Select Standard and/or IA | Both classes are queryable |
| Cross-account | Via OAM link, in the monitoring account | Query many accounts at once |
Architecture at a glance
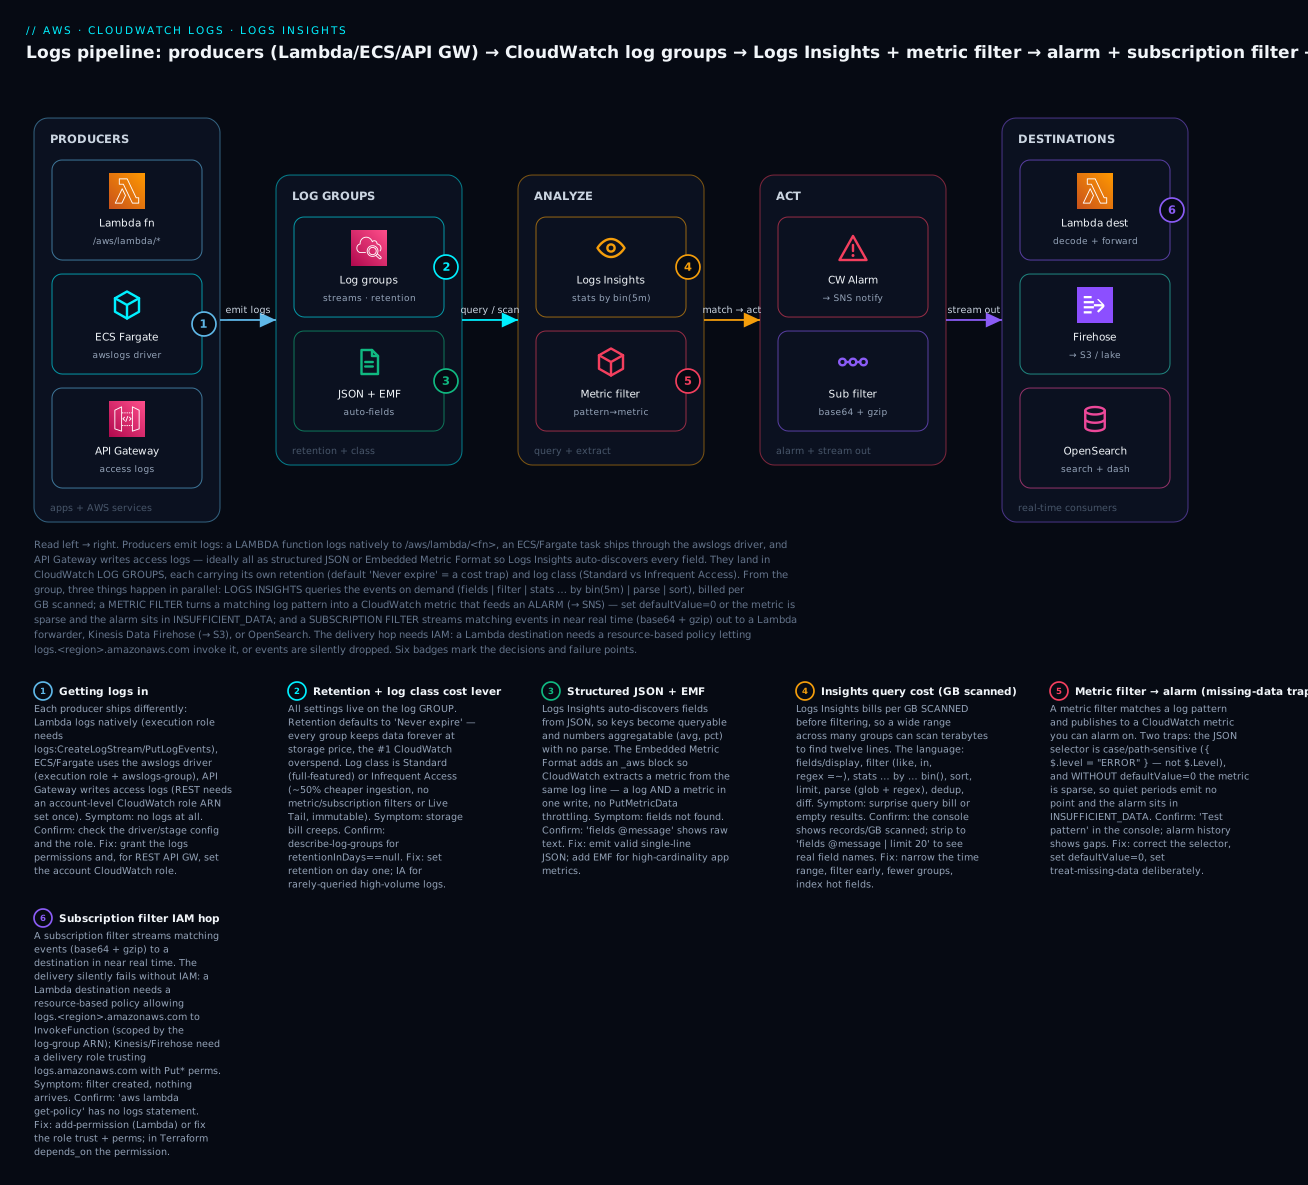
The diagram traces a log event from birth to action. Read left to right: your producers — a Lambda function (native logging), an ECS/Fargate task (the awslogs driver), and API Gateway (access logs) — emit structured JSON / EMF into CloudWatch Log groups, each carrying its own retention and log class. From the group, three things happen in parallel: Logs Insights queries the events on demand (stats … by bin(5m)), a metric filter turns a matching pattern into a CloudWatch metric that feeds an alarm (→ SNS), and a subscription filter streams matching events in real time out to a Lambda / Kinesis Firehose / OpenSearch destination. The six numbered badges mark the decisions and failure points that this article drills into — how logs get in, the retention/log-class cost lever, structured-JSON/EMF field discovery, the per-GB-scanned query cost, the metric-filter-to-alarm missing-data trap, and the subscription-filter IAM hop where delivery silently fails.
Real-world scenario
LedgerPay, a fintech on ap-south-1, ran a checkout API on Lambda behind API Gateway, a settlement worker on ECS Fargate, and a nightly reconciliation batch. Their CloudWatch bill had tripled in a year while traffic only doubled, and every incident meant three engineers grepping three different log formats in three consoles. Two problems, one root cause: no structure and no discipline.
The bill came apart under a five-minute audit. The one-liner describe-log-groups --query 'logGroups[?retentionInDays==null]' returned 340 log groups on Never expire — years of Lambda logs from deleted functions, ECS debug streams, and a verbose flow-logs group ingesting 40 GB/day. Storage alone was most of the overage. They set 30-day retention on operational groups via a tagging-driven Terraform loop, moved the high-volume flow-logs and debug groups to the Infrequent Access log class (halving that ingestion cost, and they only ever queried them forensically), and exported the two groups with a genuine 7-year compliance need to S3 instead of paying CloudWatch storage for a decade. The monthly logs bill fell by more than half within a cycle.
The incident-response problem was structural. The checkout Lambda logged free text ("payment failed: gateway said no for order o-8842"), so nobody could compute a failure rate — “failed” appeared in a dozen shapes. They switched every service to structured JSON ({"level","route","status","latencyMs","orderId","gatewayCode"}) and added an EMF block on the settlement worker so SettlementLatencyMs became a real metric dimensioned by Rail without a single PutMetricData call. Suddenly the whole SLO was one query: filter status>=500 | stats count() as errs by gatewayCode, bin(5m). They built a metric filter on { $.level = "ERROR" && $.status >= 500 } with defaultValue=0, wired it to an alarm → SNS, and — critically — set treat_missing_data = notBreaching so a quiet minute didn’t leave the alarm stuck in INSUFFICIENT_DATA.
Then the reconciliation batch failed silently one Sunday. The tell was in a subscription filter they had wired to a Firehose → OpenSearch pipeline for their security team: the security dashboard showed the batch’s structured AUDIT lines just stop at 02:04. A Logs Insights diff on the batch’s group made the cause obvious in one query — a new errorType="SchemaMismatch" that appeared only after that night’s deploy. Because the logs were structured and streamed, the security team saw it the same minute the batch did. The runbook line they added: structure at the source, set retention on day one, and turn the patterns that page you into metric filters — the logs are only as useful as the query you can run at 2 a.m.
Advantages and disadvantages
CloudWatch Logs is the path of least resistance on AWS — everything ships there by default — but “default” cuts both ways.
| Advantages | Disadvantages / traps |
|---|---|
| One durable, centralized destination for every AWS source | Default Never expire retention silently grows the bill |
| Native integration (Lambda/ECS/API GW) — near-zero setup | Ingestion price is real at volume; verbose logging is expensive |
| Logs Insights: rates, percentiles, top-N without a data pipeline | Insights bills per GB scanned — wide queries cost money |
| Metric filters + EMF turn logs into metrics and alarms | Metric filters are Standard-class only; sparse without defaultValue |
| Subscription filters stream in real time to Lambda/Kinesis/OpenSearch | Delivery fails silently on a missing destination IAM permission |
| IA log class + export-to-S3 give cheap long-term options | Log class is immutable after creation; IA drops filters/tail |
| Cross-account observability via OAM — one pane over many accounts | OAM setup (sink/link) is an extra moving part to get right |
The advantages dominate when you treat logs as a product: structured at the source, retained deliberately, queried with Insights, and alarmed via metric filters. The disadvantages dominate when you treat CloudWatch Logs as a write-only landfill — unstructured text, no retention, no structure — at which point you get the bill of an observability platform with the utility of cat.
Hands-on lab
You will ship structured JSON logs, run the core Logs Insights queries, build a metric filter → alarm, and wire a subscription filter to a Lambda. Everything is free-tier-friendly (a few pennies of logs/Insights); teardown is at the end. Run in CloudShell (Bash) in ap-south-1, where aws is pre-authenticated.
Step 0 — Variables and a log group with retention.
export AWS_DEFAULT_REGION=ap-south-1
ACCT=$(aws sts get-caller-identity --query Account --output text)
LG=/app/lab-orders
aws logs create-log-group --log-group-name "$LG"
aws logs put-retention-policy --log-group-name "$LG" --retention-in-days 3
aws logs describe-log-groups --log-group-name-prefix "$LG" \
  --query 'logGroups[0].{name:logGroupName,days:retentionInDays,class:logGroupClass}'
Expected: the group exists with days: 3 and class: STANDARD — you never left it Never expire.
Step 1 — Ship structured JSON events. Create a stream and put a handful of JSON lines with varied status and latencyMs.
ST="lab-$(date +%s)"
aws logs create-log-stream --log-group-name "$LG" --log-stream-name "$ST"
now() { echo $(( $(date +%s) * 1000 )); }
put() { aws logs put-log-events --log-group-name "$LG" --log-stream-name "$ST" \
  --log-events timestamp=$(now),message="$1" >/dev/null; }

put '{"level":"INFO","route":"/pay","status":200,"latencyMs":120,"orderId":"o-1"}'
put '{"level":"ERROR","route":"/pay","status":500,"latencyMs":812,"orderId":"o-2"}'
put '{"level":"ERROR","route":"/pay","status":502,"latencyMs":934,"orderId":"o-3"}'
put '{"level":"INFO","route":"/cart","status":200,"latencyMs":75,"orderId":"o-4"}'
put '{"level":"ERROR","route":"/pay","status":500,"latencyMs":1020,"orderId":"o-5"}'
echo "shipped; wait ~15s for ingestion before querying"
Step 2 — Run Logs Insights queries via the CLI. Start a query, then fetch results. (In the console this is the Logs Insights tab; here we script it.)
QID=$(aws logs start-query --log-group-name "$LG" \
  --start-time $(( $(date +%s) - 900 )) --end-time $(date +%s) \
  --query-string 'filter status >= 500 | stats count() as errors by route, status' \
  --query queryId --output text)
sleep 5
aws logs get-query-results --query-id "$QID" --query 'results' --output table
Expected: route=/pay with status=500 → errors=2 and status=502 → errors=1. You just computed an error breakdown from JSON fields you never had to parse.
Now a percentile query on the numeric field:
QID=$(aws logs start-query --log-group-name "$LG" \
  --start-time $(( $(date +%s) - 900 )) --end-time $(date +%s) \
  --query-string 'filter ispresent(latencyMs) | stats pct(latencyMs,99) as p99, avg(latencyMs) as avg by bin(5m)' \
  --query queryId --output text)
sleep 5
aws logs get-query-results --query-id "$QID" --query 'results' --output table
Expected: a p99 near 1020 and an average across all five events — proof that JSON numbers are directly aggregatable.
Step 3 — A parse query (glob). Prove parse on a text field by extracting the numeric part of orderId:
QID=$(aws logs start-query --log-group-name "$LG" \
  --start-time $(( $(date +%s) - 900 )) --end-time $(date +%s) \
  --query-string 'parse orderId "o-*" as n | stats count() by n | sort n asc' \
  --query queryId --output text)
sleep 5
aws logs get-query-results --query-id "$QID" --query 'results' --output table
Expected: five rows 1..5, one each — the glob matched the literal o- prefix and captured the rest.
Step 4 — Metric filter → alarm. Turn the ERROR pattern into a metric with defaultValue=0, then alarm on it.
aws logs put-metric-filter --log-group-name "$LG" \
  --filter-name lab-errors --filter-pattern '{ $.level = "ERROR" }' \
  --metric-transformations \
    metricName=LabAppErrors,metricNamespace=LabOrders,metricValue=1,defaultValue=0

TOPIC=$(aws sns create-topic --name lab-alerts --query TopicArn --output text)
aws cloudwatch put-metric-alarm --alarm-name lab-error-spike \
  --namespace LabOrders --metric-name LabAppErrors --statistic Sum \
  --period 300 --evaluation-periods 1 --threshold 2 \
  --comparison-operator GreaterThanThreshold \
  --treat-missing-data notBreaching --alarm-actions "$TOPIC"

# Re-send the three ERROR lines so the filter publishes, then check the metric
for s in 500 502 500; do put "{\"level\":\"ERROR\",\"route\":\"/pay\",\"status\":$s}"; done
sleep 60
aws cloudwatch get-metric-statistics --namespace LabOrders --metric-name LabAppErrors \
  --start-time "$(date -u -v-15M +%FT%TZ)" --end-time "$(date -u +%FT%TZ)" \
  --period 300 --statistics Sum --query 'Datapoints[].Sum'
Expected: a non-zero Sum datapoint appears (metric-filter extraction takes a minute or two). Because you set defaultValue=0, quiet periods still emit 0 rather than nothing — the alarm can evaluate continuously.
Step 5 — Subscription filter to a Lambda. Create a tiny forwarder, grant CloudWatch Logs permission to invoke it (the step everyone forgets), then subscribe.
ROLE=$(aws iam create-role --role-name lab-fwd-role \
  --assume-role-policy-document '{"Version":"2012-10-17","Statement":[{"Effect":"Allow","Principal":{"Service":"lambda.amazonaws.com"},"Action":"sts:AssumeRole"}]}' \
  --query Role.Arn --output text)
aws iam attach-role-policy --role-name lab-fwd-role \
  --policy-arn arn:aws:iam::aws:policy/service-role/AWSLambdaBasicExecutionRole
sleep 10

cat > fwd.py <<'PY'
import base64, gzip, json
def handler(event, context):
    raw = base64.b64decode(event["awslogs"]["data"])
    payload = json.loads(gzip.decompress(raw))
    for e in payload["logEvents"]:
        print("FORWARDED:", e["message"])
    return {"ok": True}
PY
zip -q fwd.zip fwd.py
aws lambda create-function --function-name lab-fwd \
  --runtime python3.12 --handler fwd.handler --role "$ROLE" \
  --zip-file fileb://fwd.zip --timeout 10

# THE step people miss: let CloudWatch Logs invoke the function
aws lambda add-permission --function-name lab-fwd --statement-id cwlogs \
  --action lambda:InvokeFunction --principal logs.ap-south-1.amazonaws.com \
  --source-arn "arn:aws:logs:ap-south-1:$ACCT:log-group:$LG:*"

aws logs put-subscription-filter --log-group-name "$LG" \
  --filter-name to-lambda --filter-pattern '{ $.level = "ERROR" }' \
  --destination-arn "arn:aws:lambda:ap-south-1:$ACCT:function:lab-fwd"

# Trigger it and read the forwarder's own logs
put '{"level":"ERROR","route":"/pay","status":500,"orderId":"o-99"}'
sleep 20
aws logs tail /aws/lambda/lab-fwd --since 2m --format short | grep FORWARDED
Expected: the forwarder’s log group shows a FORWARDED: {"level":"ERROR"...} line — CloudWatch Logs decompressed-and-delivered the matching event in near real time. If you skip the add-permission step, the subscription is created but nothing is ever delivered — the classic silent failure.
Validation checklist.
| Step | What you proved | The key detail |
|---|---|---|
| 0 | Retention set at creation | Never leave a group Never expire |
| 1–2 | JSON fields are auto-queryable | No parse needed for status/latencyMs |
| 2 | Percentiles from a numeric field | pct(latencyMs,99) on JSON numbers |
| 3 | parse glob extraction |
Literal o- prefix must match exactly |
| 4 | Metric filter → alarm | defaultValue=0 keeps the metric continuous |
| 5 | Subscription filter → Lambda | Delivery needs the resource-based add-permission |
Teardown (⚠️ do this — small but real).
aws logs delete-subscription-filter --log-group-name "$LG" --filter-name to-lambda
aws logs delete-metric-filter --log-group-name "$LG" --filter-name lab-errors
aws lambda delete-function --function-name lab-fwd
aws cloudwatch delete-alarms --alarm-names lab-error-spike
aws sns delete-topic --topic-arn "$TOPIC"
aws logs delete-log-group --log-group-name "$LG"
aws logs delete-log-group --log-group-name /aws/lambda/lab-fwd
aws iam detach-role-policy --role-name lab-fwd-role \
  --policy-arn arn:aws:iam::aws:policy/service-role/AWSLambdaBasicExecutionRole
aws iam delete-role --role-name lab-fwd-role
Common mistakes & troubleshooting
The playbook — the part you bookmark. First the scannable table, then the nastiest failures in full. Every row is a real failure with the exact symptom, root cause, the precise way to confirm it, and the fix.
| # | Symptom | Root cause | Confirm (exact cmd / console) | Fix |
|---|---|---|---|---|
| 1 | Insights query returns nothing | Time range doesn’t cover the events | Widen the picker; check @timestamp vs @ingestionTime |
Set the range to when events actually occurred |
| 2 | Query returns nothing | Wrong log group selected | Confirm the group name; run describe-log-groups |
Select the correct group(s) |
| 3 | filter field="X" matches nothing |
JSON field name case mismatch (Level vs level) |
fields @message and read the real key |
Match the exact case; JSON fields are case-sensitive |
| 4 | Fields not discovered at all | Logs aren’t valid JSON (mixed text) | fields @message shows raw text, no fields |
Emit valid single-line JSON; or parse the text |
| 5 | field > 100 never true |
Number stored as a string | fields field shows quotes |
Cast: field * 1 / parse then multiply |
| 6 | parse glob extracts nothing |
Literal text around * doesn’t match exactly |
Test with just `parse … | display` the field |
| 7 | parse regex extracts nothing |
No named groups, or unescaped metachar | Simplify the regex; add (?<name>…) |
Use named capture; escape . / [ etc. |
| 8 | Metric filter produces no data | Pattern never matches; or no defaultValue |
“Test pattern” in console against sample events | Fix the JSON selector; set defaultValue=0 |
| 9 | Alarm stuck INSUFFICIENT_DATA |
Metric sparse (no default value) | Alarm history + metric graph shows gaps | defaultValue=0 + treat_missing_data=notBreaching |
| 10 | Subscription filter delivers nothing (Lambda) | Missing resource-based invoke permission | aws lambda get-policy lacks logs.*.amazonaws.com |
aws lambda add-permission with the log-group source-arn |
| 11 | Subscription filter delivers nothing (Kinesis/Firehose) | Delivery role can’t be assumed / lacks write perms | Check role trust logs.amazonaws.com + Put* perms |
Fix trust policy + grant kinesis/firehose Put* |
| 12 | “Can’t add subscription/metric filter” | Group is Infrequent Access class | describe-log-groups shows INFREQUENT_ACCESS |
Recreate as Standard (class is immutable) |
| 13 | Logs gone / retention deleted them | Short retention aged them out (or never captured) | describe-log-groups shows the retentionInDays |
Raise retention; export to S3 for long-term keep |
| 14 | Surprise Insights query bill | Query scanned huge GB (wide range × many groups) | Console shows “records/GB scanned” per query | Narrow the time range; filter early; fewer groups; index fields |
| 15 | Cross-account query sees nothing | OAM sink/link not configured | Check monitoring account’s linked sources | Create the OAM sink + per-account link |
| 16 | Live Tail shows nothing / errors | IA class, or no matching events | Confirm Standard class; loosen the filter | Use a Standard group; broaden the keyword |
| 17 | Consumer gets garbage from a subscription | Payload is base64 + gzip, read as text | Inspect raw record | Base64-decode then gunzip before parsing |
| 18 | No API Gateway logs at all | Account-level CloudWatch role ARN not set (REST) | aws apigateway get-account shows null role |
update-account with a role that has the CWL managed policy |
The three that waste the most time, expanded:
A. The subscription filter that delivers nothing (the silent IAM hop). You create a subscription filter to a Lambda, the API returns success, and nothing ever arrives — no error, no invocation, no clue. The cause is almost always the missing resource-based policy: CloudWatch Logs invokes your function as the service principal logs.<region>.amazonaws.com, and unless the function’s policy explicitly allows that principal to lambda:InvokeFunction (ideally scoped by the log-group ARN as source-arn), the invoke is denied and silently dropped. Confirm: aws lambda get-policy --function-name <fn> — if there’s no statement for logs.*.amazonaws.com, that’s it. For Kinesis/Firehose destinations the equivalent is the delivery role: CloudWatch Logs assumes an IAM role you provide, so its trust policy must allow logs.amazonaws.com to assume it and the role must carry kinesis:PutRecord/firehose:PutRecordBatch. Fix: add the add-permission (Lambda) or fix the role trust + permissions (Kinesis/Firehose). Terraform users: add depends_on = [aws_lambda_permission.cwlogs] so the permission exists before the subscription is created, or the first apply races.
B. The query that returns nothing (and it’s not a bug). Nine times out of ten, an empty Logs Insights result is one of three things, in order of likelihood: the time range doesn’t cover the events (the picker defaults narrow, and events are timestamped by event time, not when you query), the wrong log group is selected, or a field name case mismatch (filter Level="ERROR" when the key is level). Confirm: strip the query down to fields @timestamp, @message | limit 20 over a wide range to prove events exist and to read the actual field names, then rebuild the filter. The subtle version is numbers-as-strings: filter latencyMs > 500 silently matches nothing if latencyMs arrived quoted ("812"); fields latencyMs shows the quotes, and latencyMs * 1 casts it. And remember Insights bills per GB scanned, so the fix for “nothing found” is not “widen to 30 days across every group” — narrow, don’t blast.
C. The metric filter with no data and the alarm that never fires. You build a metric filter, wire an alarm, and it sits forever in INSUFFICIENT_DATA even though errors are happening. Two root causes stack. First, the filter pattern doesn’t match — a JSON selector like { $.level = "ERROR" } is case- and path-sensitive, and { $.Level = "error" } matches nothing; the console’s Test pattern button run against real sample events tells you instantly. Second — and this is the one that surprises people — without a defaultValue, the metric is sparse: it only publishes a data point in periods where something matched, so quiet periods produce no point, the metric is discontinuous, and the alarm can’t evaluate cleanly. Fix: set defaultValue=0 on the metric transformation so every period emits (0 when nothing matched), and set the alarm’s treat_missing_data deliberately (notBreaching for error counts). This missing-data behaviour is subtle enough to have its own dedicated playbook in Why Your CloudWatch Alarm Isn’t Triggering.
Best practices
- Set retention on every log group, on day one.
Never expireis the default and the #1 CloudWatch overspend. Bakeretention_in_daysinto your Terraform module so a group can’t be born without it. - Structure logs as JSON at the source. Fields you don’t emit as JSON are fields you’ll
parseunder pressure. Makelevel, a request/correlation ID, and key numerics first-class. - Use the Infrequent Access log class for high-volume, rarely-queried logs. Half the ingestion cost, full Insights querying; just remember it’s Standard-only for metric/subscription filters and it’s immutable.
- Emit EMF for high-cardinality app metrics. You get the metric and the raw log in one write, with no
PutMetricDatathrottling. - Give every metric filter a
defaultValue(usually 0). A sparse metric breaks alarms; a continuous one evaluates cleanly. - Scope Insights queries tight. Narrow the time range,
filterearly, and query the fewest groups you need — Insights bills per GB scanned. Add field indexes for fields you filter on constantly. - Always attach the destination permission before the subscription filter. Lambda needs the resource-based
add-permission; Kinesis/Firehose need the delivery role trust + perms. In Terraform,depends_onit. - Build a shared library of saved queries. Your incident 5xx-rate, p99, and cold-start queries should be one click, not re-derived at 3 a.m.
- Export to S3 for cheap long-term retention instead of paying CloudWatch storage for years; keep only the hot window in CloudWatch.
- Encrypt sensitive log groups with a CMK and add a data-protection policy to mask PII (emails, cards) at ingest.
- Alarm on log patterns, don’t watch them. If a log line means “page me,” it should be a metric filter + alarm, not something a human notices in Live Tail.
- Set up cross-account observability (OAM) before the incident, so you query many accounts from one monitoring account instead of hopping consoles mid-outage.
Security notes
- Least-privilege producer roles. A Lambda execution role or ECS task role needs only
logs:CreateLogStreamandlogs:PutLogEventson its own group (plusCreateLogGroupif it self-creates) — notlogs:*on*. - Encrypt at rest with a customer-managed KMS key for regulated logs, and grant the producing service
kms:GenerateDataKeyon exactly that key; grant readerskms:Decrypt. - Mask sensitive data with a data-protection policy. CloudWatch Logs can detect and redact PII (emails, credit cards, SSNs) inline, storing the masked value and requiring an explicit
logs:Unmaskpermission (andunmask()in a query) to reveal it — so a log line is not an accidental PII store. - Guard the subscription-filter destinations. Streamed logs often contain full request context; lock down who can read the destination Kinesis stream / OpenSearch domain, and scope the CloudWatch Logs invoke permission by the specific log-group
source-arn, not*. - Restrict who can query.
logs:StartQuery/GetLogRecord/FilterLogEventsexpose raw log content; scope these to the groups a role needs, and prefer cross-account read via OAM over sharing credentials. - Treat CloudTrail-to-CloudWatch as a tamper-evident trail, not the system of record — keep the authoritative copy in S3 with Object Lock; the CWL copy is for real-time alarming.
Cost & sizing
CloudWatch Logs bills on three axes — ingestion (collect), storage (archive), and analysis (query) — plus a few extras. The failure mode is always the same: nobody sets retention, verbose logging inflates ingestion, and wide Insights queries surprise everyone on the analysis line.
| Cost driver | How it’s billed | Right-size by | Rough figure (varies by region) |
|---|---|---|---|
| Ingestion (Standard) | Per GB ingested | Log less; drop debug in prod; sample | ≈ $0.50/GB |
| Ingestion (Infrequent Access) | Per GB ingested | IA for rarely-queried high-volume logs | ≈ $0.25/GB (~50% off) |
| Storage | Per GB-month stored | Set retention; export to S3 for long-term | ≈ $0.03/GB-month |
| Logs Insights | Per GB scanned | Narrow range, filter early, fewer groups, index fields | ≈ $0.005/GB scanned |
| Live Tail | Per minute of active session | Stop the session when done | ≈ $0.01/min |
| Custom metrics from filters/EMF | Per custom metric (dimensioned) | Limit dimensions; ≤3 on metric filters | Standard custom-metric pricing |
| Vended logs (VPC flow, etc.) | Tiered, cheaper than app logs | Sample flow logs; aggregate | Lower per-GB tiers |
Sizing rules of thumb: ingestion is usually the biggest line, so the highest-leverage lever is logging less (structured logs are also smaller than verbose text) and moving firehose-volume logs to IA. Storage is dominated by the Never expire default — one put-retention-policy sweep across the account often cuts it by more than half. Analysis surprises teams because a single careless filter over 30 days across 40 groups can scan terabytes; keep queries scoped and lean on metric filters/EMF to pre-compute the numbers you check constantly (a metric read is far cheaper than re-scanning logs). In INR terms, a modest workload (tens of GB/month ingested, 7–30 day retention, scoped queries) runs in the low hundreds to low thousands of rupees; the blow-ups are always Never expire retention and unscoped queries, not the base rate.
Interview & exam questions
Q1. What’s the difference between a log group and a log stream, and where do settings live? A log group is the container that holds many streams and carries all settings — retention, log class, KMS, metric filters, subscription filters. A log stream is an ordered sequence of events from one source (one function instance, one container). You manage groups; producers create streams. (SOA-C02)
Q2. What is the default log retention, and why is it a problem?
The default is Never expire, so every group keeps data forever at storage prices — the most common CloudWatch overspend. Always set an explicit retention from the fixed allowed set (1 day … 10 years). (SOA-C02)
Q3. Standard vs Infrequent Access log class — when do you pick IA? IA costs ~50% less to ingest and still supports Logs Insights, but drops metric filters, subscription filters, Live Tail and data protection, and the class is fixed at creation. Pick IA for high-volume logs you only occasionally query (audit archives, verbose debug) that you’ll never alarm on or stream. (SOA-C02)
Q4. How do you turn a log pattern into an alarm?
Create a metric filter whose pattern matches the log lines, publishing to a custom metric (with defaultValue=0 so it’s continuous), then create a CloudWatch alarm on that metric with an appropriate treat_missing_data. (SOA-C02, DVA-C02)
Q5. A subscription filter to Lambda delivers nothing. What’s the first thing you check?
The function’s resource-based policy: CloudWatch Logs invokes as logs.<region>.amazonaws.com, so without an add-permission allowing that principal to InvokeFunction (scoped by the log-group ARN), the invoke is silently denied. aws lambda get-policy confirms it. (DVA-C02)
Q6. Explain stats count() by route, bin(5m).
It aggregates a count of matching events grouped by both the route field and 5-minute time buckets, yielding a per-route, per-5-minute time series — the basis of most Insights dashboards. (SOA-C02)
Q7. When does parse use glob vs regex, and what’s the common failure?
Glob (parse @message "a * b" as x) is positional and simple but requires the literal text around * to match exactly (spaces included); regex (parse @message /(?<x>\d+)/) uses named capture groups for complex extraction. The common failure is a glob whose surrounding literal doesn’t match the real line. (DVA-C02)
Q8. What is the Embedded Metric Format and why use it?
EMF is a JSON log convention with an _aws block that tells CloudWatch to extract metrics from the log line asynchronously — you get a high-cardinality metric and the raw queryable log in one write, with no PutMetricData throttling. (DVA-C02)
Q9. Why does structured JSON logging matter for Logs Insights?
Insights auto-discovers fields from JSON, so keys become directly queryable and numeric fields are aggregatable (avg, pct) without any parse. Unstructured text forces fragile regex on every query. (SOA-C02, DVA-C02)
Q10. How does Logs Insights charge, and how do you control it? Per GB scanned (before filtering). Control it by narrowing the time range, filtering early, querying fewer groups, adding field indexes, and pre-computing frequent numbers as metric filters/EMF rather than re-scanning. (SOA-C02)
Q11. How do you query logs across accounts? CloudWatch cross-account observability via Observability Access Manager: a monitoring account with a sink, and a link from each source account, after which the monitoring account queries all linked accounts’ logs/metrics/traces as if local. (SAP, SOA-C02)
Q12. Where do API Gateway’s two log types go, and what’s the REST gotcha?
Execution logs (managed group API-Gateway-Execution-Logs_<id>/<stage>) trace each request internally; access logs (a group you choose, formatted with $context variables) are one structured line per request. For REST APIs you must set an account-level CloudWatch role ARN once or logging does nothing. (DVA-C02)
Quick check
- What is the default retention on a new log group, and why should you always change it?
- You want to alarm when a specific error string appears in logs. Which two CloudWatch objects do you create, and what setting keeps the metric from being sparse?
- A Logs Insights query returns nothing. Name the three most likely causes, in order.
- Which log class would you choose for a 40 GB/day flow-logs group you only query forensically, and what do you give up?
- Your subscription filter to a Lambda was created successfully but no events arrive. What’s missing?
Answers
Never expire. Every group otherwise keeps data forever at storage prices — the most common CloudWatch overspend. Set an explicit retention from the allowed set.- A metric filter (log pattern → metric) and a CloudWatch alarm on that metric. Set
defaultValue=0on the metric transformation so quiet periods still emit a point and the alarm evaluates continuously. - (1) The time range doesn’t cover the events; (2) the wrong log group is selected; (3) a field name case/shape mismatch (e.g.
Levelvslevel, or a number stored as a string). - Infrequent Access — ~50% cheaper ingestion, still fully queryable in Logs Insights. You give up metric filters, subscription filters, Live Tail and data protection, and you can’t change the class later.
- The resource-based invoke permission: CloudWatch Logs (
logs.<region>.amazonaws.com) must be allowed tolambda:InvokeFunction, scoped by the log-groupsource-arn. Without it the invoke is silently denied.
Glossary
| Term | Definition |
|---|---|
| Log group | The container holding many streams and carrying all settings (retention, class, KMS, filters). |
| Log stream | An ordered sequence of log events from a single source (one function instance, container, or host). |
| Log event | A single timestamped record (a line or JSON object); up to 256 KB. |
| Retention | The age at which CloudWatch auto-deletes events; default Never expire; chosen from a fixed set of day values. |
| Log class | Standard (full-featured) or Infrequent Access (~50% cheaper ingestion, fewer features, immutable). |
| Logs Insights | The interactive query language over log events (fields, filter, stats … by bin(), parse, …); billed per GB scanned. |
| System field | An @-prefixed field Insights provides (@message, @timestamp, @logStream, @log, @ptr). |
| Structured logging | Emitting logs as JSON so Insights auto-discovers each key as a queryable field. |
| Embedded Metric Format (EMF) | A JSON log with an _aws block from which CloudWatch extracts metrics — a log line and a metric in one write. |
| Metric filter | A rule that matches a log pattern and publishes to a CloudWatch metric (Standard class only). |
| Subscription filter | A rule that streams matching events in near real time to Lambda/Kinesis/Firehose/OpenSearch (base64+gzip). |
| Live Tail | An interactive near-real-time stream of matching events into the console; billed per minute; Standard class. |
parse |
The Insights command that extracts fields from a string via glob (*) or regex named capture. |
bin() |
The Insights function that buckets @timestamp into intervals for time-series stats. |
| Cross-account observability (OAM) | A monitoring account queries source accounts’ logs/metrics/traces via a sink + per-account links. |
| Vended logs | Service-published logs (VPC Flow, Route 53, etc.) billed at cheaper tiered rates than app logs. |
Next steps
- Build the metrics-and-alarms half of observability in CloudWatch Metrics, Alarms & Dashboards, Hands-On.
- When an alarm you built here doesn’t fire, work Why Your CloudWatch Alarm Isn’t Triggering.
- Go deeper on container telemetry in Container Insights for EKS & ECS.
- Query the richest structured logs there are — Lambda’s — in AWS Lambda Errors, Timeouts & Cold Starts: The Troubleshooting Playbook.
- Turn network and audit logs into queries with VPC Flow Logs for Network Troubleshooting and CloudTrail, Config & Audit Compliance.