A pod is being OOM-killed and restarting every ninety seconds. On the node it looks fine — kubectl get pods shows it Running right now because you caught it between crashes — and the ALB in front of the service is throwing intermittent 502s that nobody can pin down. You open CloudWatch, and the only metrics you have are the EC2 host’s: node CPU at 40%, node memory at 55%. Healthy, apparently. The truth — that one container in that pod is pinned at its memory limit, restarting, and taking a slice of requests down with it every time — is completely invisible, because default CloudWatch stops at the instance boundary. It has never heard of a pod, a container, a task, a namespace, or a Kubernetes service.
Amazon CloudWatch Container Insights is the layer that fills that gap. It collects aggregated performance telemetry — CPU, memory, network, disk, and restart counts — at the cluster, node, pod, container, service, namespace, and task levels for both Amazon EKS and Amazon ECS, stores it as structured performance log events (in Embedded Metric Format, EMF) in CloudWatch Logs, extracts CloudWatch metrics from those events, and auto-builds a set of navigable dashboards that map cluster → node → pod → container. On EKS you get it by deploying a collector — the CloudWatch Observability add-on (the modern, managed path), a hand-rolled CloudWatch agent DaemonSet, or an ADOT (OpenTelemetry) collector — plus Fluent Bit for container logs. On ECS you get it by flipping a single cluster setting. Enhanced observability takes it further on both, adding per-container granularity and (on EKS) control-plane and detailed pod health.
This is the reference that takes you from “my container metrics don’t exist” to a working, alarmed, cost-controlled Container Insights setup on both runtimes. It treats Container Insights as what it actually is — an EMF pipeline that turns per-node collector output into aggregated metrics and searchable logs — and walks every moving part: what is collected and at which dimension, the three EKS collector paths and when each wins, the ECS cluster setting and its enhanced mode, Fargate’s gaps, Fluent Bit’s log routing and IAM, correlating metrics ↔ logs ↔ X-Ray traces, the Prometheus-native alternative on Amazon Managed Prometheus and Managed Grafana, and the cost model that will surprise you if you leave it on defaults. You build it on a real EKS cluster (add-on + IRSA) and a real ECS cluster (cluster setting), deploy workloads, watch pod and task CPU/memory, ship logs, build a dashboard, alarm on pod restarts, and tear it all down. It maps to the observability and monitoring domains of SOA-C02, SAA-C03, and DVA-C02.
What problem this solves
Kubernetes and ECS both slice a host into many isolated workloads, but base CloudWatch was built for the host. On an EC2 worker node it reports CPUUtilization, NetworkIn, and (with the CloudWatch agent) memory and disk — for the whole instance. That number is a blend of every pod or task on the box. When one pod misbehaves, the host average barely moves, so the signal you need is buried under the noise of everything else on the node. On Fargate it is worse: there is no instance you own at all, so without Container Insights you have essentially no resource metrics for the task.
What breaks without Container Insights is your ability to answer the questions that actually page you. Which pod is eating the node’s memory? Is this service’s p99 latency spike a CPU-throttle problem or a downstream one? Why did the deployment’s running-pod count drop from 6 to 4 at 02:14? Which container is CrashLooping and how often? Base metrics can’t answer any of them because they lack the dimensions — PodName, Namespace, Service, TaskDefinitionFamily, ContainerName. You end up SSH-ing to nodes, running docker stats or crictl, and eyeballing kubectl top, which needs the metrics-server and still isn’t stored, alarmed, or correlated with logs and traces.
Who hits this: every team past “hello world” on EKS or ECS. It bites hardest during incidents (no historical pod metrics means no forensic timeline), during right-sizing (you can’t set sane CPU/memory requests and limits without per-container utilization history), on Fargate (no host to fall back on), and in multi-tenant clusters (you need per-namespace and per-service breakdowns to bill and to blame). The fix is a telemetry agent per node (EKS) or a cluster flag (ECS) that aggregates by the dimensions that matter and lands the data somewhere queryable, dashboarded, and alarmable. Here is the whole “how do I turn it on” decision on one screen:
| Runtime | How you enable Container Insights | What you deploy | Metrics namespace | You manage the collector? |
|---|---|---|---|---|
| EKS (EC2 nodes) | Install a collector | CloudWatch Observability add-on or agent DaemonSet or ADOT | ContainerInsights |
✅ Yes (add-on manages it for you) |
| EKS (Fargate) | ADOT sidecar/collector | ADOT collector (no DaemonSet on Fargate) | ContainerInsights |
✅ Yes |
| ECS (EC2) | Cluster setting | Nothing — AWS collects it | ECS/ContainerInsights |
❌ No |
| ECS (Fargate) | Cluster setting | Nothing — AWS collects it | ECS/ContainerInsights |
❌ No |
| ECS/EKS logs | Fluent Bit / FireLens | Fluent Bit DaemonSet (EKS) or FireLens sidecar (ECS) | (logs, not metrics) | ✅ Yes |
Learning objectives
By the end of this article you can:
- Explain exactly what Container Insights collects — the metric families (CPU, memory, network, disk, restart/health counts) and the dimension levels (cluster, node, pod, container, service, namespace, task) — and how they arrive as EMF performance-log events that CloudWatch turns into metrics.
- Enable Container Insights on EKS three ways — the CloudWatch Observability add-on with IRSA, a manual CloudWatch agent DaemonSet, and an ADOT collector — and choose correctly between them.
- Enable Container Insights on ECS with the cluster setting (and the account-level default), and use enhanced observability on both runtimes.
- Ship container logs with Fluent Bit to the right
/aws/containerinsights/<cluster>/applicationlog group with least-privilege IAM. - Handle Fargate’s collection gaps on both EKS and ECS.
- Correlate metrics ↔ logs ↔ X-Ray traces with CloudWatch ServiceLens, and know when to take the Prometheus path to Amazon Managed Prometheus + Managed Grafana instead.
- Build a dashboard, set an alarm on pod restarts, and run a symptom → root cause → confirm → fix playbook for the whole failure field: no metrics, missing logs, add-on CrashLoop, Fargate gaps, empty dashboards, and runaway cost.
- Model and control the cost — per-metric charges, log ingestion and retention — so enhanced observability doesn’t quietly triple your CloudWatch bill.
Prerequisites & where this fits
You should be comfortable with the container basics on AWS: an EKS cluster has a managed control plane and worker nodes (EC2 managed node groups, or Fargate), and you drive it with kubectl; an ECS cluster runs tasks (defined by a task definition) grouped into services, on EC2 capacity or Fargate. Build the EKS cluster first in Amazon EKS: Standing Up a Cluster with eksctl, Node Groups & kubectl Access, and the ECS side in ECS Task Definitions, Services & Auto Scaling: The Complete Hands-On. On the AWS side you need IAM roles and, for the EKS agent, IRSA — covered in depth in EKS Pod IAM Permissions: IRSA and EKS Pod Identity Hands-On. You’ll want the aws, eksctl, and kubectl CLIs and a cluster you can afford (the EKS control plane is not free — see Cost & sizing).
This sits in the Observability track and is the container-specific layer on top of core CloudWatch. The foundational metrics/alarms/dashboards mechanics live in Amazon CloudWatch Hands-On: Metrics, Alarms, Dashboards & SNS Notifications; the distributed-tracing pillar you’ll correlate against is AWS X-Ray: Distributed Tracing for Serverless & Microservices, End to End. When the pods this monitors won’t schedule or keep crashing, the companion playbooks are EKS Pod Troubleshooting: Pending, CrashLoopBackOff, ImagePull & CNI IP Exhaustion and Why Your ECS Task Won’t Start: Stopped-Task Reasons, Health Checks & a Playbook. If you’re still choosing the runtime, start at Choosing Your AWS Container Path: ECS vs EKS vs Fargate.
Before the deep dive, fix where each piece lives so you debug in the right layer first:
| Layer | What lives here | Failures it causes | First place to look |
|---|---|---|---|
| Cluster setting / add-on | The on/off switch (ECS setting; EKS collector) | No metrics at all | describe-clusters (ECS); kubectl get pods -n amazon-cloudwatch (EKS) |
| Collector (agent/ADOT) | Reads kubelet/cAdvisor, builds EMF | Missing node/pod metrics | Agent DaemonSet logs |
| IAM (IRSA / task role) | Lets the collector call CloudWatch | Agent CrashLoop, AccessDenied |
The SA role / task role policy |
| Fluent Bit / FireLens | Ships container logs | Metrics present, logs missing | Fluent Bit pod logs; logs:PutLogEvents |
| CloudWatch Logs | /performance + /application groups |
Data present but costly | Log group retention |
| CloudWatch Metrics | ContainerInsights / ECS/ContainerInsights |
Dashboards/alarms empty | list-metrics --namespace … |
| Region | Everything is regional | “No data” in the console | The console region selector |
Core concepts
The mental model: an EMF pipeline, not a metrics API
The single most important thing to internalize is that Container Insights metrics are derived from logs. A collector on each node samples the kubelet / cAdvisor (EKS) or the ECS telemetry (ECS), rolls the samples up per dimension, and writes them as performance log events — JSON documents in Embedded Metric Format (EMF) — into a CloudWatch log group named /aws/containerinsights/<ClusterName>/performance. Each EMF event carries a _aws block that tells CloudWatch “extract these fields as metrics, in this namespace, with these dimensions.” CloudWatch reads that block on ingestion and materializes the metrics you later graph and alarm on. So there are always two artifacts: the raw performance-log event (a log, billed as log ingest + storage) and the extracted metric (billed as a custom metric). This duality explains almost every cost and “why is there data here but not there” question later.
| Artifact | Where it lives | Format | Billed as | Retention control |
|---|---|---|---|---|
| Performance log event | /aws/containerinsights/<cluster>/performance |
EMF JSON | Log ingest + storage | Log group retention |
| Extracted metric | ContainerInsights namespace |
CloudWatch metric | Custom metric ($/metric/mo) | 15-month metric retention (fixed) |
| Container logs | /aws/containerinsights/<cluster>/application |
Raw stdout/stderr | Log ingest + storage | Log group retention |
| Auto dashboard | CloudWatch → Insights → Container Insights | Built-in views | Free (dashboards up to 3 free) | n/a |
What gets collected, and at which level
Container Insights aggregates the same physical signals — CPU, memory, network, filesystem, and object counts (running pods, restarts) — at several dimension levels. The level is what makes a metric answerable: node_cpu_utilization per NodeName tells you which box is hot; pod_cpu_utilization per PodName tells you which pod. Here is the level map for EKS:
| Level (EKS) | Dimension set | Example metrics | Answers |
|---|---|---|---|
| Cluster | ClusterName |
cluster_node_count, cluster_failed_node_count |
Is the cluster healthy / right-sized? |
| Namespace | ClusterName, Namespace |
namespace_number_of_running_pods |
Per-team/tenant footprint |
| Service | ClusterName, Namespace, Service |
service_number_of_running_pods |
Is my Deployment at desired scale? |
| Node | ClusterName, NodeName |
node_cpu_utilization, node_memory_utilization, node_filesystem_utilization |
Which node is hot / full? |
| Pod | ClusterName, Namespace, PodName |
pod_cpu_utilization, pod_memory_utilization, pod_network_rx_bytes |
Which pod is the problem? |
| Container (enhanced) | …, ContainerName |
container_cpu_utilization, container_memory_utilization |
Which container in the pod? |
For ECS the levels are cluster, service, and task-family, with container-level added under enhanced:
| Level (ECS) | Dimension set | Example metrics | Answers |
|---|---|---|---|
| Cluster | ClusterName |
RunningTaskCount, PendingTaskCount, ServiceCount, ContainerInstanceCount |
Cluster-wide scale/health |
| Service | ClusterName, ServiceName |
CpuUtilized, MemoryUtilized, RunningTaskCount, DesiredTaskCount |
Is the service at desired count? |
| Task family | ClusterName, TaskDefinitionFamily |
CpuUtilized, MemoryUtilized, NetworkRxBytes |
Per-task-def resource use |
| Container (enhanced) | …, ContainerName |
container-level CPU/memory, restart/health | Which container in the task? |
The metric catalog by signal
Same five signals, named per level. The EKS names are prefixed (node_, pod_, cluster_, service_, namespace_, container_); ECS uses PascalCase (CpuUtilized, MemoryReserved). The two you will alarm on most are utilization and restarts.
| Signal | EKS metric(s) | ECS metric(s) | Unit | Typical use |
|---|---|---|---|---|
| CPU | node_cpu_utilization, pod_cpu_utilization, pod_cpu_utilization_over_pod_limit |
CpuUtilized, CpuReserved |
Percent / vCPU-units | Right-size requests/limits; throttle alarms |
| Memory | node_memory_utilization, pod_memory_utilization, pod_memory_utilization_over_pod_limit |
MemoryUtilized, MemoryReserved |
Percent / MiB | OOM prevention; limit tuning |
| Network | node_network_total_bytes, pod_network_rx_bytes, pod_network_tx_bytes |
NetworkRxBytes, NetworkTxBytes |
Bytes/s | Chatty-pod / egress detection |
| Filesystem / disk | node_filesystem_utilization, node_diskio_io_service_bytes_total |
StorageReadBytes, StorageWriteBytes, EphemeralStorageUtilized (Fargate) |
Percent / Bytes | Disk-full and IO alarms |
| Object counts | cluster_node_count, node_number_of_running_pods, service_number_of_running_pods |
RunningTaskCount, PendingTaskCount, DesiredTaskCount |
Count | Scale / capacity alarms |
| Restarts / health | pod_number_of_container_restarts, pod_status_* (enhanced) |
task/container health events (enhanced) | Count | CrashLoop / flapping alarms |
Performance-log event types
Inside /performance, every event has a Type field telling you which level it describes. Query these directly with Logs Insights when the pre-built dashboards don’t slice the way you need.
Type (EKS) |
Describes | Carries |
|---|---|---|
Cluster |
The whole cluster | node counts, failed nodes |
ClusterNamespace |
A namespace | running pods per namespace |
ClusterService |
A K8s service | running pods per service |
Node |
A worker node | node CPU/memory/fs utilization |
NodeNet / NodeDiskIO / NodeFS |
Node subsystems | per-node network / disk IO / filesystem |
Pod |
A pod | pod CPU/memory/network |
PodNet |
Pod networking | pod rx/tx bytes |
Container (enhanced) |
A container | container CPU/memory |
ContainerFS (enhanced) |
Container filesystem | container disk use |
The three log groups
| Log group | Populated by | Contents | Default retention |
|---|---|---|---|
/aws/containerinsights/<cluster>/performance |
CloudWatch agent / ADOT | EMF performance events (source of metrics) | Never expire (set this!) |
/aws/containerinsights/<cluster>/application |
Fluent Bit | Container stdout/stderr | Never expire (set this!) |
/aws/containerinsights/<cluster>/host |
Fluent Bit | Node system logs (/var/log/messages, secure) |
Never expire (set this!) |
/aws/containerinsights/<cluster>/dataplane |
Fluent Bit | kubelet, kube-proxy, containerd logs | Never expire (set this!) |
The “never expire” default is the single biggest cost trap in this whole feature — every one of these groups keeps data forever until you set a retention policy. Fix it on day one (covered in Cost & sizing).
Enabling Container Insights on EKS
On EKS you must run a collector that reads the kubelet/cAdvisor on every node and produces the EMF. You have three supported ways to do it. Pick one; do not run two agents scraping the same metrics or you’ll double your metric cost.
Path A — the CloudWatch Observability EKS add-on (recommended)
The amazon-cloudwatch-observability add-on is the modern, AWS-managed path. Installing it deploys, into the amazon-cloudwatch namespace: the CloudWatch agent as a DaemonSet (metrics + performance logs, with enhanced observability on by default), Fluent Bit as a DaemonSet (container/host/dataplane logs), and the plumbing for CloudWatch Application Signals (APM) if you opt in. It runs under a ServiceAccount named cloudwatch-agent that needs CloudWatchAgentServerPolicy, granted via IRSA or EKS Pod Identity. AWS patches the agent versions for you.
| Add-on aspect | Detail |
|---|---|
| Add-on name | amazon-cloudwatch-observability |
| Namespace | amazon-cloudwatch |
| ServiceAccount | cloudwatch-agent (and cloudwatch-agent for Fluent Bit) |
| Required IAM policy | CloudWatchAgentServerPolicy (metrics, EMF logs) |
| Optional IAM policy | AWSXrayWriteOnlyAccess (if collecting traces / Application Signals) |
| Auth mechanism | IRSA (OIDC) or EKS Pod Identity |
| Enhanced observability | On by default with the add-on |
| Deploys | CloudWatch agent DaemonSet + Fluent Bit DaemonSet |
| Manages upgrades | Yes (AWS-managed add-on lifecycle) |
The trade-off: it’s opinionated (it owns that namespace and the config) and enhanced-on-by-default means more metrics, which is more cost — good defaults, but know it before it hits the bill.
Path B — the manual CloudWatch agent DaemonSet
Before the add-on existed you applied a quick-start YAML that created the amazon-cloudwatch namespace, a ServiceAccount, RBAC, a ConfigMap, and the agent + Fluent Bit DaemonSets by hand. It still works and gives you full control of the agent config (which metrics, which log groups, enhanced or not), but you own upgrades, RBAC, and drift. Choose it when you need to customize the agent config beyond what the add-on exposes, or on clusters where you can’t use add-ons.
Path C — the ADOT (OpenTelemetry) collector
AWS Distro for OpenTelemetry (ADOT) is an OpenTelemetry Collector distribution. For Container Insights it scrapes the same kubelet/cAdvisor metrics and exports them to CloudWatch via the awsemf exporter (producing the same EMF). You choose ADOT when you’re already OpenTelemetry-native, when you want the same collector to also remote-write to Amazon Managed Prometheus, when you need it as a sidecar on EKS Fargate (where DaemonSets can’t run), or when you want to fan telemetry to multiple backends. It’s more moving parts than the add-on.
EKS collector comparison
| Dimension | Observability add-on | Manual agent DaemonSet | ADOT collector |
|---|---|---|---|
| Setup effort | Lowest (one add-on) | Medium (apply YAML) | Highest (configure OTel) |
| Who upgrades it | AWS | You | You |
| Enhanced observability | On by default | Configurable | Via config |
| Runs on EKS Fargate | No (DaemonSet) | No (DaemonSet) | ✅ Yes (sidecar/collector) |
| Also does logs | Yes (bundles Fluent Bit) | Yes (bundles Fluent Bit) | Metrics only (add Fluent Bit) |
| Also to AMP/Prometheus | No | No | ✅ Yes (prometheusremotewrite) |
| Also X-Ray / App Signals | ✅ Yes | Add manually | ✅ Yes |
| Best for | Most EKS clusters | Custom agent config | OTel shops, Fargate, AMP |
Standard vs enhanced observability (EKS)
Enhanced observability is the richer tier. On EKS it adds container-level metrics, detailed pod and node health/status (pod_status_ready, node conditions), more granular resource breakdowns, and curated cross-drill dashboards that let you go cluster → node → pod → container in a click. It’s on by default with the add-on. Standard (the older DaemonSet default) gives you the cluster/node/pod aggregates without the per-container and health detail.
| Aspect | Standard | Enhanced |
|---|---|---|
| Container-level metrics | ❌ | ✅ |
| Pod/node health & status | Limited | ✅ Detailed (pod_status_*, node conditions) |
| Control-plane / API server view | ❌ | ✅ (with EKS control-plane metrics) |
| Curated drill-down dashboards | Basic | ✅ Rich (cluster→node→pod→container) |
| Number of metrics emitted | Lower | Higher (more $) |
| Default with the add-on | — | ✅ On |
| Turn it off to save cost | n/a | Set the agent config to standard |
Enabling Container Insights on ECS
ECS is dramatically simpler because AWS runs the collection for you. Container Insights is a cluster setting (containerInsights) that you set to enabled, enhanced, or disabled. There is no agent to deploy for the aggregated metrics — the ECS control plane and the ECS agent already have the data and ship it to the ECS/ContainerInsights namespace. (Logs are separate — you still choose awslogs or FireLens/Fluent Bit per task; see the next section.)
containerInsights value |
Behavior | Metrics you get | Cost |
|---|---|---|---|
disabled |
Off (legacy default for old clusters) | Only base ECS service metrics (free) | None |
enabled |
Standard Container Insights | Cluster/service/task CPU, memory, network, storage, counts | Custom-metric charges |
enhanced |
Enhanced observability | Adds container-level metrics, instance metrics, and health events | Higher (more metrics) |
You can set it per cluster or make it the account-wide default so every new cluster inherits it:
| Scope | Command | Effect |
|---|---|---|
| Per existing cluster | aws ecs update-cluster-settings --cluster X --settings name=containerInsights,value=enhanced |
Turns it on for cluster X now |
| At cluster creation | aws ecs create-cluster --cluster-name X --settings name=containerInsights,value=enhanced |
New cluster starts with it on |
| Account default | aws ecs put-account-setting --name containerInsights --value enhanced |
New clusters default to enhanced |
| Check the default | aws ecs list-account-settings --name containerInsights |
Shows the account default |
Fargate specifics on both runtimes
Fargate removes the host you own, which changes what’s collectable. Get this table right or you’ll chase “missing node metrics” that can never exist on Fargate.
| Concern | ECS on Fargate | EKS on Fargate |
|---|---|---|
| How to enable | Cluster setting (same as EC2) | ADOT collector (no DaemonSet on Fargate) |
| Node-level metrics | N/A (no node you own) | N/A (no node you own) |
| Task/pod metrics | ✅ Via cluster setting | ✅ Via ADOT |
| Ephemeral storage metric | ✅ EphemeralStorageUtilized |
Via ADOT config |
| Container logs | awslogs or FireLens sidecar |
Fargate built-in log router (aws-observability ConfigMap) |
| Collector placement | AWS-managed | ADOT as sidecar / per-pod |
| Gotcha | No ContainerInstance metrics (no instances) |
Can’t run the agent DaemonSet — must use ADOT |
Shipping container logs with Fluent Bit
Container Insights metrics and container logs are two separate pipelines. The agent/add-on/ADOT handles metrics + performance logs; your application’s stdout/stderr is shipped by a log router. On EKS that’s Fluent Bit (the add-on bundles it; the AWS image is aws-for-fluent-bit), running as a DaemonSet that tails /var/log/containers/*.log and outputs to CloudWatch Logs. On ECS you use FireLens (a Fluent Bit/Fluentd sidecar) or the simpler awslogs driver per container.
Fluent Bit output config (EKS)
The Fluent Bit [OUTPUT] for CloudWatch uses the native cloudwatch_logs plugin (faster than the older Lua-based cloudwatch). Key parameters:
| Parameter | Purpose | Example |
|---|---|---|
Name |
Output plugin | cloudwatch_logs |
region |
Target region | ap-south-1 |
log_group_name |
Destination group | /aws/containerinsights/demo/application |
log_group_template |
Dynamic group from record | /aws/eks/$kubernetes['namespace_name'] |
log_stream_prefix |
Stream naming | ${HOST_NAME}- |
auto_create_group |
Create the group if absent | true |
log_retention_days |
Set retention on create | 7 |
log_key |
Send only the log field | log |
Fluent Bit / FireLens IAM
The log router’s identity (the EKS SA role via IRSA, or the ECS task role for FireLens) needs CloudWatch Logs write permissions. Least-privilege set:
| Action | Why | Scope suggestion |
|---|---|---|
logs:CreateLogGroup |
If auto_create_group=true |
arn:aws:logs:*:ACCT:log-group:/aws/containerinsights/* |
logs:CreateLogStream |
Per-pod/task stream | Same |
logs:PutLogEvents |
The actual log write | Same |
logs:PutRetentionPolicy |
If setting retention on create | Same |
logs:DescribeLogStreams |
Sequence-token lookups | Same |
Miss PutLogEvents and you’ll see metrics arrive but the /application group stay empty — the classic “logs missing, metrics present” split (troubleshooting row below).
ECS logging options compared
| Option | How | When to use | Cost note |
|---|---|---|---|
awslogs driver |
logConfiguration in task def |
Simple, one group per container | Cheapest, least flexible |
| FireLens (Fluent Bit) | Sidecar firelens container |
Parsing, routing, multiple destinations | Sidecar CPU/mem + logs |
| FireLens (Fluentd) | Sidecar with Fluentd image | Legacy / complex filters | Heavier than Fluent Bit |
Correlating metrics, logs, and traces
Metrics tell you something is wrong; logs tell you what; traces tell you where in the call graph. Container Insights gives you the first two in the same console; X-Ray (and its newer front-end, CloudWatch ServiceLens / Application Signals) gives you the third and stitches all three together. The CloudWatch agent and ADOT can also collect X-Ray traces, so one collector feeds all three pillars.
| Pillar | Source | Container Insights role | Correlate via |
|---|---|---|---|
| Metrics | Agent/ADOT → EMF | pod/task CPU, memory, restarts | ServiceLens map, dashboards |
| Logs | Fluent Bit → /application |
container stdout/stderr | Logs Insights, jump from metric graph |
| Traces | X-Ray SDK / ADOT | request path, latency, faults | ServiceLens, trace map |
| APM (Signals) | Application Signals | auto SLOs, latency/error/throughput | Service map ties metric↔log↔trace |
The practical workflow: an alarm fires on pod_number_of_container_restarts; you click into the Container Insights map, drill cluster → namespace → pod, jump from the pod’s metric to its /application logs (pre-filtered to that pod via the log stream), and — if the app is X-Ray-instrumented — open the trace map to see the failing downstream dependency. Read the tracing half in AWS X-Ray: Distributed Tracing for Serverless & Microservices, End to End.
The Prometheus path: AMP + Managed Grafana
Container Insights is the AWS-native path; the CNCF-native path is Prometheus + Grafana, and AWS offers managed versions of both: Amazon Managed Service for Prometheus (AMP) and Amazon Managed Grafana (AMG). You scrape Prometheus metrics (from your apps’ /metrics endpoints and kube-state-metrics) with an ADOT collector or the CloudWatch agent’s Prometheus mode, remoteWrite them to AMP, and visualize with PromQL in AMG. Choose this when Prometheus is already your standard.
| Factor | Container Insights (CloudWatch) | AMP + AMG (Prometheus) |
|---|---|---|
| Query language | CloudWatch Metric Math / Logs Insights | PromQL |
| Custom app metrics (high cardinality) | Costly as custom metrics | ✅ Built for it |
| Dashboards | Auto-built + CloudWatch dashboards | Grafana (huge community library) |
| Setup effort | Lowest (add-on / setting) | Higher (scrape config, AMP, AMG, IAM) |
| Alarms | CloudWatch alarms → SNS | AMP recording/alerting rules → Alertmanager |
| Multi-cluster / federation | Per-account CloudWatch | ✅ Central AMP workspace |
| Existing Prometheus/Grafana skills | Reuse limited | ✅ Reuse fully |
| Cost model | Per-metric + logs | Per metric sample ingested + storage + AMG/user |
| Best for | AWS-native teams, fastest time-to-value | Kubernetes/Prometheus-native, high-cardinality |
Many shops run both: Container Insights for the infrastructure aggregates, alarms, and AWS-native correlation; AMP/AMG for high-cardinality application metrics and PromQL dashboards — fed by the same ADOT collector.
Architecture at a glance
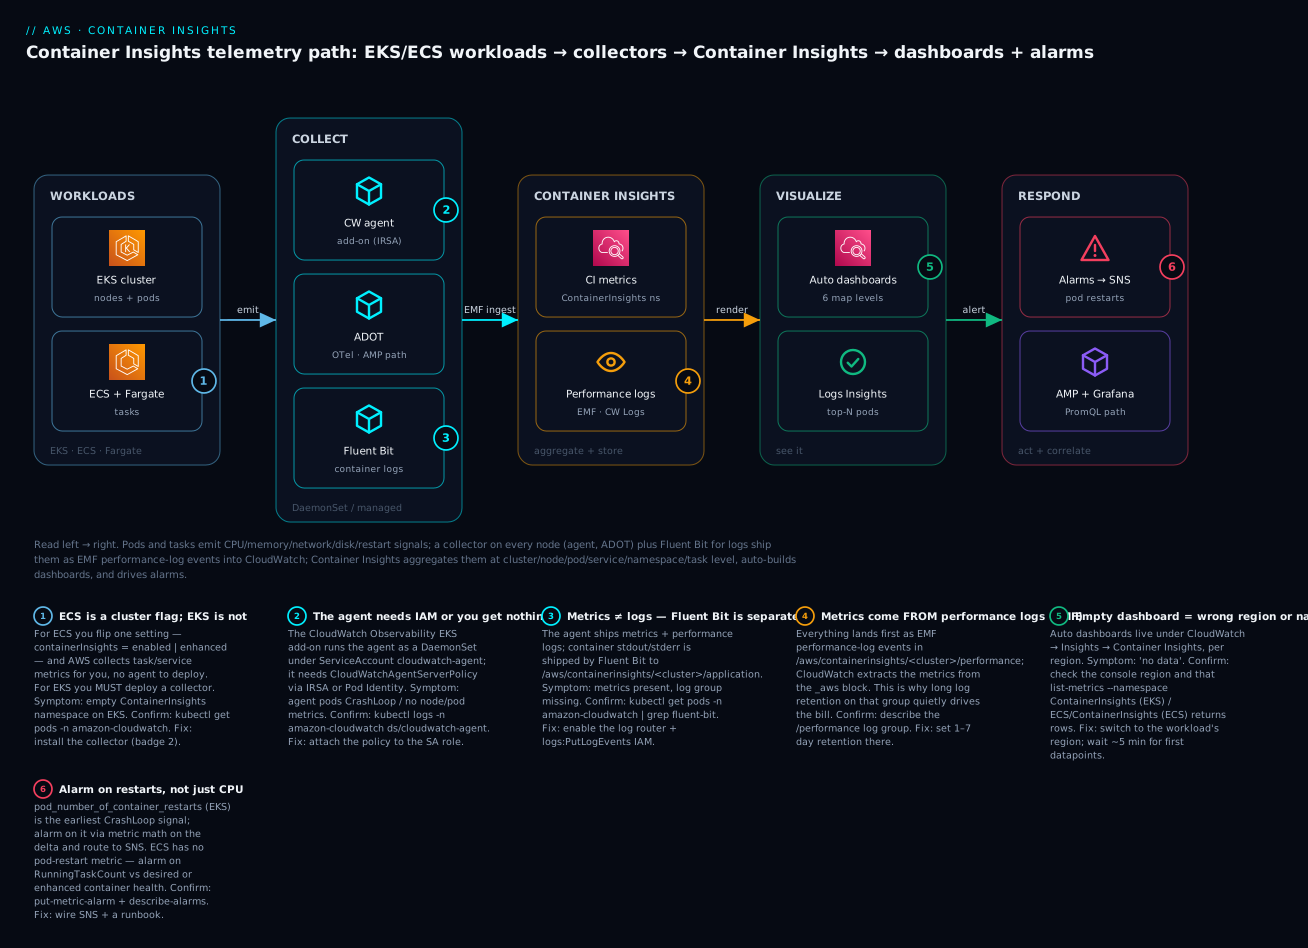
The diagram traces the real telemetry path and pins each failure class to the hop where it bites. Read it left to right. In WORKLOADS, an EKS cluster’s nodes and pods and an ECS/Fargate cluster’s tasks emit CPU/memory/network/disk/restart signals — but note badge 1: ECS is a one-flag switch (AWS collects for you) while EKS requires you to deploy a collector. In COLLECT, on EKS the CloudWatch agent (via the Observability add-on under an IRSA’d cloudwatch-agent ServiceAccount) or an ADOT collector produces the metrics, and Fluent Bit — a separate pipeline (badge 3) — ships container logs. Everything ingests into CONTAINER INSIGHTS as EMF performance-log events in /aws/containerinsights/<cluster>/performance, from which CloudWatch extracts the ContainerInsights (EKS) / ECS/ContainerInsights (ECS) metrics (badge 4 — this log-first design is why retention drives cost). In VISUALIZE the auto dashboards drill cluster → node → pod → container and Logs Insights queries the top-N pods (badge 5 — empty usually means wrong region/namespace). In RESPOND, an alarm on pod_number_of_container_restarts routes to SNS (badge 6), and the optional AMP + Grafana branch serves the PromQL crowd. Each numbered badge marks a failure class; the legend narrates symptom · confirm · fix.
Real-world scenario
Solvent Health, a fictional but representative telehealth company, ran a 25-node EKS cluster (ap-south-1) hosting ~180 pods across appointments, video, billing, and a patient-records API, plus an ECS Fargate cluster for batch claims processing. Their observability was “node CloudWatch plus kubectl top when something breaks.” One Monday the appointments API started returning intermittent 5xx during the 9am rush. The ALB target group showed unhealthy hosts flapping; node CPU and memory looked fine (peaks around 60%). They spent four hours SSH-ing to nodes running crictl stats, because they had no per-pod history and no way to see which of the six appointment pods was the culprit or when it started.
The post-incident action was to turn on Container Insights properly. They installed the amazon-cloudwatch-observability add-on with IRSA (a cloudwatch-agent SA role with CloudWatchAgentServerPolicy), which brought enhanced observability and Fluent Bit in one shot, and enabled the cluster setting to enhanced on the ECS claims cluster. Within ten minutes the picture was obvious in the auto dashboard: one appointments pod, scheduled on a node co-located with the memory-hungry video transcoder, was hitting its 512 MiB memory limit and being OOM-killed — pod_memory_utilization_over_pod_limit pegged at 100%, pod_number_of_container_restarts climbing by ~40 per hour. The node average had hidden it completely.
The fixes were surgical because now they had the data. They raised the appointments pod’s memory request/limit to 768/1024 MiB (justified from the p95 utilization graph, not a guess), added a pod anti-affinity so appointments and the transcoder didn’t share a node, and set two alarms: one on pod_memory_utilization_over_pod_limit > 90% for 5 minutes, and one on the delta of pod_number_of_container_restarts (metric math: RATE(m1) > 0) routed to an SNS topic and Slack. On the ECS side, enhanced observability’s container-level metrics revealed a claims worker leaking file handles that manifested as slowly climbing EphemeralStorageUtilized — caught before it filled the task’s storage. The one thing they got wrong at first: they left the four /aws/containerinsights/* log groups at the default never-expire retention, and a month later a FinOps review flagged a ₹34,000/month CloudWatch Logs storage line. They set 7-day retention on /application and 3-day on /performance, dropped it by ~80%, and moved a set of high-cardinality per-endpoint app metrics off custom metrics into AMP queried by Managed Grafana — keeping Container Insights for the infra aggregates and alarms.
Advantages and disadvantages
| Advantages | Disadvantages |
|---|---|
| Per-pod / per-task / per-container metrics base CloudWatch can’t give you | Cost scales with metric count — enhanced can surprise you |
| ECS: one cluster flag, zero agents to run | EKS: you must deploy and (unless add-on) maintain a collector |
| Auto-built drill-down dashboards (cluster→node→pod→container) | Log groups default to never-expire (silent cost trap) |
| Metrics + logs + (via X-Ray) traces correlated in one console | High-cardinality custom app metrics get expensive vs Prometheus |
| Native CloudWatch alarms → SNS → auto-remediation | Fargate needs ADOT on EKS (extra moving parts) |
| Fully managed with the add-on (AWS patches the agent) | Less flexible than raw Prometheus/PromQL for custom queries |
| Works on EC2 and Fargate for both runtimes | Metric latency ~1 min; not for sub-second needs |
Container Insights wins when you want fast, AWS-native, correlated container observability with minimal operational burden — especially on ECS, where it’s nearly free effort. It’s the wrong sole choice when your team lives in PromQL, needs very high-cardinality app metrics cheaply, or wants portable open-source dashboards — there, pair it with (or replace parts with) AMP + AMG.
Hands-on lab
You’ll enable Container Insights on an EKS cluster (Observability add-on + IRSA) and an ECS cluster (cluster setting), deploy workloads, view pod/task CPU + memory, ship logs via Fluent Bit, build a dashboard, and alarm on pod restarts. Then you tear it all down. ⚠️ This lab costs money: the EKS control plane (~$0.10/hr), any EC2/Fargate capacity, CloudWatch custom metrics, and log ingest/storage. Do it in one sitting and run the teardown.
Step 0 — Prerequisites
| Tool | Version | Check |
|---|---|---|
aws CLI |
v2 | aws --version |
eksctl |
≥ 0.180 | eksctl version |
kubectl |
matches cluster | kubectl version --client |
| An EKS cluster | 1.28+ | aws eks list-clusters |
| An ECS cluster | any | aws ecs list-clusters |
export AWS_REGION=ap-south-1
export CLUSTER=kloudvin-ci-demo          # existing EKS cluster
export ECS_CLUSTER=kloudvin-ci-ecs       # existing ECS cluster
export ACCOUNT_ID=$(aws sts get-caller-identity --query Account --output text)
Step 1 — Ensure the OIDC provider (for IRSA)
The add-on’s agent authenticates via IRSA, which needs the cluster’s OIDC provider registered in IAM.
eksctl utils associate-iam-oidc-provider \
  --cluster "$CLUSTER" --region "$AWS_REGION" --approve
Expected: IAM Open ID Connect provider is associated with cluster (or “already exists”).
Step 2 — Create the IAM role for the add-on’s ServiceAccount
Give the cloudwatch-agent SA (namespace amazon-cloudwatch) CloudWatchAgentServerPolicy via IRSA. eksctl wires the trust policy for you.
eksctl create iamserviceaccount \
  --name cloudwatch-agent \
  --namespace amazon-cloudwatch \
  --cluster "$CLUSTER" --region "$AWS_REGION" \
  --role-name "${CLUSTER}-cw-agent-role" \
  --attach-policy-arn arn:aws:iam::aws:policy/CloudWatchAgentServerPolicy \
  --role-only --approve
The --role-only flag creates the role without creating the SA — the add-on creates the SA and we’ll point it at this role. Grab the ARN:
export CW_ROLE_ARN=$(aws iam get-role --role-name "${CLUSTER}-cw-agent-role" \
  --query 'Role.Arn' --output text)
echo "$CW_ROLE_ARN"
Step 3 — Install the CloudWatch Observability add-on
aws eks create-addon \
  --cluster-name "$CLUSTER" \
  --addon-name amazon-cloudwatch-observability \
  --service-account-role-arn "$CW_ROLE_ARN" \
  --region "$AWS_REGION"
Wait until it’s active:
aws eks wait addon-active \
  --cluster-name "$CLUSTER" \
  --addon-name amazon-cloudwatch-observability \
  --region "$AWS_REGION"
Verify the DaemonSets are running (agent + Fluent Bit, one pod per node):
kubectl get pods -n amazon-cloudwatch
Expected (on a 2-node cluster):
NAME                                      READY   STATUS    RESTARTS   AGE
amazon-cloudwatch-observability-...       1/1     Running   0          2m
cloudwatch-agent-4x7k2                    1/1     Running   0          2m
cloudwatch-agent-9dl8p                    1/1     Running   0          2m
fluent-bit-2c9xq                          1/1     Running   0          2m
fluent-bit-mn4rs                          1/1     Running   0          2m
Step 4 — Deploy a sample workload
kubectl create namespace demo
kubectl create deployment web --image=nginx:1.27 --replicas=3 -n demo
kubectl -n demo set resources deployment web \
  --requests=cpu=100m,memory=128Mi --limits=cpu=200m,memory=256Mi
kubectl get pods -n demo -w   # Ctrl-C once all 3 are Running
Step 5 — Confirm metrics are flowing
Give it ~5 minutes for the first datapoints, then list the metrics:
aws cloudwatch list-metrics \
  --namespace ContainerInsights \
  --dimensions Name=ClusterName,Value="$CLUSTER" \
  --region "$AWS_REGION" --query 'Metrics[].MetricName' --output text | tr '\t' '\n' | sort -u
Expected (excerpt): cluster_node_count, node_cpu_utilization, node_memory_utilization, pod_cpu_utilization, pod_memory_utilization, pod_number_of_container_restarts.
Pull one pod’s CPU utilization for the last 15 minutes:
POD=$(kubectl get pods -n demo -o jsonpath='{.items[0].metadata.name}')
aws cloudwatch get-metric-statistics \
  --namespace ContainerInsights --metric-name pod_cpu_utilization \
  --dimensions Name=ClusterName,Value="$CLUSTER" Name=Namespace,Value=demo Name=PodName,Value="$POD" \
  --start-time "$(date -u -v-15M +%Y-%m-%dT%H:%M:%SZ 2>/dev/null || date -u -d '15 min ago' +%Y-%m-%dT%H:%M:%SZ)" \
  --end-time "$(date -u +%Y-%m-%dT%H:%M:%SZ)" \
  --period 60 --statistics Average --region "$AWS_REGION"
Step 6 — Confirm logs are flowing (Fluent Bit)
aws logs describe-log-groups \
  --log-group-name-prefix "/aws/containerinsights/$CLUSTER" \
  --region "$AWS_REGION" --query 'logGroups[].logGroupName'
Expected: /aws/containerinsights/<cluster>/performance, /application, /host, /dataplane. Tail the application logs:
aws logs tail "/aws/containerinsights/$CLUSTER/application" --since 5m --region "$AWS_REGION"
Step 7 — Set log retention immediately (cost control)
for suffix in performance application host dataplane; do
  aws logs put-retention-policy \
    --log-group-name "/aws/containerinsights/$CLUSTER/$suffix" \
    --retention-in-days 7 --region "$AWS_REGION"
done
Step 8 — Enable Container Insights on the ECS cluster
aws ecs update-cluster-settings \
  --cluster "$ECS_CLUSTER" \
  --settings name=containerInsights,value=enhanced \
  --region "$AWS_REGION"
Verify:
aws ecs describe-clusters --clusters "$ECS_CLUSTER" \
  --include SETTINGS --region "$AWS_REGION" \
  --query 'clusters[0].settings'
Expected: [{"name": "containerInsights", "value": "enhanced"}]. After you run a task/service for a few minutes, its metrics appear:
aws cloudwatch list-metrics --namespace ECS/ContainerInsights \
  --dimensions Name=ClusterName,Value="$ECS_CLUSTER" \
  --region "$AWS_REGION" --query 'Metrics[].MetricName' --output text | tr '\t' '\n' | sort -u
Step 9 — Build a dashboard
cat > /tmp/ci-dash.json <<JSON
{
  "widgets": [
    { "type": "metric", "x": 0, "y": 0, "width": 12, "height": 6,
      "properties": {
        "title": "Pod CPU utilization (demo ns)",
        "region": "${AWS_REGION}",
        "metrics": [[ "ContainerInsights", "pod_cpu_utilization", "ClusterName", "${CLUSTER}", "Namespace", "demo" ]],
        "stat": "Average", "period": 60 } },
    { "type": "metric", "x": 12, "y": 0, "width": 12, "height": 6,
      "properties": {
        "title": "Pod container restarts (demo ns)",
        "region": "${AWS_REGION}",
        "metrics": [[ "ContainerInsights", "pod_number_of_container_restarts", "ClusterName", "${CLUSTER}", "Namespace", "demo" ]],
        "stat": "Maximum", "period": 60 } }
  ]
}
JSON

aws cloudwatch put-dashboard \
  --dashboard-name "ContainerInsights-${CLUSTER}" \
  --dashboard-body file:///tmp/ci-dash.json --region "$AWS_REGION"
Step 10 — Alarm on pod restarts
pod_number_of_container_restarts is a cumulative count, so alarm on its increase with metric math (RATE), and route to SNS.
# 10a. SNS topic + email subscription
export TOPIC_ARN=$(aws sns create-topic --name ci-pod-restart-alerts \
  --region "$AWS_REGION" --query 'TopicArn' --output text)
aws sns subscribe --topic-arn "$TOPIC_ARN" --protocol email \
  --notification-endpoint you@example.com --region "$AWS_REGION"   # confirm the email

# 10b. Alarm: restarts increasing over 5 minutes
aws cloudwatch put-metric-alarm \
  --alarm-name "ci-${CLUSTER}-pod-restarts" \
  --alarm-description "A container in the demo namespace is restarting" \
  --namespace ContainerInsights --metric-name pod_number_of_container_restarts \
  --dimensions Name=ClusterName,Value="$CLUSTER" Name=Namespace,Value=demo \
  --statistic Maximum --period 300 --evaluation-periods 1 \
  --threshold 1 --comparison-operator GreaterThanOrEqualToThreshold \
  --treat-missing-data notBreaching \
  --alarm-actions "$TOPIC_ARN" --region "$AWS_REGION"
Force a restart to test it (kill nginx’s master process inside a pod):
kubectl -n demo exec "$POD" -- kill 1
# watch the restart count climb, then the alarm go ALARM within ~5-10 min
aws cloudwatch describe-alarms --alarm-names "ci-${CLUSTER}-pod-restarts" \
  --region "$AWS_REGION" --query 'MetricAlarms[0].StateValue'
Step 11 — The Terraform equivalent
For real environments, don’t click any of this. Here is the whole EKS + ECS setup as Terraform:
# --- EKS: IRSA role for the CloudWatch agent ---
data "aws_iam_policy_document" "cw_agent_assume" {
  statement {
    actions = ["sts:AssumeRoleWithWebIdentity"]
    effect  = "Allow"
    principals {
      type        = "Federated"
      identifiers = [aws_iam_openid_connect_provider.eks.arn]
    }
    condition {
      test     = "StringEquals"
      variable = "${replace(aws_iam_openid_connect_provider.eks.url, "https://", "")}:sub"
      values   = ["system:serviceaccount:amazon-cloudwatch:cloudwatch-agent"]
    }
  }
}

resource "aws_iam_role" "cw_agent" {
  name               = "${var.cluster_name}-cw-agent-role"
  assume_role_policy = data.aws_iam_policy_document.cw_agent_assume.json
}

resource "aws_iam_role_policy_attachment" "cw_agent" {
  role       = aws_iam_role.cw_agent.name
  policy_arn = "arn:aws:iam::aws:policy/CloudWatchAgentServerPolicy"
}

# --- EKS: the Container Insights add-on ---
resource "aws_eks_addon" "cw_observability" {
  cluster_name             = var.cluster_name
  addon_name               = "amazon-cloudwatch-observability"
  service_account_role_arn = aws_iam_role.cw_agent.arn
  resolve_conflicts_on_create = "OVERWRITE"
}

# --- ECS: cluster with enhanced Container Insights ---
resource "aws_ecs_cluster" "claims" {
  name = "kloudvin-ci-ecs"
  setting {
    name  = "containerInsights"
    value = "enhanced"
  }
}

# --- Log retention (the cost trap) ---
resource "aws_cloudwatch_log_group" "ci" {
  for_each          = toset(["performance", "application", "host", "dataplane"])
  name              = "/aws/containerinsights/${var.cluster_name}/${each.key}"
  retention_in_days = each.key == "application" ? 7 : 3
}

# --- Alarm on pod restarts → SNS ---
resource "aws_sns_topic" "ci_alerts" { name = "ci-pod-restart-alerts" }

resource "aws_cloudwatch_metric_alarm" "pod_restarts" {
  alarm_name          = "ci-${var.cluster_name}-pod-restarts"
  namespace           = "ContainerInsights"
  metric_name         = "pod_number_of_container_restarts"
  dimensions          = { ClusterName = var.cluster_name, Namespace = "demo" }
  statistic           = "Maximum"
  period              = 300
  evaluation_periods  = 1
  threshold           = 1
  comparison_operator = "GreaterThanOrEqualToThreshold"
  treat_missing_data  = "notBreaching"
  alarm_actions       = [aws_sns_topic.ci_alerts.arn]
}
Step 12 — Teardown
⚠️ Do this to stop charges. Order matters (remove the add-on before the role).
# EKS
aws cloudwatch delete-alarms --alarm-names "ci-${CLUSTER}-pod-restarts" --region "$AWS_REGION"
aws cloudwatch delete-dashboards --dashboard-names "ContainerInsights-${CLUSTER}" --region "$AWS_REGION"
aws sns delete-topic --topic-arn "$TOPIC_ARN" --region "$AWS_REGION"
kubectl delete namespace demo
aws eks delete-addon --cluster-name "$CLUSTER" \
  --addon-name amazon-cloudwatch-observability --region "$AWS_REGION"
aws iam detach-role-policy --role-name "${CLUSTER}-cw-agent-role" \
  --policy-arn arn:aws:iam::aws:policy/CloudWatchAgentServerPolicy
aws iam delete-role --role-name "${CLUSTER}-cw-agent-role"
for suffix in performance application host dataplane; do
  aws logs delete-log-group --log-group-name "/aws/containerinsights/$CLUSTER/$suffix" --region "$AWS_REGION" 2>/dev/null
done

# ECS (turn Container Insights back off)
aws ecs update-cluster-settings --cluster "$ECS_CLUSTER" \
  --settings name=containerInsights,value=disabled --region "$AWS_REGION"
Common mistakes & troubleshooting
The playbook. Each row is symptom → root cause → how to confirm (exact command) → fix. This is the section to bookmark.
| # | Symptom | Root cause | Confirm (command / console) | Fix |
|---|---|---|---|---|
| 1 | No metrics at all (EKS), empty ContainerInsights namespace |
No collector deployed — you assumed EKS is like ECS | kubectl get pods -n amazon-cloudwatch → no pods |
Install the add-on (Path A) or agent DaemonSet |
| 2 | No metrics (ECS) | Cluster setting still disabled |
aws ecs describe-clusters --include SETTINGS |
update-cluster-settings … value=enhanced |
| 3 | Agent pods CrashLoopBackOff | Missing/mis-scoped IAM (no CloudWatchAgentServerPolicy, or IRSA sub mismatch) |
kubectl logs -n amazon-cloudwatch ds/cloudwatch-agent → AccessDenied |
Attach CloudWatchAgentServerPolicy; fix SA role-arn / trust sub = system:serviceaccount:amazon-cloudwatch:cloudwatch-agent |
| 4 | Agent pods Pending |
Node resources exhausted or taints | kubectl describe pod -n amazon-cloudwatch <pod> |
Scale nodes / add tolerations |
| 5 | Metrics present, logs missing (/application empty) |
Fluent Bit not running or lacks logs:PutLogEvents |
`kubectl get pods -n amazon-cloudwatch | grep fluent-bit`; check its logs |
| 6 | Dashboard shows “No data” | Wrong region, or wrong namespace/cluster filter | Check console region; list-metrics --namespace ContainerInsights |
Switch to the workload’s region; wait ~5 min for first datapoints |
| 7 | No pod-level metrics, only node | Enhanced/pod metrics disabled, or old standard agent config | list-metrics … --dimensions PodName returns nothing |
Use the add-on (enhanced on) or set agent config to include pod metrics |
| 8 | No node metrics on Fargate | Expected — no host on Fargate | Confirm nodes are Fargate: kubectl get nodes -o wide |
Use ADOT for task/pod metrics; don’t expect node metrics |
| 9 | EKS Fargate: no metrics | Deployed a DaemonSet agent (can’t run on Fargate) | Agent pods never schedule on Fargate | Deploy ADOT as a sidecar/collector instead |
| 10 | CloudWatch bill spiked | Enhanced observability × many pods = many custom metrics; log groups never expire | Cost Explorer → CloudWatch by usage type; describe-log-groups shows no retention |
Set log retention; drop to standard; move high-cardinality to AMP |
| 11 | pod_number_of_container_restarts alarm never fires |
It’s cumulative — a static threshold on a rising counter mis-triggers or never triggers | describe-alarms shows INSUFFICIENT_DATA/stuck |
Use metric-math RATE() or alarm on Maximum over a rolling window; set treat-missing-data notBreaching |
| 12 | ADOT vs agent confusion — double metrics / double cost | Running both the agent and ADOT scraping the same metrics | Two collectors in list-metrics sources |
Run one collector; ADOT or agent, not both |
| 13 | Add-on stuck DEGRADED/CREATE_FAILED |
Version incompatible with cluster, or SA role missing | aws eks describe-addon … --query 'addon.health' |
Pick a compatible add-on version; pass --service-account-role-arn |
| 14 | InvalidClientTokenId / expired creds in agent |
IRSA token not projected / node IMDS blocked without SA role | `kubectl exec … – env | grep AWS_ROLE_ARN` empty |
| 15 | Metrics delayed / gaps | Normal ~1-min aggregation, or throttled PutLogEvents |
Agent logs show ThrottlingException |
Expected latency; if throttled, reduce metric volume or request a limit increase |
| 16 | ECS enhanced: no container metrics | Set to enabled (standard), not enhanced |
describe-clusters shows value: enabled |
Set value=enhanced |
Error / status reference
| Error string / state | Where | Likely cause | Fix |
|---|---|---|---|
AccessDeniedException … cloudwatch:PutMetricData |
Agent logs | SA role missing CloudWatchAgentServerPolicy |
Attach the policy |
AccessDeniedException … logs:PutLogEvents |
Agent/Fluent Bit logs | No logs write permission | Add logs actions to the SA/task role |
AccessDeniedException … logs:CreateLogGroup |
Fluent Bit logs | auto_create_group=true but no create perm |
Add logs:CreateLogGroup or pre-create the group |
WebIdentityErr / no OIDC provider |
Agent logs | OIDC provider not associated | eksctl utils associate-iam-oidc-provider |
ThrottlingException (PutLogEvents) |
Agent logs | Too many log events/s | Reduce volume; request quota increase |
Addon health.issues: AccessDenied |
describe-addon |
Add-on SA role not passed/mis-trusted | Re-create add-on with --service-account-role-arn |
Alarm INSUFFICIENT_DATA |
CloudWatch | No datapoints (wrong dims / missing data) | Fix dimensions; treat-missing-data notBreaching |
ResourceInUseException on add-on delete |
delete-addon |
Namespace resources still referenced | Retry; delete workloads in amazon-cloudwatch first |
The three nastiest failures, in prose
The agent CrashLoop that’s really an IAM trust bug. The most common real failure is the cloudwatch-agent pods CrashLooping with AccessDenied even though you attached CloudWatchAgentServerPolicy. The policy is fine; the trust is wrong. IRSA only works if the role’s trust policy sub condition exactly equals system:serviceaccount:amazon-cloudwatch:cloudwatch-agent and the aud is sts.amazonaws.com, and the OIDC provider is associated. A one-character namespace typo (amazon-cloudwatch vs amazoncloudwatch) or pointing the trust at the wrong SA silently produces AccessDenied. Confirm with kubectl exec -n amazon-cloudwatch <agent-pod> -- env | grep AWS_ROLE_ARN — if it’s empty, the webhook never injected the role because the SA isn’t annotated/mapped; if it’s set but you still get denied, the trust sub is wrong. This is exactly the IRSA machinery covered in the IRSA article.
The bill that “came out of nowhere.” Enhanced observability emits a lot of metrics — per container, per pod, per node, plus health/status series. On a 200-pod cluster that’s thousands of custom metrics, each billed monthly, and the four /aws/containerinsights/* log groups ingest and store performance + application + host + dataplane logs at never-expire retention by default. Teams see a CloudWatch line 3–5× what they expected. The fix is three levers: set log retention on all four groups (day one), decide whether you truly need enhanced on non-prod (drop to standard or off), and move high-cardinality application metrics to AMP where sample-based pricing is far cheaper than per-metric.
The restart alarm that never fires — or fires forever. pod_number_of_container_restarts is a cumulative counter, not a rate. A naïve alarm “> 5” either never fires on a fresh pod or fires permanently once any pod has ever restarted 5 times, because the counter only goes up (until the pod is replaced and it resets). You want to alarm on the increase. Either use CloudWatch metric math with RATE(m1) and alarm when the rate exceeds 0 over your window, or alarm on Maximum with a short evaluation window and treat-missing-data notBreaching so a quiet pod doesn’t hold the alarm open. Test it by kill 1-ing PID 1 inside a container and watching the count climb.
Best practices
| # | Practice | Why |
|---|---|---|
| 1 | Use the Observability add-on on EKS unless you need custom agent config | AWS maintains it; enhanced + Fluent Bit in one install |
| 2 | Set the account-level containerInsights default for ECS |
Every new cluster is observable from birth |
| 3 | Set log retention on all four /aws/containerinsights/* groups day one |
They default to never-expire — the #1 cost trap |
| 4 | Alarm on restarts and *_over_pod_limit, not just CPU/mem % |
Restarts and limit-breaches predict incidents earlier |
| 5 | Run exactly one collector (agent or ADOT) | Two collectors double metric cost and confuse debugging |
| 6 | Right-size requests/limits from utilization history, not guesses | The whole point — data-driven, not vibes |
| 7 | Use ADOT when you also need AMP/Prometheus or EKS Fargate | One collector, multiple backends |
| 8 | Move high-cardinality app metrics to AMP/AMG | Sample pricing beats per-metric for cardinality |
| 9 | Grant the agent least-privilege IAM via IRSA/Pod Identity, never node role | Scoped, auditable, rotatable |
| 10 | Turn enhanced OFF (or CI off) on dev/ephemeral clusters | You rarely need per-container history in dev |
| 11 | Correlate with X-Ray / ServiceLens for request-path issues | Metrics say “what”, traces say “where” |
| 12 | Tag and dashboard per team/namespace | Multi-tenant clusters need per-tenant views and chargeback |
Security notes
Container Insights touches identity, encryption, and network isolation — treat the collector like any other privileged workload.
| Concern | Guidance |
|---|---|
| Collector identity | Grant CloudWatchAgentServerPolicy via IRSA or Pod Identity to the cloudwatch-agent SA — never the node instance role, which shares the grant with every pod |
| Least privilege | The agent needs only cloudwatch:PutMetricData, EMF logs:* on the CI groups, and (optional) xray:PutTraceSegments — don’t attach CloudWatchFullAccess |
| Fluent Bit / task role | Scope logs write to arn:aws:logs:*:ACCT:log-group:/aws/containerinsights/*, not * |
| Log encryption | Enable KMS encryption on the CI log groups (associate-kms-key); performance/app logs can contain sensitive request data |
| Sensitive data in logs | App stdout may contain PII/secrets — filter/redact in Fluent Bit before shipping; never log tokens |
| IMDS lockdown | Set node IMDSv2 + hop limit 1 so a compromised app pod can’t steal node-role creds the agent doesn’t need it to have |
| Cross-account | For central observability, send metrics/logs cross-account via a role the agent assumes, scoped to the destination CI log groups |
| Add-on supply chain | The AWS-managed add-on pulls signed AWS images; pin/verify if you mirror to a private ECR |
Cost & sizing
Container Insights bills on three axes: extracted metrics (as custom metrics), log ingestion, and log storage. It is easy to be surprised, and easy to control. Approx us-east-1 list prices (2026; other regions vary, and ap-south-1 is a touch higher — INR at ~₹84/USD):
| Cost axis | Unit price (approx, us-east-1) | Driver | Lever |
|---|---|---|---|
| Custom metric | ~$0.30 / metric / month (first 10k) | # of series = pods × containers × signals × levels | Standard vs enhanced; fewer namespaces |
| Log ingestion | ~$0.50 / GB | performance + application + host + dataplane volume | Fewer log types; filter in Fluent Bit |
| Log storage | ~$0.03 / GB / month | Retention × ingest | Set retention (the big one) |
| Logs Insights query | ~$0.005 / GB scanned | Query volume | Narrow time ranges; scoped queries |
| Dashboards | First 3 free, then ~$3 / dashboard / month | # of custom dashboards | Reuse the auto dashboards |
| Alarms | ~$0.10 / standard alarm / month | # of alarms | Alarm on what matters |
Rough sizing: a 50-pod EKS cluster with enhanced observability might emit on the order of a few thousand custom metrics and ingest a few GB/day of logs. Ballpark that at $60–150/month (~₹5,000–₹12,600) if you set 7-day retention; leave retention at never-expire and the storage line grows without bound. The same cluster on standard with tighter retention can be half that. Practical guardrails:
| Lever | Action | Typical saving |
|---|---|---|
| Retention | 7 days /application, 3 days /performance,host,dataplane |
Biggest single win (storage) |
| Standard not enhanced | On non-critical/dev clusters | 30–60% fewer metrics |
| Off on dev | containerInsights=disabled / no add-on in dev |
100% of that cluster |
| AMP for cardinality | Move per-endpoint app metrics to AMP | Custom-metric cost avoided |
| Fewer log types | Ship only /application if you don’t need host/dataplane |
~40–60% log volume |
Free-tier note: CloudWatch’s free tier (10 custom metrics, 5 GB logs, 3 dashboards, 10 alarms) barely dents a real cluster — assume you pay from pod one. The EKS control plane ($0.10/hr ≈ ₹6,000/month) usually dwarfs the Container Insights line on small clusters, so don’t over-optimize telemetry while ignoring idle clusters.
Interview & exam questions
1. What does Container Insights collect that base CloudWatch doesn’t? Aggregated CPU, memory, network, disk, and restart/health metrics at cluster/node/pod/container/service/namespace (EKS) and cluster/service/task/container (ECS) levels — dimensions base CloudWatch lacks, which stops at the host. (SOA-C02, SAA-C03)
2. How is Container Insights enabled differently on EKS vs ECS? ECS is a cluster setting (containerInsights=enabled|enhanced) with no agent — AWS collects. EKS requires you to deploy a collector: the CloudWatch Observability add-on, an agent DaemonSet, or ADOT. (SOA-C02)
3. What is EMF and why does it matter here? Embedded Metric Format — structured JSON log events with an _aws block from which CloudWatch extracts metrics. Container Insights metrics are derived from performance log events, which is why both a log and a metric exist (and both are billed). (DVA-C02)
4. Which IAM policy does the CloudWatch agent need, and how should it be granted on EKS? CloudWatchAgentServerPolicy, granted to the cloudwatch-agent ServiceAccount via IRSA or EKS Pod Identity — never the node instance role. (SOA-C02, SCS-C02)
5. What is enhanced observability? A richer tier adding container-level metrics, detailed pod/node health/status, control-plane views (EKS), and curated drill-down dashboards — at higher metric cost. On by default with the add-on. (SOA-C02)
6. How do you get Container Insights on EKS Fargate? Use an ADOT collector (sidecar/collector) — you can’t run the agent DaemonSet on Fargate. Node metrics don’t apply (no host). (SAA-C03)
7. Where do container logs go, and what ships them? To /aws/containerinsights/<cluster>/application via Fluent Bit (EKS) or FireLens (ECS) — a separate pipeline from metrics, needing logs:PutLogEvents. (SOA-C02)
8. When would you choose AMP + Managed Grafana over Container Insights? When you’re Prometheus/PromQL-native, need high-cardinality custom app metrics cheaply, want the Grafana dashboard ecosystem, or need central multi-cluster federation. Often run both. (SAA-C03)
9. Why might a pod_number_of_container_restarts alarm never fire? It’s a cumulative counter; a static threshold on a rising value mis-triggers. Alarm on the rate/increase (metric math RATE) or Maximum over a rolling window with treat-missing-data notBreaching. (SOA-C02)
10. What are the main Container Insights cost drivers and controls? Custom metrics (enhanced × pods), log ingest, and log storage (never-expire default). Controls: set retention, standard vs enhanced, disable on dev, move cardinality to AMP. (SOA-C02)
11. How do you correlate a pod metric spike with the failing downstream call? Drill the Container Insights map to the pod, jump to its /application logs, then open X-Ray / ServiceLens to the trace map — the collector can feed all three pillars. (DVA-C02)
12. What’s the difference between the CloudWatch agent and ADOT for Container Insights? Both produce the same EMF. The agent (add-on) is the managed, simplest path; ADOT is OTel-native, required for AMP remote-write and EKS Fargate, and can fan-out to multiple backends. Run one, not both. (SAA-C03)
Quick check
- On EKS, you see the
ContainerInsightsnamespace is empty. What’s the first thing to check? - Which single command turns on enhanced Container Insights for an existing ECS cluster?
- Container logs land in which log group, shipped by what?
- Why is setting log retention the most important cost action?
- You need Container Insights on EKS Fargate — which collector, and why not the DaemonSet?
Answers
- Whether a collector is running:
kubectl get pods -n amazon-cloudwatch. EKS needs a deployed agent/add-on/ADOT (unlike ECS). If empty, install the Observability add-on. aws ecs update-cluster-settings --cluster <name> --settings name=containerInsights,value=enhanced./aws/containerinsights/<cluster>/application, shipped by Fluent Bit (EKS) or FireLens (ECS) — a separate pipeline from metrics.- Because all four
/aws/containerinsights/*groups default to never-expire, so storage grows forever; retention is the biggest single cost lever. - ADOT (as a sidecar/collector) — DaemonSets can’t run on Fargate, and there’s no node to scrape, so ADOT collects task/pod metrics instead.
Glossary
| Term | Definition |
|---|---|
| Container Insights | CloudWatch feature that aggregates container metrics/logs at cluster/node/pod/container/service/namespace/task level for EKS & ECS |
| EMF (Embedded Metric Format) | Structured JSON log events with an _aws block from which CloudWatch extracts metrics |
| Performance log event | The EMF document (in /performance) that is the source of Container Insights metrics |
| CloudWatch agent | The collector that reads kubelet/cAdvisor and writes EMF; deployed as a DaemonSet on EKS |
| CloudWatch Observability add-on | amazon-cloudwatch-observability — the managed EKS add-on that installs the agent + Fluent Bit (enhanced on) |
| ADOT | AWS Distro for OpenTelemetry — an OTel collector that can export to CloudWatch (EMF) and AMP |
| Fluent Bit | Lightweight log router that ships container stdout/stderr to CloudWatch Logs |
| FireLens | ECS log-routing integration using a Fluent Bit/Fluentd sidecar |
| Enhanced observability | The richer Container Insights tier: container-level metrics, health/status, control-plane, drill-down dashboards |
| IRSA | IAM Roles for Service Accounts — how the EKS agent gets least-privilege AWS credentials via OIDC |
| AMP | Amazon Managed Service for Prometheus — managed Prometheus-compatible metric store |
| AMG | Amazon Managed Grafana — managed Grafana for PromQL/CloudWatch dashboards |
| ServiceLens | CloudWatch view that ties metrics, logs, and X-Ray traces into a service map |
ContainerInsights namespace |
The CloudWatch metric namespace for EKS Container Insights (ECS/ContainerInsights for ECS) |
pod_number_of_container_restarts |
Cumulative Container Insights metric — the earliest CrashLoop signal; alarm on its rate |
Next steps
- Master the core CloudWatch mechanics these dashboards and alarms are built on in Amazon CloudWatch Hands-On: Metrics, Alarms, Dashboards & SNS Notifications.
- Add the third observability pillar with AWS X-Ray: Distributed Tracing for Serverless & Microservices, End to End and correlate it via ServiceLens.
- Give the CloudWatch agent least-privilege identity properly in EKS Pod IAM Permissions: IRSA and EKS Pod Identity Hands-On.
- When the pods you’re watching won’t stay up, work EKS Pod Troubleshooting: Pending, CrashLoopBackOff, ImagePull & CNI IP Exhaustion and Why Your ECS Task Won’t Start: Stopped-Task Reasons, Health Checks & a Playbook.
- Scale the workloads you’re now measuring with ECS Task Definitions, Services & Auto Scaling: The Complete Hands-On.