The alarm says p99 Latency > 3s on the checkout API, and the API Gateway metric is the only number you have. Is it the gateway, the Lambda cold start, the DynamoDB call that got throttled, or the third-party payment HTTP call your handler makes? With metrics alone you can prove that the request was slow; you cannot prove where the second and a half went. A distributed trace answers exactly that question — it is the single request, reassembled end to end from every service it touched, with a timeline that shows which hop spent the time and which hop threw the fault. AWS X-Ray is the service that collects those traces, stitches them by a shared trace ID, and draws the service map you stare at during an incident.
This is the reference you keep open while you instrument a system and while you debug one. It treats X-Ray as what it actually is: a small, precise data model — a trace made of segments (one per service) and subsegments (one per downstream call), all carrying the same ID that rides an HTTP header called X-Amzn-Trace-Id from the first hop to the last — plus a set of controls that decide how much of that data you keep (sampling rules), what you can search on (annotations vs metadata), and how the data gets out of your process (the X-Ray SDK and either the X-Ray daemon or the ADOT/OpenTelemetry Collector, which is the strategic direction). Get the model right and the service map is a diagnostic instrument; get it wrong and you have a bill, a half-drawn map with a black hole in the middle, and a customer_id you cannot filter on because you stored it as metadata.
By the end you will enable active tracing on a real API Gateway → Lambda → DynamoDB app, add your own subsegments and annotations, read the service map, filter traces by an annotation, and write a sampling rule that keeps every checkout and almost none of the health checks — all in both aws CLI and Terraform, with a teardown. Then a troubleshooting playbook walks the failures that actually page you: the trace that never showed up, the map with a missing hop, the subsegment that vanished because the SDK never wrapped the client, and the bill that tripled because sampling was left wide open. It maps to the observability domains of DVA-C02, SOA-C02 and SAP-C02.
What problem this solves
A microservice or serverless request is not one process; it is a chain — client → API Gateway → Lambda → DynamoDB → a payment API → an SNS publish. Each link emits its own logs to its own log group and its own metrics to its own namespace, all keyed by time, none keyed to this specific request. When the request is slow or fails, you are left correlating by timestamp across five CloudWatch log groups, guessing which PutItem at 02:14:07.412 belongs to the checkout that the customer is complaining about. That correlation-by-eyeball is the entire pain, and it gets exponentially worse with every service you add.
What breaks without tracing is mean time to innocence and, more importantly, mean time to the actual culprit. A team sees API Gateway p99 spike and spends an hour tuning the gateway, when the real cost was a DynamoDB call being throttled two hops downstream. Another sees Lambda Duration climb and adds memory, when the latency was a cold-start Init phase they could not see decomposed. A third cannot even tell that a request crossed a queue — the producer logged “published,” the consumer logged “processed,” and nobody can prove they were the same message. Distributed tracing exists to replace “correlate by timestamp and hope” with “open the trace, read the timeline, the slow subsegment is red.”
Who hits this: anyone operating more than one service behind a request, and everyone on serverless and microservices. It bites hardest on teams whose latency is composed — a p99 that is the sum of five hops, where the offending hop moves week to week — and on anyone doing async work across SNS/SQS/EventBridge where the causal chain is invisible in logs. The fix is not “add more logging.” It is: propagate one trace ID across every hop, emit a segment per service and a subsegment per call, index the one or two business fields you will filter on, and let X-Ray draw the map.
Here is the whole model on one screen — the artefact, what it represents, and the one thing to remember — before the deep dive:
| X-Ray artefact | What it represents | Emitted by | The one thing to remember |
|---|---|---|---|
| Trace | The entire end-to-end request | Assembled by X-Ray from all segments sharing a trace ID | One X-Amzn-Trace-Id binds the whole chain |
| Segment | One service’s slice of the request | Each instrumented service (API GW, Lambda, ECS task) | Has error/fault/throttle flags and timing |
| Subsegment | One downstream call or unit of work | The X-Ray SDK, auto or manual | A missing subsegment = the SDK never wrapped the client |
| Trace ID | The correlation key | The first hop; propagated downstream | Format 1-{epoch}-{24 hex}; rides the HTTP header |
| Annotation | An indexed, filterable key-value | Your code via put_annotation |
Searchable: annotation.customer_id = "A123" |
| Metadata | Un-indexed context (any JSON) | Your code via put_metadata |
Stored, visible, but not filterable |
| Service map | Nodes = services, edges = calls | X-Ray, from the segment graph | A black hole = an uninstrumented hop |
| Sampling rule | How much to record (cost knob) | Evaluated at the entry point | Default = 1 req/s + 5% of the rest |
Learning objectives
By the end of this article you can:
- Read a trace as a tree of segments and subsegments, and state from the timeline exactly which hop spent the time and which hop set
fault,errororthrottle. - Explain trace-ID propagation through the
X-Amzn-Trace-Idheader — itsRoot,Parent,SampledandSelffields — and how the sampling decision is made once at the edge and honoured downstream. - Read a service map / trace map: nodes as services, edges as calls, each annotated with latency percentiles and error/fault/throttle rates, and diagnose a missing node as an uninstrumented hop.
- Write sampling rules — reservoir + fixed rate, matched by service, host, HTTP method, URL path or resource ARN — to keep the traces that matter and drop the noise, and predict the cost impact.
- Choose annotations (indexed, filterable, ≤50 per trace) over metadata (stored, not indexed) correctly, and write X-Ray filter expressions to find the traces you need.
- Instrument three ways — the X-Ray SDK, auto-instrumentation, and OpenTelemetry via ADOT — and choose between the X-Ray daemon and the ADOT Collector, knowing ADOT/OTel is the strategic direction.
- Enable native tracing on Lambda (active tracing), API Gateway, ECS/EKS (daemon sidecar / DaemonSet), App Runner, and follow trace context across SNS/SQS.
- Correlate a trace with CloudWatch metrics and Logs through ServiceLens, turn on X-Ray Insights for anomaly detection, and scope maps with groups.
Prerequisites & where this fits
You should be comfortable with the request path this article traces: a client calls API Gateway, which invokes a Lambda function under an IAM execution role, which calls DynamoDB with the AWS SDK and writes to a CloudWatch Logs group named /aws/lambda/<function>. You should be able to run aws from a shell, read JSON with --query, edit a Terraform aws provider block, and read a stack trace. HTTP status codes, the difference between a client 4xx and a server 5xx, and the ideas of “cold start” and “downstream call” should be familiar.
This sits in the Observability track, and it is the third leg of a stool. Metrics tell you that something is wrong and alarm on it — built in Amazon CloudWatch Hands-On: Metrics, Alarms, Dashboards & SNS Notifications. Logs tell you what the code said at the moment — and container-level telemetry is covered in Container Insights: Monitoring EKS & ECS Metrics, Logs & Performance. Traces tell you where in the request the time and the fault went — that is X-Ray, and ServiceLens is the seam that joins all three on one map. The two services you will trace here are documented in their own right: the front door in Amazon API Gateway Hands-On: Building REST and HTTP APIs, and the failure modes of the compute in AWS Lambda Errors, Timeouts & Cold Starts: The Troubleshooting Playbook — X-Ray is the instrument that makes those failures visible per request.
Before the deep dive, fix where each part of tracing lives, so you look in the right place when a trace is missing or wrong:
| Layer | What lives here | Failure it causes when misconfigured | First place to look |
|---|---|---|---|
| Entry point (edge) | Sampling decision, trace-ID creation | No traces, or too many/too few | API GW stage tracingEnabled; sampling rules |
| Propagation | The X-Amzn-Trace-Id header on every hop |
Broken chain; two traces instead of one | The header on the outbound request |
| Instrumentation | SDK / auto / OTel wrapping your calls | Missing subsegments; black-hole map | Is the client patched / captured? |
| Egress from process | Daemon or ADOT collector, UDP :2000 | Segments generated but never uploaded | Daemon reachable? IAM write perms? |
| X-Ray service | Stitching, service map, retention | Map has a gap; trace not searchable | Filter expression; annotation vs metadata |
| Correlation | ServiceLens, Insights, groups | Can’t jump trace → log → metric | ServiceLens map; group filter |
Core concepts
X-Ray has a deliberately small vocabulary. Learn these six words precisely and the rest of the service is configuration.
A trace is the whole request. It has one trace ID and is assembled server-side by X-Ray from every segment that reports that ID within the trace’s lifetime. You never “create a trace” as an object; you create segments that share an ID, and X-Ray joins them.
A segment is one service’s contribution — the work API Gateway did, then the work the Lambda function did, then the work an ECS task did. A segment is a JSON document with a name (the service/resource), start and end times, an HTTP block (method, URL, status, response size), an aws block (account, region, resource), the boolean flags error, fault and throttle, an optional cause with the exception, and arrays of annotations, metadata and subsegments.
A subsegment is a unit of work inside a segment — one DynamoDB PutItem, one HTTP call to a payment API, one function you chose to time. Subsegments nest, so a trace is a tree: segment → subsegment → subsegment. The X-Ray SDK generates most subsegments for you by wrapping (patching) the AWS SDK and HTTP clients; you add manual subsegments around code you want to measure. The single most common instrumentation bug is a missing subsegment because the client was never patched.
| Term | Precise definition | Scope | You control it by |
|---|---|---|---|
| Trace | All segments sharing one trace ID, assembled by X-Ray | The whole request | Propagating one trace ID |
| Segment | One service’s timed slice, with flags + HTTP + aws blocks | One service | Instrumenting the service |
| Subsegment | A timed unit inside a segment (a call or block) | One downstream call | SDK patch / manual subsegment |
| Trace ID | 1-{8-hex epoch}-{24-hex random} correlation key |
Whole trace | Header propagation |
| Segment ID | 16-hex (64-bit) id of one segment/subsegment | One node | Generated by SDK |
| Annotation | Indexed key-value (string/number/bool), ≤50/trace | One segment | put_annotation(key, value) |
| Metadata | Arbitrary JSON, namespaced, not indexed | One segment | put_metadata(ns, key, value) |
| Error / Fault / Throttle | Booleans: 4xx client / 5xx server / 429 throttle | One segment/subsegment | Set by SDK from status or exception |
The trace ID and the X-Amzn-Trace-Id header
A trace ID looks like 1-5f84c7a9-1a2b3c4d5e6f7a8b9c0d1e2f: a version (1), a hyphen, the 8-hex-digit epoch seconds of when the trace started, another hyphen, and 24 hex digits of randomness. The epoch prefix is why X-Ray rejects segments whose ID timestamp is too old or in the future — the ID literally carries its own age, and traces are retained for 30 days.
Propagation happens through an HTTP header, X-Amzn-Trace-Id. Its fields:
| Field | Example | Meaning | Who sets it |
|---|---|---|---|
Root |
Root=1-5f84c7a9-1a2b... |
The trace ID for the whole request | The first instrumented hop |
Parent |
Parent=53995c3f42cd8ad8 |
The segment ID of the caller | Each hop, for its downstream call |
Sampled |
Sampled=1 |
1 = record this trace, 0 = don’t | The sampling decision at entry |
Self |
Self=1-5f84... |
Added by ALB to mark its own hop | Application Load Balancer |
Lineage |
internal | Loop/depth protection (Lambda) | Managed by AWS internally |
The crucial rule: the sampling decision is made once, at the first hop, and honoured by everyone downstream via Sampled. If API Gateway decides Sampled=1, the Lambda and everything it calls record their segments; if Sampled=0, they skip the overhead. If a client sends its own X-Amzn-Trace-Id, an instrumented service continues that trace rather than starting a new one — which is how you connect a browser or an upstream service into the same trace.
The segment document: fields, flags and subsegments
Everything X-Ray shows you is rendered from segment JSON. Knowing the fields lets you read a raw trace (aws xray batch-get-traces) and understand why the console drew what it drew.
| Field | Type | Meaning | Notes / gotcha |
|---|---|---|---|
name |
string | The service/resource name (the map node label) | Keep it stable; the map groups by name |
id |
16-hex | This segment’s ID | Referenced as Parent downstream |
trace_id |
string | The trace this belongs to | 1-{epoch}-{24hex}; omitted on subsegments |
start_time |
epoch float | When the work started | Seconds with millis, e.g. 1727000000.123 |
end_time |
epoch float | When it finished | Omit and set in_progress:true for streaming |
parent_id |
16-hex | Caller’s segment/subsegment id | How the tree is built |
origin |
string | The AWS resource type | e.g. AWS::Lambda::Function, AWS::ApiGateway::Stage |
http |
object | request (method, url) + response (status, content_length) |
Drives edge status colours |
aws |
object | account_id, region, operation, resource_names |
Populated by SDK patching |
error |
bool | A client error (4xx, except 429) | Orange on the map |
throttle |
bool | A 429 / throttled call | Subset of client-side |
fault |
bool | A server fault (5xx) or unhandled exception | Red on the map |
cause |
object | The exception: message, type, stack | Populated on fault/error |
annotations |
object | Indexed key-values | Filterable; ≤50 per trace |
metadata |
object | Namespaced arbitrary JSON | Not indexed |
subsegments |
array | Nested subsegment documents | The downstream calls |
error vs fault vs throttle — the three flags that colour the map
These three booleans are the difference between “the map is orange” (your callers sent bad requests) and “the map is red” (your service is broken). Get them straight:
| Flag | HTTP class | Whose fault | Map colour | Example |
|---|---|---|---|---|
error |
4xx (400–499, not 429) | The caller | Orange | 400 bad body, 404 not found, 403 denied |
throttle |
429 | Capacity / limits | Amber (special-cased) | DynamoDB ProvisionedThroughputExceeded, API GW 429 |
fault |
5xx (500–599) | Your service / downstream | Red | Unhandled exception, 502/503/504, timeout |
| (none set) | 2xx/3xx | — | Green | Healthy call |
Subsegment namespaces: aws vs remote
A subsegment carries a namespace that tells the map what kind of edge to draw:
| Namespace | Used for | Example | Effect on the map |
|---|---|---|---|
aws |
Calls to AWS services via the SDK | DynamoDB, S3, SNS | Draws a node for the AWS service (e.g. a DynamoDB table) |
remote |
Calls to non-AWS endpoints | A third-party payment HTTP API | Draws a downstream node for the external host |
| (none) | Local instrumented work | A parse_order function you timed |
Nested inside the segment, no new node |
The service map and trace map
The service map (in the console, and via aws xray get-service-graph) is the graph X-Ray builds by walking every segment’s parent_id: nodes are services, edges are calls between them. It is the picture you open first in an incident because it shows health at a glance — a red node is faulting, an orange node has client errors, a thick edge is slow.
Each node and edge carries rolled-up statistics over the selected time window:
| Statistic | What it measures | Read it as |
|---|---|---|
| Average latency | Mean response time of the node/edge | Baseline; hides the tail |
| p50 / p90 / p95 / p99 | Latency percentiles | p99 is what your alarm and your users feel |
| Requests/min | Call rate through the node/edge | Traffic; a dropped edge = a broken caller |
| Error rate (%) | Share of calls with error (4xx) |
Orange; caller-side problems |
| Fault rate (%) | Share of calls with fault (5xx) |
Red; your problem — chase this first |
| Throttle rate (%) | Share of calls with throttle (429) |
Amber; raise limits / back off |
| OK rate (%) | Share of clean 2xx/3xx | Your success budget |
The node’s colour is a quick health signal, computed from the ratio of faults/errors to total:
| Node colour | Meaning | Typical trigger |
|---|---|---|
| Green | Healthy | Faults + errors ≈ 0% |
| Orange ring | Client errors present | 4xx rate above ~0 |
| Red ring | Faults present | 5xx / exception rate above ~0 |
| Grey/hollow | No data in window | Node not called, or not instrumented |
The trace map (per-trace, not aggregated) is the same graph for a single request — you open it from one trace to see that specific request’s path and where it spent its time. The service map answers “which service is unhealthy right now”; the trace map answers “what did this one slow request do.” A black hole — a node your traffic clearly reaches but which does not appear — always means one thing: that hop is not instrumented, so it never emitted a segment.
Sampling rules: controlling volume and cost
X-Ray charges per trace recorded, and a busy service does not need 100% of a million identical health-check traces. Sampling rules decide, at the entry point, which requests to record. The decision is expressed as a reservoir (a guaranteed number of traces per second) plus a fixed rate (a percentage of everything above the reservoir).
The default rule that ships in every account is: record the first 1 request each second (reservoir = 1), then 5% of any additional requests (rate = 0.05). That guarantees you always see something even on a quiet service, and caps the flood on a busy one.
You add custom rules to say “trace all of checkout” or “trace none of the load-balancer health check.” Each rule is matched by request attributes and ordered by priority (lowest number wins):
| Sampling rule field | Purpose | Values / example | Notes |
|---|---|---|---|
RuleName |
Identifier | checkout-all |
Unique per account |
Priority |
Evaluation order | 1–9999, lower = higher priority |
First match wins |
ReservoirSize |
Guaranteed traces/sec | 5 |
Per-account, distributed across the fleet |
FixedRate |
Fraction of the rest | 0.0–1.0 (e.g. 1.0 = 100%) |
Applied above the reservoir |
ServiceName |
Match the service | checkout-api or * |
The segment name |
ServiceType |
Match resource type | AWS::Lambda::Function, * |
The origin |
Host |
Match the Host header | api.example.com, * |
For HTTP entry points |
HTTPMethod |
Match the method | POST, GET, * |
— |
URLPath |
Match the path (wildcards) | /checkout*, /health |
* and ? wildcards |
ResourceARN |
Match the resource | ARN or * |
Often * |
Attributes |
Match custom segment attrs | up to 5 | X-Ray SDK only, not OTel |
Version |
Schema version | 1 |
Required |
How reservoir + rate combine
The two knobs stack. Say a rule has ReservoirSize = 5 and FixedRate = 0.10, and 100 requests/second arrive that match it:
| Traffic (req/s) | Reservoir catches | Rate (10%) catches the rest | Total recorded/s |
|---|---|---|---|
| 3 | 3 (all, ≤ reservoir) | 0 | 3 |
| 5 | 5 | 0 | 5 |
| 100 | 5 | 10% × 95 ≈ 9.5 | ≈ 14.5 |
| 1,000 | 5 | 10% × 995 ≈ 99.5 | ≈ 104.5 |
| 10,000 | 5 | 10% × 9,995 ≈ 999.5 | ≈ 1,004.5 |
The reservoir is your floor (you always get at least 5/s even in a lull); the rate governs the slope as traffic grows. The SDK/daemon fetches the effective rules with GetSamplingRules and reports usage with GetSamplingTargets so X-Ray can distribute the reservoir fairly across many instances.
Rules that earn their keep
| Goal | Match on | ReservoirSize | FixedRate | Priority |
|---|---|---|---|---|
| Trace every checkout | URLPath=/checkout*, POST |
10 | 1.0 (100%) | 100 |
| Never trace health checks | URLPath=/health |
0 | 0.0 (0%) | 90 |
| Sample a chatty read path lightly | URLPath=/products*, GET |
1 | 0.02 (2%) | 200 |
| Trace all of a flaky new service | ServiceName=payments-* |
5 | 1.0 | 150 |
| Everything else (the default) | * |
1 | 0.05 | 10000 |
Note the priorities: the /health rule (priority 90) must beat the /checkout* rule and the default; the more specific and important a rule, the lower its priority number. Sampling controls both cost and signal — too aggressive and you miss the one trace you needed; too loose and you pay for a million identical ones.
Annotations vs metadata: what you can filter on
This is the distinction that separates a trace store you can search from one you can only browse. Both attach business context to a segment; only one is indexed.
| Aspect | Annotation | Metadata |
|---|---|---|
| Indexed / searchable | Yes — filter expressions | No — stored, viewable only |
| Filter syntax | annotation.customer_id = "A123" |
not filterable |
| Value types | string, number, boolean | any JSON (objects, arrays) |
| Size / count limit | ≤ 50 annotations per trace | Large arbitrary JSON (counts to segment size) |
| Key rules | alphanumeric + underscore, no spaces/dots | free-form, organised by namespace |
| Cost of indexing | Counts toward indexed keys | None (not indexed) |
| Use it for | IDs and low-cardinality fields you filter by | Rich debug context (payloads, config) |
| Set it with | put_annotation("customer_id", "A123") |
put_metadata("order", {...}, "app") |
The rule of thumb: annotate the handful of fields you will search on (customer ID, tenant, order ID, feature flag, cart size bucket) and put everything else in metadata. Annotating high-cardinality or bulky data is wasteful; storing a filterable ID as metadata is the single most common “why can’t I find my traces” bug.
Filter expressions you will actually type
The console search box and aws xray get-trace-summaries --filter-expression speak the same language:
| Filter expression | Finds | Notes |
|---|---|---|
annotation.customer_id = "A123" |
Traces you annotated for that customer | String value in quotes |
annotation.cart_total >= 500 |
Numeric annotation comparison | Numbers unquoted |
fault = true |
Traces with any 5xx / exception | The incident starter |
error = true |
Traces with any 4xx | Caller problems |
throttle = true |
Traces that hit a 429 | Capacity problems |
responsetime > 3 |
Traces slower than 3 seconds | Root segment duration |
duration > 5 |
Total trace duration > 5s | Includes downstream |
http.status = 500 |
Traces whose entry returned 500 | Entry HTTP status |
http.url CONTAINS "/checkout" |
By URL substring | — |
service("checkout-api") |
Traces passing through that service | Scope by node |
service("checkout-api") { fault = true } |
Faults at that service | Node-scoped predicate |
edge("api-gw", "checkout-api") |
Traces crossing that specific call | Scope by edge |
service(id(name: "ddb", type: "AWS::DynamoDB::Table")) { throttle = true } |
Throttled DynamoDB calls | Precise node id |
!ok |
Not-2xx traces (error OR fault) | Quick “show me the bad ones” |
annotation.customer_id = "A123" AND fault = true |
Combine predicates | AND/OR/NOT |
Instrumentation: SDK, auto-instrumentation, daemon vs ADOT
There are two questions in instrumentation: how does my code produce segments (SDK vs auto vs OpenTelemetry) and how do those segments leave my process (the X-Ray daemon vs the ADOT Collector).
Producing segments
| Approach | How it works | Effort | Best for |
|---|---|---|---|
| X-Ray SDK | You import the SDK, patch_all() to wrap AWS SDK + HTTP + SQL clients, and add manual subsegments/annotations |
Low–medium | Existing AWS-native apps; full control of annotations |
| Auto-instrumentation | An agent/wrapper instruments common libraries with no code change (e.g. Lambda layers, Java agent) | Lowest | Getting a baseline map fast |
| OpenTelemetry (ADOT) | Vendor-neutral OTel SDK produces spans; the ADOT Collector exports them to X-Ray (and elsewhere) | Medium | New apps; multi-backend; the strategic direction |
The X-Ray SDK’s core trick is patching: aws_xray_sdk.core.patch_all() monkey-patches boto3, requests, urllib, database drivers and more so every call they make becomes a subsegment automatically. Skip the patch and your DynamoDB call still runs — it just never shows up as a subsegment, and the table never appears on the map.
| X-Ray SDK language | Package | AWS SDK auto-patch | Notes |
|---|---|---|---|
| Python | aws-xray-sdk |
patch_all() / patch(['boto3']) |
Decorators @xray_recorder.capture |
| Node.js | aws-xray-sdk |
captureAWSv3Client(client) |
Express/Koa middleware |
| Java | aws-xray-sdk-java |
AWS SDK request handlers | Servlet filter; Spring support |
| Go | aws-xray-sdk-go |
xray.AWS(client) |
xray.Handler for HTTP |
| .NET | AWSXRayRecorder |
RegisterXRayForAllServices() |
ASP.NET middleware |
| Ruby | aws-xray-sdk |
Rack middleware | — |
Getting segments out: daemon vs ADOT Collector
Your process emits segments as UDP datagrams to a local agent, which batches them and calls PutTraceSegments on the X-Ray API. That agent is either the X-Ray daemon or the ADOT Collector.
| Aspect | X-Ray daemon | ADOT Collector (OpenTelemetry) |
|---|---|---|
| Protocol in | X-Ray segment JSON over UDP :2000 | OTLP (gRPC :4317 / HTTP :4318) + X-Ray receiver |
| Exports to | X-Ray only | X-Ray, CloudWatch, Prometheus, Amazon Managed Prometheus, 3rd-party |
| Data model | X-Ray segments | OpenTelemetry spans/metrics/logs |
| Where it runs | Sidecar (ECS), DaemonSet (EKS), on-host, bundled in Lambda | Sidecar, DaemonSet, gateway, or Lambda layer |
| Config | cfg.yaml (region, role, endpoint) |
OTel pipeline YAML (receivers/processors/exporters) |
| Strategic status | Stable, AWS-specific, maintenance | Recommended direction; unifies traces+metrics+logs |
| When to pick | Existing X-Ray SDK app, simplest path | New apps, multi-backend, standardising on OTel |
AWS’s stated direction is OpenTelemetry via ADOT. New systems should emit OTel spans and export to X-Ray (and CloudWatch) through the ADOT Collector; the X-Ray daemon and SDK remain fully supported for existing workloads. Practically: you do not need to rip out a working X-Ray SDK app, but if you are greenfield, start on OTel.
The daemon’s essentials, because you will configure it on ECS/EKS/EC2:
| Daemon detail | Value | Why it matters |
|---|---|---|
| Listen port | UDP 2000 (configurable) | The SDK sends here; sidecar = 127.0.0.1:2000 |
| Image (ECS/EKS) | public.ecr.aws/xray/aws-xray-daemon |
Run as sidecar / DaemonSet |
| API called | PutTraceSegments, PutTelemetryRecords |
Needs AWSXRayDaemonWriteAccess |
| Sampling calls | GetSamplingRules, GetSamplingTargets |
To honour central rules |
| Buffer | In-memory ring buffer | Drops segments if X-Ray is unreachable (not queued to disk) |
| Env for SDK | AWS_XRAY_DAEMON_ADDRESS=host:2000 |
Point the SDK at a non-local daemon |
Native service integrations
Many AWS services emit X-Ray data for you once you flip a switch — you do not always have to run a daemon or write SDK code.
| Service | How to enable tracing | What it emits | Gotcha |
|---|---|---|---|
| Lambda | TracingConfig.Mode = Active |
Service + function segment, Init/Invoke/Overhead subsegments; runs the daemon for you | Needs AWSXRayDaemonWriteAccess on the exec role |
| API Gateway (REST) | Stage tracingEnabled = true |
A gateway segment; creates/propagates the trace header | HTTP APIs (v2) do NOT support X-Ray |
| ECS | Run the daemon as a sidecar container | Your app’s SDK segments via UDP :2000 | Task role needs write perms; container link |
| EKS | Daemon as a DaemonSet or ADOT Collector | App SDK/OTel spans | Point SDK at the daemon service; IRSA for perms |
| App Runner | Enable observability with the ADOT-based config | OTel traces to X-Ray | ADOT under the hood — no daemon to manage |
| Elastic Beanstalk | XRayEnabled option |
Runs the daemon on the instance | Old but still works |
| SNS | Enable active tracing on the topic | Propagates trace header to subscribers | Needs a resource policy allowing X-Ray |
| SQS | Carries AWSTraceHeader system attribute |
Links producer → queue → consumer | Consumer must read + continue the header |
| Step Functions | Enable X-Ray on the state machine | A segment per state/execution | Great for long workflows |
| ELB (ALB) | Adds Self to the trace header |
Marks its hop | ALB does not create traces itself |
| DynamoDB / S3 / etc. | Via the calling SDK’s subsegment | An aws-namespace node on the map |
Appears only if the caller is instrumented |
Lambda active tracing — read the three subsegments right
When you turn on active tracing, a Lambda invocation produces a function segment split into three subsegments, and misreading them is a classic false alarm:
| Subsegment | Covers | When it’s large | Don’t confuse it with |
|---|---|---|---|
| Initialization | Cold-start init: runtime + your module-level code | First call on a new execution env (cold start) | A slow handler — this is before your handler runs |
| Invocation | Your handler + all downstream calls | The real per-request work | The whole invocation cost |
| Overhead | Runtime cleanup between invoke and next freeze | Rarely; log flushing, extensions | Your code’s latency |
A tall Initialization subsegment on the first trace after a lull is a cold start, not a slow function. Chasing it as latency wastes an afternoon; the fix is provisioned concurrency or a smaller package, covered in the Lambda troubleshooting reference — not adding memory to the handler.
Trace context across SNS and SQS
Async breaks naive log correlation, but X-Ray follows it if you let it:
| Hop | What carries the trace | If you skip it |
|---|---|---|
| Producer → SNS | SNS active tracing forwards the header | The chain stops at SNS |
| SNS → SQS | The AWSTraceHeader message system attribute |
Subscriber starts a new trace |
| SQS → consumer | Consumer reads AWSTraceHeader and continues |
Producer and consumer look unrelated |
| EventBridge | Propagates trace context on the event | Rule targets start fresh traces |
Trace analytics, Insights, groups and ServiceLens
Beyond the raw map, X-Ray gives you three higher-order tools.
Groups scope the map and its metrics to a filter expression. A group named checkout defined as service("checkout-api") OR annotation.flow = "checkout" gives you a checkout-only service map and publishes group-scoped CloudWatch metrics — so you can alarm on the checkout flow’s fault rate, not the whole account’s.
X-Ray Insights does anomaly detection on a group: it learns the normal fault rate per node and, when faults deviate, opens an insight with a start time, the impacted nodes, the root-cause node, and an estimated number of affected requests. Insights can notify via EventBridge, so an anomaly on the map can page you.
| Feature | What it does | Enable it on | Reads via |
|---|---|---|---|
| Groups | Scoped map + metrics by filter expression | Account (create a group) | get-groups, filter box |
| Insights | Anomaly detection + impact analysis on a group | Per group (InsightsConfiguration) |
get-insight-summaries |
| Insight events | Timeline of an anomaly’s growth | Per insight | get-insight-events, EventBridge |
| Analytics | Interactive filtering/faceting over trace summaries | Console | get-trace-summaries (scanned) |
| ServiceLens | Map fusing traces + CloudWatch metrics + Logs | On by default with X-Ray + CW | CloudWatch console |
ServiceLens is the seam. It renders the X-Ray service map inside CloudWatch and overlays each node with its CloudWatch metrics and a click-through to its Logs — so a red node on the map is one click from the exact log lines and metric graphs for that service and time window. This is how you get “trace → log line → metric” without correlating by timestamp, and it is the single biggest day-to-day payoff of turning tracing on.
Architecture at a glance
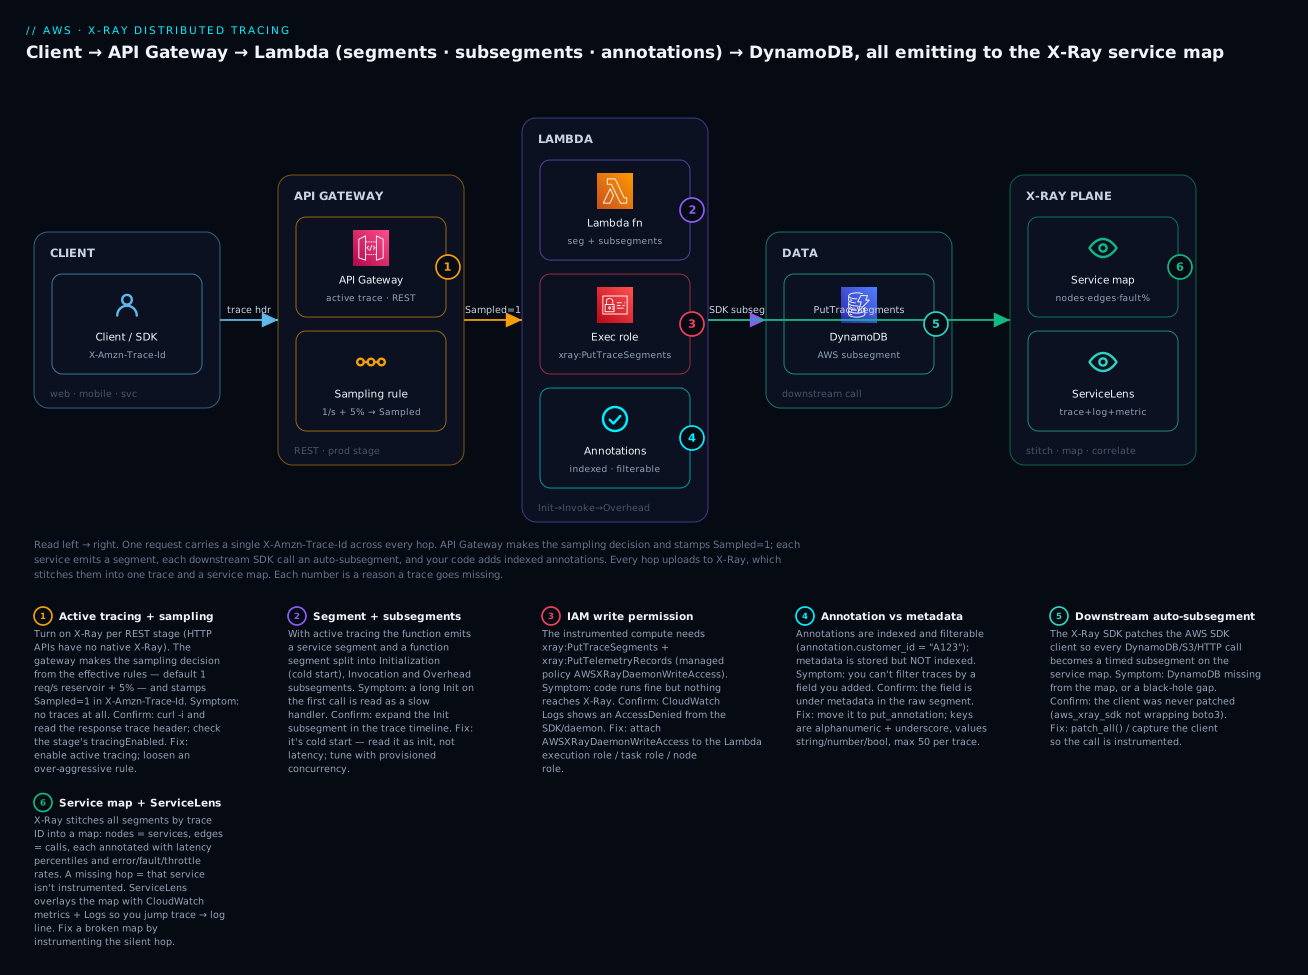
The diagram traces one checkout request left to right. A client sends X-Amzn-Trace-Id (or lets the edge create it). API Gateway (REST, active tracing on) makes the sampling decision from the effective rules — default 1 req/s + 5% — stamps Sampled=1, and emits its segment. The request reaches the Lambda function, which runs under an execution role carrying xray:PutTraceSegments; it emits a function segment split into Init / Invoke / Overhead subsegments, and your code adds annotations (indexed, filterable) for customer_id and cart_total. The handler’s DynamoDB call becomes an auto-subsegment in the aws namespace, adding a table node. Every hop uploads to the X-Ray plane, which stitches the segments by trace ID into the service map (nodes = services, edges = calls, each with latency and fault/error/throttle rates) and joins them to CloudWatch metrics and Logs through ServiceLens. Each numbered badge marks a reason a trace goes missing or a hop disappears from the map.
Real-world scenario
Meridian Retail runs a serverless checkout: API Gateway (REST) → a Python Lambda checkout-fn → DynamoDB Orders, plus a synchronous HTTPS call to a third-party fraud-scoring API. During a Friday promotion, the CloudWatch alarm p99 Latency > 3s fired on the API Gateway stage. The on-call engineer had the gateway metric and five log groups and no way to prove which hop was slow. The team had shipped fast and never turned on tracing.
They enabled it under fire. Active tracing on the Lambda (TracingConfig.Mode=Active), tracingEnabled=true on the prod stage, attached AWSXRayDaemonWriteAccess to the execution role, and added three lines of SDK code: patch_all(), put_annotation("customer_id", cid), and put_annotation("cart_total", total). Within minutes the service map told the whole story. The checkout-fn node was green on average but the edge to the fraud API was red at p99 — the third-party call was intermittently taking 2.4 seconds, and it sat on the synchronous path so its tail became the customer’s tail. DynamoDB was fine. The gateway was fine. The time was entirely in one downstream remote-namespace subsegment.
Filtering annotation.cart_total >= 500 AND responsetime > 3 surfaced the slow traces, and they were disproportionately large carts — the fraud API was slower for high-value orders. The trace map for a single slow request made it undeniable: 180 ms in the gateway, 90 ms of Lambda Init on cold starts, 40 ms in DynamoDB, and 2,400 ms in the fraud call.
The fix had two parts. Short term: they wrapped the fraud call with a 1.2-second timeout and a fallback to “review later” for high-value carts, moving the scoring off the synchronous path. Medium term: they made the fraud call asynchronous — the Lambda writes the order, publishes to SNS with active tracing, and a second function scores it, with the trace following through AWSTraceHeader so the async chain stays one trace. They also added a sampling rule (/checkout*, reservoir 10, rate 1.0) so every checkout is traced while the chatty /products reads sample at 2%, and turned on Insights on a checkout group so the next fraud-API brownout opens an insight and pages via EventBridge before a customer notices. p99 dropped from 3.1 s to 640 ms, and the next incident started with a trace, not a guess.
Advantages and disadvantages
| Advantages | Disadvantages / costs |
|---|---|
| Pinpoints where latency and faults live, per request | Requires instrumentation on every hop to be complete |
| Service map gives instant system health at a glance | An uninstrumented hop becomes a silent black hole |
| Ties trace → log → metric via ServiceLens | Extra moving parts: daemon/collector, IAM, sampling |
| Sampling controls cost while keeping signal | Mis-set sampling loses the trace you needed, or over-bills |
| Native, low-effort on Lambda/API GW/App Runner | HTTP APIs (v2) have no native X-Ray; SDK overhead is non-zero |
| Annotations make traces searchable by business field | Annotation vs metadata confusion breaks searchability |
| Insights auto-detects anomalies and estimates impact | Insights/analytics scanning adds cost at high volume |
| OTel/ADOT gives a vendor-neutral, multi-backend path | Two overlapping stacks (SDK/daemon vs OTel/ADOT) to reason about |
Tracing earns its keep the moment a request crosses more than one service and latency becomes composed. On a single monolithic function with no downstream calls, metrics and logs may be enough; the instant there is a second hop whose contribution moves week to week, tracing is the only tool that answers “which hop” without guessing.
Hands-on lab
You will enable X-Ray on a real API Gateway (REST) → Lambda → DynamoDB app, add a custom subsegment and annotations, view the service map, filter traces by an annotation, and add a sampling rule. Region ap-south-1 (Mumbai). ⚠️ Cost note: X-Ray’s free tier covers 100,000 traces recorded and 1,000,000 retrieved/scanned per month; a lab of a few hundred traces is effectively free. DynamoDB on-demand and Lambda/API GW free tiers cover the rest. Tear down at the end regardless.
Step 0 — Prerequisites
aws sts get-caller-identity --query Account --output text
export AWS_REGION=ap-south-1
export ACCOUNT_ID=$(aws sts get-caller-identity --query Account --output text)
Step 1 — Create the DynamoDB table
aws dynamodb create-table \
  --table-name Orders \
  --attribute-definitions AttributeName=order_id,AttributeType=S \
  --key-schema AttributeName=order_id,KeyType=HASH \
  --billing-mode PAY_PER_REQUEST \
  --region "$AWS_REGION"
Expected: table status transitions CREATING → ACTIVE within ~10 seconds (aws dynamodb describe-table --table-name Orders --query 'Table.TableStatus').
Step 2 — Execution role with X-Ray write permission
cat > trust.json <<'EOF'
{ "Version":"2012-10-17","Statement":[{"Effect":"Allow",
  "Principal":{"Service":"lambda.amazonaws.com"},"Action":"sts:AssumeRole"}]}
EOF

aws iam create-role --role-name checkout-fn-role \
  --assume-role-policy-document file://trust.json

# Logs + X-Ray write + DynamoDB
aws iam attach-role-policy --role-name checkout-fn-role \
  --policy-arn arn:aws:iam::aws:policy/service-role/AWSLambdaBasicExecutionRole
aws iam attach-role-policy --role-name checkout-fn-role \
  --policy-arn arn:aws:iam::aws:policy/AWSXRayDaemonWriteAccess
aws iam put-role-policy --role-name checkout-fn-role --policy-name ddb-put \
  --policy-document '{"Version":"2012-10-17","Statement":[{"Effect":"Allow",
    "Action":"dynamodb:PutItem","Resource":"arn:aws:dynamodb:'"$AWS_REGION"':'"$ACCOUNT_ID"':table/Orders"}]}'
AWSXRayDaemonWriteAccess is the line that makes traces appear. Without it the code runs and DynamoDB is written, but nothing reaches X-Ray.
Step 3 — The instrumented function
The X-Ray SDK is bundled in a layer or packaged; here we patch boto3 and add a manual subsegment + annotations.
# checkout_fn.py
import json, os, boto3
from aws_xray_sdk.core import xray_recorder, patch_all

patch_all()  # wraps boto3 so DynamoDB calls become subsegments
ddb = boto3.client("dynamodb")
TABLE = os.environ.get("TABLE", "Orders")

def handler(event, context):
    body = json.loads(event.get("body") or "{}")
    order_id = body.get("order_id", "unknown")
    customer_id = body.get("customer_id", "anon")
    cart_total = int(body.get("cart_total", 0))

    seg = xray_recorder.current_segment()
    # Indexed, filterable:
    xray_recorder.put_annotation("customer_id", customer_id)
    xray_recorder.put_annotation("cart_total", cart_total)
    # Not indexed, just context:
    xray_recorder.put_metadata("request_body", body, "app")

    # Manual subsegment around a unit of work you want to time
    subseg = xray_recorder.begin_subsegment("persist_order")
    ddb.put_item(TableName=TABLE, Item={
        "order_id": {"S": order_id},
        "customer_id": {"S": customer_id},
        "cart_total": {"N": str(cart_total)}})
    xray_recorder.end_subsegment()

    return {"statusCode": 200, "body": json.dumps({"ok": True, "order_id": order_id})}
Package and create the function with active tracing on:
zip function.zip checkout_fn.py   # (bundle aws_xray_sdk too, or use a layer)

aws lambda create-function --function-name checkout-fn \
  --runtime python3.12 --handler checkout_fn.handler \
  --role arn:aws:iam::$ACCOUNT_ID:role/checkout-fn-role \
  --zip-file fileb://function.zip \
  --environment 'Variables={TABLE=Orders}' \
  --tracing-config Mode=Active \
  --region "$AWS_REGION"
--tracing-config Mode=Active is the switch. To flip it on an existing function:
aws lambda update-function-configuration \
  --function-name checkout-fn --tracing-config Mode=Active
Step 4 — API Gateway (REST) with tracing on the stage
API_ID=$(aws apigateway create-rest-api --name checkout-api \
  --query id --output text)
ROOT_ID=$(aws apigateway get-resources --rest-api-id $API_ID \
  --query 'items[0].id' --output text)
RES_ID=$(aws apigateway create-resource --rest-api-id $API_ID \
  --parent-id $ROOT_ID --path-part checkout --query id --output text)

aws apigateway put-method --rest-api-id $API_ID --resource-id $RES_ID \
  --http-method POST --authorization-type NONE
aws apigateway put-integration --rest-api-id $API_ID --resource-id $RES_ID \
  --http-method POST --type AWS_PROXY --integration-http-method POST \
  --uri arn:aws:apigateway:$AWS_REGION:lambda:path/2015-03-31/functions/arn:aws:lambda:$AWS_REGION:$ACCOUNT_ID:function:checkout-fn/invocations

aws lambda add-permission --function-name checkout-fn \
  --statement-id apigw --action lambda:InvokeFunction \
  --principal apigateway.amazonaws.com \
  --source-arn "arn:aws:execute-api:$AWS_REGION:$ACCOUNT_ID:$API_ID/*/POST/checkout"

# Deploy the stage WITH X-Ray tracing enabled
aws apigateway create-deployment --rest-api-id $API_ID \
  --stage-name prod --tracing-enabled
Verify the stage carries tracing:
aws apigateway get-stage --rest-api-id $API_ID --stage-name prod \
  --query 'tracingEnabled'
# Expected: true
Step 5 — Generate traffic
URL="https://$API_ID.execute-api.$AWS_REGION.amazonaws.com/prod/checkout"
for i in $(seq 1 20); do
  curl -s -XPOST "$URL" -H 'content-type: application/json' \
    -d "{\"order_id\":\"o-$i\",\"customer_id\":\"A123\",\"cart_total\":$((RANDOM%900+100))}" \
    -o /dev/null -w "%{http_code} " ; done; echo
# Expected: a line of 200s
Note the response header on one call to see propagation:
curl -si -XPOST "$URL" -d '{"order_id":"hdr","customer_id":"A123","cart_total":250}' \
  | grep -i x-amzn-trace-id
# Expected: X-Amzn-Trace-Id: Root=1-...;Sampled=1
Step 6 — Read the service map and traces from the CLI
START=$(date -u -v-15M +%s 2>/dev/null || date -u -d '15 min ago' +%s)
END=$(date -u +%s)

# The service graph (nodes + edges + stats)
aws xray get-service-graph --start-time $START --end-time $END \
  --query 'Services[].{name:Name,type:Type,ok:SummaryStatistics.OkCount,fault:SummaryStatistics.FaultStatistics.TotalCount}' \
  --output table

# Trace summaries filtered by your annotation
aws xray get-trace-summaries --start-time $START --end-time $END \
  --filter-expression 'annotation.customer_id = "A123"' \
  --query 'TraceSummaries[].{id:Id,dur:Duration,ok:HasFault}' --output table

# Pull one full trace document
TID=$(aws xray get-trace-summaries --start-time $START --end-time $END \
  --filter-expression 'annotation.customer_id = "A123"' \
  --query 'TraceSummaries[0].Id' --output text)
aws xray batch-get-traces --trace-ids $TID \
  --query 'Traces[0].Segments[].Document' --output text | head -c 800
Expected: get-service-graph lists nodes for checkout-api (API Gateway), checkout-fn (Lambda), and the Orders DynamoDB table; get-trace-summaries returns your 20-ish traces; the segment document shows your persist_order subsegment and the customer_id / cart_total annotations. In the console, CloudWatch → X-Ray traces → Service map draws the same three-node graph.
Step 7 — Add a sampling rule
Keep every checkout, sample nothing on a fictional health path:
cat > checkout-rule.json <<'EOF'
{ "SamplingRule": {
    "RuleName": "checkout-all", "ResourceARN": "*", "Priority": 100,
    "FixedRate": 1.0, "ReservoirSize": 10,
    "ServiceName": "*", "ServiceType": "*", "Host": "*",
    "HTTPMethod": "POST", "URLPath": "/checkout*", "Version": 1 } }
EOF
aws xray create-sampling-rule --cli-input-json file://checkout-rule.json

aws xray get-sampling-rules \
  --query 'SamplingRuleRecords[].SamplingRule.{name:RuleName,rate:FixedRate,res:ReservoirSize,path:URLPath,prio:Priority}' \
  --output table
Expected: the new checkout-all rule appears alongside the built-in Default rule (rate 0.05, reservoir 1, priority 10000).
Step 8 — (Optional) A group + Insights
aws xray create-group --group-name checkout \
  --filter-expression 'service("checkout-fn")' \
  --insights-configuration InsightsEnabled=true,NotificationsEnabled=true
aws xray get-groups --query 'Groups[].{name:GroupName,filter:FilterExpression}' --output table
Step 9 — Teardown ⚠️
aws xray delete-group --group-name checkout 2>/dev/null
aws xray delete-sampling-rule --rule-name checkout-all
aws apigateway delete-rest-api --rest-api-id $API_ID
aws lambda delete-function --function-name checkout-fn
aws iam delete-role-policy --role-name checkout-fn-role --policy-name ddb-put
aws iam detach-role-policy --role-name checkout-fn-role --policy-arn arn:aws:iam::aws:policy/service-role/AWSLambdaBasicExecutionRole
aws iam detach-role-policy --role-name checkout-fn-role --policy-arn arn:aws:iam::aws:policy/AWSXRayDaemonWriteAccess
aws iam delete-role --role-name checkout-fn-role
aws dynamodb delete-table --table-name Orders
Trace data ages out on its own (30-day retention); nothing keeps billing after teardown.
The same, in Terraform
resource "aws_dynamodb_table" "orders" {
  name         = "Orders"
  billing_mode = "PAY_PER_REQUEST"
  hash_key     = "order_id"
  attribute { name = "order_id"; type = "S" }
}

resource "aws_iam_role" "fn" {
  name = "checkout-fn-role"
  assume_role_policy = jsonencode({ Version = "2012-10-17", Statement = [{
    Effect = "Allow", Principal = { Service = "lambda.amazonaws.com" },
    Action = "sts:AssumeRole" }] })
}
resource "aws_iam_role_policy_attachment" "logs" {
  role = aws_iam_role.fn.name
  policy_arn = "arn:aws:iam::aws:policy/service-role/AWSLambdaBasicExecutionRole"
}
resource "aws_iam_role_policy_attachment" "xray" {
  role = aws_iam_role.fn.name
  policy_arn = "arn:aws:iam::aws:policy/AWSXRayDaemonWriteAccess"  # the line that matters
}

resource "aws_lambda_function" "checkout" {
  function_name = "checkout-fn"
  role          = aws_iam_role.fn.arn
  runtime       = "python3.12"
  handler       = "checkout_fn.handler"
  filename      = "function.zip"
  environment { variables = { TABLE = aws_dynamodb_table.orders.name } }
  tracing_config { mode = "Active" }   # active tracing
}

resource "aws_api_gateway_rest_api" "api" { name = "checkout-api" }

resource "aws_api_gateway_stage" "prod" {
  rest_api_id   = aws_api_gateway_rest_api.api.id
  deployment_id = aws_api_gateway_deployment.d.id
  stage_name    = "prod"
  xray_tracing_enabled = true          # stage tracing
}

resource "aws_xray_sampling_rule" "checkout_all" {
  rule_name      = "checkout-all"
  priority       = 100
  version        = 1
  reservoir_size = 10
  fixed_rate     = 1.0
  service_name   = "*"
  service_type   = "*"
  host           = "*"
  http_method    = "POST"
  url_path       = "/checkout*"
  resource_arn   = "*"
}

resource "aws_xray_group" "checkout" {
  group_name        = "checkout"
  filter_expression = "service(\"checkout-fn\")"
  insights_configuration {
    insights_enabled       = true
    notifications_enabled  = true
  }
}
Common mistakes & troubleshooting
This is the section you keep open. First the structured playbook, then a reference table, then the two nastiest failures in prose.
| # | Symptom | Root cause | Confirm (exact command / console path) | Fix |
|---|---|---|---|---|
| 1 | No traces at all for a Lambda | Active tracing off | aws lambda get-function-configuration --function-name F --query TracingConfig.Mode → PassThrough |
Set --tracing-config Mode=Active |
| 2 | No traces, code runs fine | Role missing X-Ray write perms | CloudWatch Logs shows AccessDenied on PutTraceSegments |
Attach AWSXRayDaemonWriteAccess to the exec/task/node role |
| 3 | Some requests never traced | Sampling excluded them | aws xray get-sampling-rules; check rule rate/reservoir + priority |
Add a rule (rate 1.0) for the path; lower its priority number |
| 4 | No traces from API Gateway | It’s an HTTP API (v2), not REST | Console: API type is “HTTP” | Use a REST API for native X-Ray, or trace at Lambda; front HTTP API differently |
| 5 | API GW not tracing | Stage tracingEnabled=false |
aws apigateway get-stage ... --query tracingEnabled → false |
Redeploy with --tracing-enabled / xray_tracing_enabled=true |
| 6 | Service map has a black hole (a hop is missing) | That hop isn’t instrumented | Map node absent though traffic clearly flows through it | Instrument that service (SDK/OTel) so it emits a segment |
| 7 | DynamoDB/S3 subsegment missing | SDK client not patched | Segment JSON has no aws-namespace subsegment |
patch_all() / captureAWSv3Client / xray.AWS(client) |
| 8 | ECS/EKS app: segments generated, none arrive | Daemon/collector not reachable | App logs: UDP send to 127.0.0.1:2000 failing |
Run daemon sidecar/DaemonSet; set AWS_XRAY_DAEMON_ADDRESS |
| 9 | Can’t filter traces by a field I added | Stored as metadata, not annotation | Field appears under metadata, not annotations, in segment JSON |
Use put_annotation; keys alphanumeric+underscore |
| 10 | X-Ray bill jumped | Sampling too loose (recording ~everything) | Cost Explorer X-Ray “Traces Recorded”; check rules for rate 1.0 on chatty paths | Lower FixedRate/reservoir on high-volume, low-value paths |
| 11 | First call looks “slow” on the trace | Reading cold-start Init as handler latency |
Expand the Initialization subsegment in the timeline | It’s a cold start; use provisioned concurrency, not more memory |
| 12 | Two separate traces across a queue | Trace context not propagated over SNS/SQS | Consumer trace has a new Root; no AWSTraceHeader read |
Enable SNS active tracing; read + continue AWSTraceHeader in the consumer |
| 13 | Segment rejected/ not showing |
Segment timestamp outside valid window | Daemon logs: “segment rejected” | Fix host clock (NTP); don’t backfill old timestamps |
| 14 | Annotation filter returns nothing | Wrong type or quoting in the expression | get-trace-summaries --filter-expression 'annotation.cart_total >= 500' |
Numbers unquoted, strings quoted; check key spelling |
| 15 | ADOT app: no traces to X-Ray | Collector missing the X-Ray/awsxray exporter or perms |
Collector logs; pipeline YAML exporters |
Add awsxray exporter; give the task role write perms |
| 16 | Map shows service but no downstream | Only the entry hop is instrumented | Only one node has edges | Propagate the header + instrument downstream hops |
X-Ray / tracing error & status reference
| Signal | Where you see it | Meaning | Fix |
|---|---|---|---|
AccessDeniedException on xray:PutTraceSegments |
App/daemon logs | Role can’t write to X-Ray | Attach AWSXRayDaemonWriteAccess |
TracingConfig.Mode = PassThrough |
get-function-configuration |
Lambda active tracing off | Set Mode=Active |
Sampled=0 in X-Amzn-Trace-Id |
Response header | This request was not sampled | Loosen the matching sampling rule |
tracingEnabled: false |
get-stage |
API GW stage not tracing | Redeploy with tracing enabled |
| “segment rejected” | Daemon logs | Timestamp/format invalid | Fix clock; validate segment JSON |
Missing aws subsegment |
Segment document | Client not patched | patch_all() / capture the client |
| Node grey/hollow on map | Service map | No data in window / not instrumented | Instrument the hop; widen time range |
ThrottlingException from X-Ray API |
Read tooling | Too many GetTraceSummaries/BatchGetTraces |
Back off; batch trace IDs |
Empty get-service-graph |
CLI | Wrong time window or region | Match --start-time/--end-time; correct --region |
| Insight not created | Insights | Insights not enabled on the group | Set InsightsEnabled=true on the group |
Decision table: what a missing/odd trace usually means
| If you see… | It’s probably… | Do this |
|---|---|---|
| Zero traces anywhere | Active tracing off or IAM write denied | Check TracingConfig + AWSXRayDaemonWriteAccess |
| Traces exist, but not for one path | Sampling rule excludes it | Add a 100% rule for that path, lower priority number |
| Map missing one service | That hop uninstrumented | Instrument it; check header propagation |
| Downstream call missing inside a segment | SDK not patched | patch_all() / capture the client |
| A field you can’t filter on | It’s metadata | Move to put_annotation |
| Sudden cost spike | Sampling too loose | Tighten FixedRate/reservoir on chatty paths |
| Two traces where you expected one | Broken async propagation | Continue AWSTraceHeader across SNS/SQS |
The two nastiest, in prose
The black hole in the service map. You open the map mid-incident and the checkout Lambda calls… nothing. But you know it calls DynamoDB and a payment API. The map is not lying — it draws exactly what was reported, and nothing reported those calls as subsegments. Ninety percent of the time the cause is a missing patch_all() (or captureAWSv3Client/xray.AWS()), so the AWS SDK client runs un-instrumented and no aws-namespace subsegment is generated; the other ten percent is an external hop that is a separate service which itself is not instrumented and never propagated the header. Confirm by pulling the raw segment (aws xray batch-get-traces) and checking for subsegments — if the array is empty or missing the call, it is an instrumentation gap, not an X-Ray gap. The fix is code, not configuration: patch the client, or in OTel terms make sure the auto-instrumentation for that library is loaded.
The sampling bill surprise. Someone “just wanted to see everything” and set a rule with FixedRate = 1.0 matching *. On a service doing 5,000 req/s that is up to 5,000 traces/second recorded — hundreds of millions a day — and X-Ray bills per trace recorded. The tell is a Cost Explorer line for X-Ray “Traces Recorded” that tracks your traffic linearly. The fix is discipline: reserve rate 1.0 for low-volume, high-value paths (checkout, payments), sample chatty read paths at 1–5%, and set rate 0.0 on health checks and other pure noise. The default rule’s 1/s + 5% exists precisely because “trace everything” does not scale; your custom rules should sharpen that, not remove it.
Best practices
- Trace at the edge, decide once. Turn on tracing at the entry point (API Gateway/ALB/front Lambda) so the sampling decision and trace ID are set once and honoured downstream via
Sampled. - Instrument every hop or expect a black hole. A service map is only as complete as its least-instrumented service; make tracing part of the service template, not an afterthought.
- Annotate the few fields you search on; metadata everything else. IDs and low-cardinality buckets (customer, tenant, order, feature flag) go in annotations; payloads and config go in metadata.
- Sample by value, not uniformly. 100% for checkout/payments, single-digit percent for chatty reads, 0% for health checks. Keep the default rule as the backstop.
- Patch your clients.
patch_all()/ capture the AWS SDK and HTTP clients so downstream calls always become subsegments — the number-one cause of a broken map. - Read Lambda’s Init subsegment as cold start, not handler latency; tune it with provisioned concurrency, not memory guesses.
- Prefer OpenTelemetry/ADOT for new work. It is the strategic direction and gives you one pipeline to X-Ray and CloudWatch (and beyond); keep existing X-Ray SDK apps as-is.
- Use groups + Insights on your critical flows so anomalies page you via EventBridge instead of a customer noticing first.
- Wire ServiceLens into your runbooks — go trace → log line → metric in the console, not by correlating timestamps across five log groups.
- Give the write role least privilege:
AWSXRayDaemonWriteAccesson the compute,AWSXRayReadOnlyAccessfor humans/dashboards, full only for the CI that manages groups and rules. - Alarm on group fault rate, not just per-service metrics, so a regression anywhere in the flow trips one alarm.
- Keep segment names stable — the map groups by name, so a name that includes a request ID shatters the map into thousands of nodes.
Security notes
Tracing data is operational metadata, but it can leak sensitive fields if you annotate the wrong thing, and the write/read permissions must be scoped.
| Concern | Guidance |
|---|---|
| Least-privilege write | Compute gets AWSXRayDaemonWriteAccess (Put segments/telemetry, Get sampling) — nothing else |
| Least-privilege read | Humans/dashboards get AWSXRayReadOnlyAccess; only rule/group managers get write to those |
| No PII in annotations | Annotations are broadly readable and searchable — never put card numbers, tokens, emails, full names |
| Metadata is not secret | Metadata is visible in the trace too; don’t dump raw request bodies with secrets |
| Encryption at rest | X-Ray encrypts traces with an AWS-owned key by default; set a KMS CMK for customer-managed encryption |
| Cross-account observability | Use a central monitoring account (CloudWatch cross-account) rather than broad xray:BatchGetTraces grants |
| Resource policy for SNS/EventBridge | Sending trace data from SNS/EventBridge needs an X-Ray resource policy (PutResourcePolicy) — scope it |
| Sampling as a control | Don’t let a wide-open rule record sensitive high-detail traces at 100% indefinitely |
Key IAM actions, grouped by what they let a principal do:
| IAM action | Path | Grants |
|---|---|---|
xray:PutTraceSegments |
Write | Upload segment documents (the core write) |
xray:PutTelemetryRecords |
Write | Daemon health/telemetry |
xray:GetSamplingRules |
Write path | Fetch effective sampling rules |
xray:GetSamplingTargets |
Write path | Report usage, get reservoir allocation |
xray:BatchGetTraces |
Read | Pull full trace documents |
xray:GetTraceSummaries |
Read | Search traces by filter expression |
xray:GetServiceGraph |
Read | The service map data |
xray:GetGroups / GetGroup |
Read | List/read groups |
xray:GetInsightSummaries |
Read | Read Insights anomalies |
xray:CreateGroup / UpdateGroup |
Manage | Manage groups |
xray:CreateSamplingRule / UpdateSamplingRule |
Manage | Manage sampling rules |
xray:PutResourcePolicy |
Manage | Allow SNS/EventBridge to send trace data |
Cost & sizing
X-Ray pricing has three meters plus a free tier. The lever that controls all of them is sampling.
| Meter | What it counts | List price (verify in console) | Free tier / month |
|---|---|---|---|
| Traces recorded | Each trace stored | ~$5.00 per 1M traces ($0.000005 each) | First 100,000 recorded |
| Traces retrieved | Trace docs pulled (BatchGetTraces, details view) |
~$0.50 per 1M retrieved | Part of the 1M retrieved+scanned |
| Traces scanned | Trace summaries scanned by filters/Insights | ~$0.50 per 1M scanned | First 1,000,000 retrieved + scanned combined |
What drives the bill and how to right-size it:
| Cost driver | Effect | Lever |
|---|---|---|
| Request volume × sampling rate | Linear on traces recorded | Lower FixedRate/reservoir on chatty paths |
| Recording health checks / noise | Pure waste | FixedRate = 0.0 on those paths |
| Aggressive dashboards / analytics | Raises traces scanned | Narrow time windows; use groups |
| Deep, frequent trace-detail viewing | Raises traces retrieved | Retrieve by specific trace ID, not broadly |
| Insights on many groups | Extra scanning | Enable on critical flows only |
Rough figures: a service at 100 req/s with the default rule (~1/s + 5%) records on the order of ~6 traces/s ≈ 500K/day. At ~$5/1M that is a few USD (a few hundred INR) per day — modest. The same service recording 100% would store ~8.6M traces/day, ~$43/day (~₹3,600/day) — the difference between “cheap observability” and “why is X-Ray on the cost report” is entirely the sampling rule. Newer CloudWatch/OTel-based transaction search prices on ingested spans/GB instead of per-trace; if you adopt it, model cost on span ingestion, and still sample.
Interview & exam questions
1. What is the difference between a segment and a subsegment? A segment is one service’s slice of a trace (the work API Gateway did, then the Lambda did); a subsegment is a unit of work inside a segment — one downstream call (DynamoDB, an HTTP API) or a block of code you chose to time. Subsegments nest, making a trace a tree. (DVA-C02, SOA-C02)
2. How is the sampling decision propagated across services?
It is made once at the first instrumented hop and carried in the Sampled field of the X-Amzn-Trace-Id header. Sampled=1 means every downstream service records its segment; Sampled=0 means they skip it. This keeps a trace all-or-nothing. (SOA-C02)
3. When would you use an annotation instead of metadata?
Use an annotation when you need to filter/search traces by that field (e.g. annotation.customer_id = "A123") — annotations are indexed, capped at 50 per trace, and limited to string/number/boolean. Use metadata for rich, un-indexed context you only view. (DVA-C02)
4. The default sampling rule — what is it, and why does it exist? Record the first 1 request per second (reservoir) plus 5% of everything above that. It guarantees you see some traces even on a quiet service while capping cost on a busy one, so “trace everything” cannot accidentally blow up the bill. (SOA-C02)
5. A service clearly called by your app is missing from the service map. Why?
That hop is not instrumented, so it never emitted a segment — most often the AWS SDK client was never patched (patch_all()), or an external service didn’t propagate the header. X-Ray draws only what is reported. (DVA-C02, SAP-C02)
6. What does Lambda active tracing add, and what are the three subsegments? It makes Lambda emit a service segment plus a function segment split into Initialization (cold-start init code), Invocation (your handler + downstream), and Overhead. A tall Initialization on the first call is a cold start, not a slow handler. (DVA-C02)
7. X-Ray daemon vs ADOT Collector — which and why? The daemon receives X-Ray segments over UDP :2000 and exports only to X-Ray; the ADOT Collector receives OpenTelemetry and exports to X-Ray and CloudWatch/Prometheus/others. ADOT/OTel is AWS’s strategic direction — pick it for new/multi-backend work; keep the daemon for existing X-Ray SDK apps. (SAP-C02)
8. How do you keep a trace intact across an SQS queue?
Propagate the AWSTraceHeader message system attribute: the producer (or SNS active tracing) sets it, and the consumer reads it and continues that trace instead of starting a new one. Otherwise producer and consumer look like unrelated traces. (SOA-C02)
9. What does ServiceLens give you over the raw X-Ray map? ServiceLens fuses the X-Ray service map with CloudWatch metrics and Logs, so each node links to its metrics and log lines — you jump trace → log → metric for the same request and window instead of correlating by timestamp. (SOA-C02)
10. Your X-Ray bill spiked. First thing to check?
Sampling rules. A rule with FixedRate = 1.0 on a high-volume path records a trace per request; check Cost Explorer’s “Traces Recorded” and tighten rate/reservoir on chatty, low-value paths (0% on health checks). (SAP-C02)
11. Why don’t HTTP APIs show up with native X-Ray like REST APIs? API Gateway REST APIs support X-Ray active tracing per stage; HTTP APIs (v2) do not have native X-Ray. Trace at the Lambda instead, or use a REST API where you need gateway-level tracing. (DVA-C02)
12. What is X-Ray Insights and how does it notify you? Insights does anomaly detection on a group’s fault rate, opening an insight with impacted nodes, root-cause node, and an estimate of affected requests. It can emit events to EventBridge so an anomaly on the map can page you. (SOA-C02)
Quick check
- In
X-Amzn-Trace-Id, which field tells downstream services whether to record the trace, and who sets it? - You added
order_idto your traces but can’t filter on it. What did you almost certainly use, and what should you have used? - Write a sampling rule intent that records every POST to
/checkoutbut nothing on/health. What two priorities and rates? - A DynamoDB call is missing as a subsegment inside an otherwise-present Lambda segment. One-line cause and fix?
- What are Lambda active tracing’s three subsegments, and which one is the cold start?
Answers
Sampled(0 or 1); it is set once by the first instrumented hop (e.g. API Gateway) and honoured by everyone downstream.- You used metadata (not indexed); you should have used an annotation (
put_annotation("order_id", ...)), which is indexed and filterable. /checkout*POST → reservoir/rate 1.0 at a low priority number (e.g. 100);/health→ rate 0.0 at an even lower priority number (e.g. 90) so it is evaluated first. The default rule stays at 10000.- The AWS SDK client wasn’t patched — call
patch_all()(orcaptureAWSv3Client/xray.AWS()) so the call becomes anaws-namespace subsegment. - Initialization (the cold start), Invocation (your handler + downstream), and Overhead.
Glossary
| Term | Definition |
|---|---|
| Trace | All segments sharing one trace ID, assembled into one end-to-end request view |
| Segment | One service’s timed contribution to a trace, with HTTP/aws blocks and error/fault/throttle flags |
| Subsegment | A timed unit inside a segment — a downstream call or a code block |
| Trace ID | The 1-{epoch}-{24 hex} correlation key that binds a trace; retained 30 days |
X-Amzn-Trace-Id |
The HTTP header carrying Root, Parent, Sampled (and ALB’s Self) across hops |
| Annotation | Indexed, filterable key-value (string/number/bool), ≤50 per trace |
| Metadata | Arbitrary, namespaced JSON stored with a segment but not indexed |
| Service map | Aggregated graph: nodes = services, edges = calls, with latency + error/fault/throttle rates |
| Trace map | The same graph for a single request |
| Sampling rule | Reservoir (traces/sec floor) + fixed rate (% of the rest), matched by service/host/method/path/ARN |
| Reservoir | The guaranteed minimum traces per second a rule records |
| X-Ray SDK | Library that patches clients to emit segments/subsegments and lets you add annotations |
| X-Ray daemon | Local agent receiving segments on UDP :2000 and uploading them to X-Ray |
| ADOT | AWS Distro for OpenTelemetry — the OTel collector/SDK path, AWS’s strategic direction |
| ServiceLens | CloudWatch view fusing the X-Ray map with metrics and Logs |
| Insights | Anomaly detection on a group’s health, with impact analysis and EventBridge notifications |
| Group | A named filter expression scoping the map, metrics and Insights |
Next steps
- Alarm on the metrics that send you to a trace — build them in Amazon CloudWatch Hands-On: Metrics, Alarms, Dashboards & SNS Notifications.
- Trace containers, not just serverless, and correlate with cluster telemetry in Container Insights: Monitoring EKS & ECS Metrics, Logs & Performance.
- Turn a red Lambda node on the map into a root cause with AWS Lambda Errors, Timeouts & Cold Starts: The Troubleshooting Playbook.
- Instrument the front door you traced here end to end in Amazon API Gateway Hands-On: Building REST and HTTP APIs.