A connection is timing out. The app team swears “nothing changed,” the security team swears “the security group is fine,” and the network team swears “routing is correct.” Everyone is looking at a different config screen and nobody is looking at the packet. VPC Flow Logs are the one place that records what actually happened to that packet — was it allowed, was it denied, or did it never arrive at all — and reading them correctly is the difference between a five-minute fix and a three-team, three-hour bridge call.
A Flow Log is a per-interface record of the IP traffic that crossed an elastic network interface (ENI): source and destination address, ports, protocol, byte and packet counts, and — the field that ends most arguments — an action of ACCEPT or REJECT. It does not capture packet payloads; it is a metadata ledger of flows, aggregated over a time window, delivered to CloudWatch Logs, Amazon S3, or Kinesis Data Firehose. Enabled at the VPC, subnet, or ENI level, it turns “the connection is broken somewhere” into “the security group denied inbound TCP 443 from 203.0.113.10 at 02:14, here is the exact record.”
This article is a troubleshooting playbook, not a feature tour. You will learn the record format field by field — the fourteen default version-2 fields in order and the high-value custom fields (pkt-srcaddr, flow-direction, traffic-path, tcp-flags) that reveal the real client behind a NAT gateway or load balancer. You will learn the crucial gaps — the traffic Flow Logs deliberately do not record (IMDS, the Amazon DNS resolver, DHCP) — so you stop chasing a REJECT that will never appear. You will learn to query with CloudWatch Logs Insights and with Athena over S3, and — the heart of it — the verdict rule that maps a record to a blocking layer: a REJECT at the ENI means a security group denied it; an ACCEPT inbound with a REJECT outbound means a stateless NACL dropped the return; and no record at all means the packet never reached the ENI, so you look upstream at routing. This maps to the networking domains of SAA-C03, SOA-C02, and ANS-C01.
What problem this solves
When a TCP connection fails inside a VPC, the failure is silent. A security group or a network ACL that denies a packet does not send back a “connection refused” — it drops the packet on the floor, and the client sits there until it times out. Silence is the cruellest failure mode because it looks identical whether the security group blocked you, a NACL blocked the return, a route table sent the packet into a black hole, or the destination host is simply down. Four completely different root causes, one identical symptom: a spinner that never resolves.
Without Flow Logs you troubleshoot this by inspection and guesswork: you open the security group and read the rules, you open the NACL and read the rules, you open the route table, you SSH to the box (if you can reach it) and run tcpdump, and you argue about which config is wrong. Every one of those configs can look correct while the packet still dies, because the bug is often the interaction between them — a stateful SG that allows the request but a stateless NACL that forgot the ephemeral-port return, or a rule that is perfect but attached to the wrong ENI.
Flow Logs collapse that guesswork into evidence. They tell you three things no config screen can: whether the packet reached the ENI at all (if there is no record, the problem is upstream of the ENI — routing, IGW, NAT, peering — not a firewall), which direction was allowed or denied (pairing the inbound and outbound records isolates a stateless-NACL asymmetry), and the real source address behind a NAT or load balancer (the pkt-srcaddr custom field). Everyone who runs anything in a VPC hits this: the platform team that owns the NACLs, the app team that owns the security groups, the security team that must prove what was blocked, and the on-call engineer who just wants the connection to work. The mechanism you learn here is layer localisation: turn a silent, multi-team timeout into a single record that names the guilty hop.
Learning objectives
By the end of this article you can:
- Enable a Flow Log at the right level (VPC, subnet, or ENI) for the job, and explain what happens when several overlap.
- Read the version-2 default record field by field, in order, and decode
protocolnumbers,tcp-flagsbitmasks, andlog-statusvalues. - Design a custom log format that captures the high-value fields —
pkt-srcaddr,pkt-dstaddr,flow-direction,traffic-path,tcp-flags,subnet-id,instance-id— and explain why each one shortens an investigation. - Name the traffic Flow Logs never record (IMDS, Amazon DNS, DHCP, Windows license, reserved addresses) so you stop chasing ghosts.
- Choose a destination — CloudWatch Logs vs S3 (with Athena/Parquet) vs Kinesis Data Firehose — on latency, cost, and query needs.
- Write CloudWatch Logs Insights queries for top talkers, REJECT hunting, and by-port analysis, and build an Athena table with partitioning that keeps scan cost down.
- Apply the verdict rule to localise any silent drop to a security group, a NACL, or upstream routing — and confirm it with the exact
awscommand.
Prerequisites & where this fits
You should already understand VPC fundamentals: a VPC is your private network, carved into subnets (public or private), with route tables deciding where a subnet’s traffic goes, an internet gateway (IGW) for public egress and a NAT gateway for private egress. You should know that security groups (SGs) are stateful, allow-only firewalls attached to the ENI, and network ACLs (NACLs) are stateless, ordered allow/deny lists attached to the subnet. You need the AWS CLI configured and permission to read EC2, CloudWatch Logs, S3, and Athena. Cost awareness helps: Flow Logs are billed on data ingested, and Athena on data scanned.
This sits in the Networking / Observability track and is the diagnostic layer beneath everything else. It is the natural companion to the Security Groups vs NACLs deep dive and connectivity-blocking troubleshooting guide — that article teaches the two firewalls; this one teaches you to read the evidence of what they did. It assumes the network you build in Building an AWS VPC from Scratch: Subnets, Route Tables, IGW & a Public/Private Design, and it pairs with Private-Subnet Internet Egress: NAT Gateway vs NAT Instance, Hands-On & Cost because the NAT gateway is exactly where srcaddr stops being the real client. For the audit trail of who changed the security group rather than what the packet did, see AWS CloudTrail and Config: Audit and Compliance at Scale.
Here is who owns which layer, so during an incident you localise the failure and then call the right team:
| Layer | What lives here | Usual owner | Failure class it causes | Flow Log signature |
|---|---|---|---|---|
| Route table / IGW / NAT | Where the packet goes | Network team | Black-holed traffic | No record at the ENI |
| VPC peering / TGW | Cross-VPC path | Network team | Unreachable peer | No record, or REJECT if arrives |
| NACL (subnet) | Stateless allow/deny | Platform / network | Return-path drops | ACCEPT in + REJECT out |
| Security group (ENI) | Stateful allow-only | App / security | Inbound denied | REJECT in at the ENI |
| Host OS / app | Local firewall, listener | App / dev | Refused / reset | ACCEPT + RST, or app-level fail |
| ENI attachment | Which SGs are on which ENI | App / platform | “Right rule, wrong ENI” | REJECT despite a correct-looking SG |
Core concepts
Six mental models make every later diagnosis obvious.
A Flow Log record is an aggregated flow, not a packet. During a capture window (the aggregation interval, 1 or 10 minutes) the service groups traffic by a tuple — interface, source/destination address, source/destination port, protocol — and emits one record per tuple with the summed packets and bytes, plus the earliest start and latest end timestamps and the flags it observed. You never see individual packets or payload; you see “over this window, this flow moved N bytes and was ACCEPTed.”
The action field is the verdict, and it is combined. ACCEPT means the traffic was permitted by the security groups and the network ACLs for that ENI’s path; REJECT means one of them denied it. Crucially, the field does not name which one — that is your job, using the direction and the stateful-vs-stateless behaviour below.
Statefulness shapes what a REJECT means. Security groups are stateful: if an inbound flow is allowed, the return is automatically allowed, so you will never see a REJECT on the return caused solely by the SG. NACLs are stateless: the return traffic must be explicitly allowed on the outbound ephemeral-port range or it is dropped. Therefore an ACCEPT inbound paired with a REJECT outbound on a high ephemeral port is the fingerprint of a NACL, never a security group.
“No record” is itself a diagnosis. Flow Logs capture traffic that reaches the ENI. If a connection attempt produces no record at all, the packet never got to the interface — it was dropped upstream by routing (no route, wrong route table, missing IGW/NAT, un-propagated peering/VPN route). Absence of evidence is, here, evidence of an upstream problem. This is the single most under-used diagnostic in the tool.
Capture level is a lens, not a filter of truth. You can attach a Flow Log to a whole VPC, a subnet, or a single ENI. They do not override each other — each configured log independently captures and delivers, so overlapping logs mean duplicate records and duplicate cost. The ENI level is the sharpest, cheapest lens when you are chasing one host; the VPC level is the blanket for security and compliance.
Some traffic is invisible on purpose. A short, fixed list of flows is never recorded — instance metadata, the Amazon DNS resolver, DHCP, and a few others. If you go hunting for a REJECT on one of those, you will search forever, because the record does not exist and never will.
The vocabulary in one table
| Concept | One-line definition | Where it lives | Why it matters |
|---|---|---|---|
| Flow Log | Per-interface record of IP flows | VPC / subnet / ENI | The evidence ledger |
| ENI | Elastic network interface | Attached to instances, LBs, endpoints | The capture point |
| Flow record | One aggregated tuple per window | In the log destination | The row you read |
| Aggregation interval | Capture window (1 or 10 min) | Flow Log config | Trades latency vs volume |
action |
ACCEPT / REJECT verdict | Every record | Allowed or denied |
log-status |
OK / NODATA / SKIPDATA | Every record | Health of the capture |
srcaddr / dstaddr |
Addresses as seen at the ENI | v2 default | May be a NAT/LB, not the client |
pkt-srcaddr |
Real source before NAT/LB rewrite | v3 custom | The actual client |
flow-direction |
ingress / egress at the ENI | v5 custom | Which way the flow went |
traffic-path |
Egress path taken (IGW/NAT/peering…) | v5 custom | Where egress is routed |
tcp-flags |
Bitmask of TCP flags seen | v3 custom | SYN-only = half-open handshake |
| Capture level | VPC / subnet / ENI scope | Flow Log config | Breadth vs cost |
| Destination | CloudWatch / S3 / Firehose | Flow Log config | Latency, cost, query tool |
What a single record represents
| Aspect | Behaviour | Consequence for troubleshooting |
|---|---|---|
| Granularity | One row per flow tuple per interval | Bursty short flows aggregate into one row |
| Timestamps | start = first packet, end = last (Unix seconds) |
Sub-second timing is lost; use for windows, not latency |
| Counters | packets, bytes summed over the window |
Zero-byte REJECTs are common (SYN dropped) |
| Direction | Encoded by src/dst (v2) or flow-direction (v5) |
Pair inbound+outbound to spot NACL asymmetry |
| Verdict | action = ACCEPT or REJECT |
Combined SG+NACL result, not per-layer |
| Missing rows | Excluded traffic + upstream drops + NODATA | Absence has three distinct meanings |
What Flow Logs capture — and at which level
You attach a Flow Log to one of three resource types. All three capture the same kind of record; they differ only in scope — which ENIs are covered.
| Level | --resource-type |
Scope | Best for | Gotcha |
|---|---|---|---|---|
| VPC | VPC |
Every current and future ENI in the VPC | Security baseline, compliance, “log everything” | Highest volume + cost; includes ENIs you did not create |
| Subnet | Subnet |
Every ENI in that subnet | A tier (web/app/db) or an AZ | Still broad; new ENIs auto-included |
| ENI | NetworkInterface |
One interface | Chasing one instance / endpoint | Manual per ENI; new instances not auto-covered |
Precedence when several apply. They do not override. If you enable a VPC-level log and an ENI-level log that both cover the same interface, each independently captures and delivers — you get two copies of the flow and pay twice. There is no “most specific wins” merge. The practical rule: run one blanket VPC-level log for security/compliance, and add a temporary ENI-level log during an incident only if you need a different format or destination than the blanket one — then delete it in teardown.
The aggregation interval
The maximum aggregation interval controls the capture window and therefore how fast records appear.
| Setting | Value | Delivery latency (typical) | When to use |
|---|---|---|---|
| Default | 600 s (10 min) | Records appear ~several minutes after each 10-min window closes | Steady-state security/compliance logging |
| Fast | 60 s (1 min) | Records appear a few minutes after each 1-min window | Active incident — you want data now |
Two facts that save confusion: records are never real-time — even at 60 s you wait for the window to close plus a delivery delay, so budget roughly 5–10 minutes before a fresh flow shows up. And for interfaces on Nitro-based instances the interval can be effectively shorter, but do not design around that; assume the configured value.
What “traffic type” you capture
--traffic-type |
Captures | Use it when |
|---|---|---|
ALL |
Accepted and rejected flows | Troubleshooting — you must see the REJECTs |
ACCEPT |
Only allowed flows | Traffic analytics, top talkers, cost by flow |
REJECT |
Only denied flows | Security hunting, focused block detection |
For troubleshooting always use ALL. A REJECT-only log seems clever for block-hunting, but it hides the ACCEPT-in / REJECT-out pairing that fingerprints a NACL.
Enabling a Flow Log: the key parameters
Every create-flow-logs call is built from these parameters — the reference you keep beside the CLI:
| Parameter | Purpose | Values / example |
|---|---|---|
--resource-type |
Capture level | VPC / Subnet / NetworkInterface |
--resource-ids |
Resource(s) to log | eni-0abc…, subnet-0abc…, vpc-0abc… |
--traffic-type |
Which verdicts | ALL / ACCEPT / REJECT |
--log-destination-type |
Destination kind | cloud-watch-logs / s3 / kinesis-data-firehose |
--log-destination |
Destination ARN | log-group ARN, bucket ARN, or Firehose ARN |
--deliver-logs-permission-arn |
IAM role (CloudWatch only) | role assumed by the Flow Logs service |
--max-aggregation-interval |
Capture window (seconds) | 60 or 600 |
--log-format |
Custom field set + order | ${srcaddr} ${dstaddr} … tokens |
--destination-options |
S3 format/partitioning | FileFormat, HiveCompatiblePartitions, PerHourPartition |
The record format: version-2 defaults and custom fields
The default format is version 2: fourteen fields, space-delimited, in a fixed order. Memorise the order — when you write an Athena DDL or a Logs Insights parse, the column order must match exactly or every field shifts by one and your data turns to nonsense.
The version-2 default fields, in order
| # | Field | Meaning | Example | Note |
|---|---|---|---|---|
| 1 | version |
Log format version | 2 |
5 if you add v3–v5 fields |
| 2 | account-id |
AWS account of the ENI | 123456789012 |
unknown for some managed ENIs |
| 3 | interface-id |
The ENI that captured it | eni-0abc123def456 |
Your capture point |
| 4 | srcaddr |
Source address at the ENI | 203.0.113.10 |
May be a NAT/LB, not the client |
| 5 | dstaddr |
Destination address at the ENI | 10.0.1.25 |
|
| 6 | srcport |
Source port | 54321 |
Ephemeral for a client |
| 7 | dstport |
Destination port | 443 |
The service port |
| 8 | protocol |
IANA protocol number | 6 |
6=TCP, 17=UDP, 1=ICMP |
| 9 | packets |
Packets in the window | 12 |
0-byte flows still count packets |
| 10 | bytes |
Bytes in the window | 4620 |
|
| 11 | start |
First packet time (Unix s) | 1752460440 |
|
| 12 | end |
Last packet time (Unix s) | 1752460470 |
|
| 13 | action |
ACCEPT / REJECT | REJECT |
The verdict |
| 14 | log-status |
OK / NODATA / SKIPDATA | OK |
Health of the capture |
The high-value custom fields (v3–v5)
The default format is enough for top-talker analytics but not enough for the hardest bugs. A custom format lets you pick any of the available fields; these are the ones that repay their column width in a troubleshooting log.
| Field | Version | What it gives you | Why it shortens an investigation |
|---|---|---|---|
pkt-srcaddr |
v3 | Real source before NAT/LB rewrite | The actual client behind a NAT gateway, ALB, or gateway endpoint |
pkt-dstaddr |
v3 | Real destination before rewrite | The true target behind a load balancer / endpoint |
flow-direction |
v5 | ingress or egress at the ENI |
Pair the two directions to spot NACL asymmetry instantly |
traffic-path |
v5 | Egress path (1–8): IGW, NAT, VGW, peering… | “Is my egress going out the IGW or the NAT?” answered directly |
tcp-flags |
v3 | Bitmask of TCP flags seen | A lone SYN (2) with no SYN-ACK = handshake never completed |
subnet-id |
v3 | Subnet of the ENI | Localise without a second lookup |
instance-id |
v3 | Instance behind the ENI | Skip the ENI→instance mapping step |
vpc-id |
v3 | VPC of the ENI | Multi-VPC log disambiguation |
type |
v3 | IPv4 / IPv6 / EFA |
Confirm which stack the flow used |
region |
v4 | AWS region | Multi-region aggregation |
az-id |
v4 | Availability Zone ID | AZ-scoped analysis |
sublocation-type / sublocation-id |
v4 | Wavelength / Outpost / Local Zone | Edge deployments |
pkt-src-aws-service |
v5 | AWS service name of the source | Is the caller S3, DYNAMODB, CLOUDFRONT…? |
pkt-dst-aws-service |
v5 | AWS service name of the destination | Egress to which AWS service |
reject-reason |
newer | Why a flow was rejected (e.g. BPA) |
Distinguishes some managed rejects |
ecs-* (cluster, task, service…) |
v7 | ECS task/service metadata | Attribute a flow to an ECS task |
A troubleshooting-grade custom format that stays readable:
${version} ${account-id} ${interface-id} ${srcaddr} ${dstaddr} ${srcport} ${dstport} ${protocol} ${packets} ${bytes} ${start} ${end} ${action} ${log-status} ${flow-direction} ${pkt-srcaddr} ${pkt-dstaddr} ${traffic-path} ${tcp-flags} ${subnet-id} ${instance-id}
srcaddr vs pkt-srcaddr: the source behind a rewrite
The single most valuable reason to run a custom format is to see the real endpoint when something in the path rewrites the address. srcaddr/dstaddr are what the ENI sees; pkt-srcaddr/pkt-dstaddr are the original packet’s addresses.
| Path in front of the ENI | srcaddr shows |
pkt-srcaddr shows |
Why it matters |
|---|---|---|---|
| NAT gateway (private → internet) | The NAT gateway’s private IP | The real originating instance | Attribute egress to the actual instance, not the NAT |
| Application/Network Load Balancer | The LB node’s IP | The real client (for some paths) | Find the true source of a blocked/abusive flow |
| Gateway VPC endpoint (S3/DynamoDB) | The endpoint/ENI address | The instance behind it | Confirm which host reached S3 |
| Direct ENI-to-ENI (no rewrite) | The real source | Same as srcaddr |
The two fields match — no NAT in play |
Decoding protocol
The protocol field is the IANA number, not a name — a frequent “why does it say 6?” moment.
| Number | Protocol | Common ports |
|---|---|---|
1 |
ICMP | (ping, unreachable) |
6 |
TCP | 22, 80, 443, 3306, 5432 |
17 |
UDP | 53, 123, 500/4500 |
47 |
GRE | (tunnels) |
50 |
ESP | (IPsec VPN) |
58 |
ICMPv6 | (IPv6 neighbour/ping) |
Decoding tcp-flags
tcp-flags is a bitmask of the flags observed at least once during the window. It is diagnostic gold for handshakes.
| Value | Flags | Interpretation |
|---|---|---|
2 |
SYN | Connection attempt |
18 |
SYN + ACK | Peer accepted (2 + 16) |
1 |
FIN | Graceful close |
4 |
RST | Reset — refused or aborted |
16 |
ACK | Data/ack (with other flags) |
3 |
SYN + FIN | Very short flow (2 + 1) |
19 |
SYN + ACK + FIN | Short completed flow |
The classic read: an ingress record with tcp-flags=2 (SYN only) and action=REJECT means the SYN arrived and was denied — the handshake never got a SYN-ACK back. An ingress SYN ACCEPTed but no corresponding egress SYN-ACK means the app never answered (listener down / host firewall), not a security-group problem.
Decoding traffic-path
traffic-path (v5) is populated for egress flows and answers “which door did my outbound traffic leave through” — the fastest way to catch traffic taking the wrong path (out the IGW when it should hit the NAT, or vice-versa).
| Value | Egress path |
|---|---|
1 |
Through another resource in the same VPC |
2 |
Through an internet gateway or a gateway VPC endpoint |
3 |
Through a virtual private gateway (VGW) |
4 |
Through an intra-region VPC peering connection |
5 |
Through an inter-region VPC peering connection |
6 |
Through a local gateway (Outposts) |
7 |
Through a gateway VPC endpoint (Nitro-based instances) |
8 |
Through an internet gateway (Nitro-based instances) |
Decoding log-status
| Value | Meaning | What to do |
|---|---|---|
OK |
Data logged normally | Nothing — healthy |
NODATA |
No traffic to/from the ENI in the window | The interface was idle — this is not a block; generate traffic |
SKIPDATA |
Some records were skipped (internal constraint) | A capacity gap; occasional SKIPDATA is normal, sustained means volume is too high |
NODATA is the most-misread value in the whole system: engineers see a screen full of NODATA and conclude “logging is broken” or “everything is blocked.” It means neither — it means the ENI simply had no traffic during that window.
The crucial gaps: traffic Flow Logs never record
Before you spend an hour hunting a REJECT that does not exist, memorise the exclusion list. These flows are not captured at any level, so their absence tells you nothing about firewalls.
| Excluded traffic | Address / port | Why it is excluded | Where to debug instead |
|---|---|---|---|
| Instance metadata (IMDS) | 169.254.169.254 |
Link-local, node-internal | IMDSv2 hop limit, instance role, HttpTokens |
| Amazon DNS resolver | VPC base + 2 (e.g. 10.0.0.2) |
Managed resolver traffic | VPC DNS attributes, Route 53 Resolver query logs |
| Amazon Time Sync (NTP) | 169.254.169.123 |
Link-local time service | Chrony/w32time on the host |
| DHCP | UDP 67/68 | Node-internal address assignment | DHCP option sets |
| Windows license activation | AWS-managed KMS endpoints | Managed activation path | Windows licensing on the instance |
| Default VPC router | Reserved base + 1 | The subnet’s implied gateway | Route table, not a firewall |
| Traffic to your own custom DNS | (captured!) | Only the Amazon resolver is excluded | If you run BIND/Unbound, those flows do appear |
The one that trips people up: DNS to the Amazon resolver is invisible, but DNS to your own resolver is visible. So “no DNS records in the Flow Log” is expected if you use the default VPC DNS, and not a sign that DNS is blocked. Likewise, if IMDS calls are failing, do not hunt a Flow Log REJECT — there is none; check the IMDSv2 token requirement and the metadata hop limit instead.
Destinations: CloudWatch Logs, S3, and Kinesis Data Firehose
A Flow Log delivers to exactly one destination per configured log. Pick on latency, query tool, and cost.
| Destination | Latency | Native query tool | Cost model | Retention | Best for |
|---|---|---|---|---|---|
| CloudWatch Logs | Near-real-time | Logs Insights | Ingestion + storage per GB | Log-group retention setting | Live incidents, alerting, metric filters |
| Amazon S3 | Windowed (batched files) | Athena (SQL) | S3 storage + Athena scan | S3 lifecycle | Long retention, big analytics, cheapest at scale |
| Kinesis Data Firehose | Streaming | Downstream tool | Firehose + downstream | Downstream | Fan-out to OpenSearch / Splunk / Datadog / cross-account |
CloudWatch Logs specifics
Records land in a log group, one log stream per ENI (named for the interface). You attach an IAM role that lets the Flow Logs service write to the group. You can create metric filters (e.g. count REJECTs and alarm on a spike) and run Logs Insights interactively. The trade-off is cost: CloudWatch Logs ingestion is materially more expensive per GB than S3, so a chatty VPC logged to CloudWatch at scale gets pricey fast.
S3 specifics — text vs Parquet, and partitioning
S3 is the cost-efficient archive, and the format choices matter enormously for Athena bills.
| Choice | Options | Recommendation | Why |
|---|---|---|---|
| File format | Plain text (space-delimited) or Parquet | Parquet | Columnar → Athena scans only the columns you select |
| Partitioning | None, or Hive-compatible prefixes | Hive-compatible | region=…/year=…/month=…/day=… → prune scans by date |
| Per-hour partition | On / off | On for busy VPCs | Adds hour=…; narrower scans, faster queries |
| Compression | GZIP (text) / Snappy (Parquet default) | Default | Less S3 storage and scan |
With hive-compatible prefixes the object keys look like:
s3://kv-flowlogs/AWSLogs/aws-account-id=123456789012/aws-service=vpcflowlogs/aws-region=us-east-1/year=2026/month=07/day=14/hour=02/...
That structure is what lets Athena prune — a query filtered to one day scans one day’s objects, not the whole bucket, and that is the single biggest lever on your Athena cost.
Kinesis Data Firehose specifics
Firehose streams records to S3, Redshift, OpenSearch, or third-party SaaS (Splunk, Datadog, New Relic), optionally cross-account. Use it when Flow Logs must feed an existing SIEM or observability pipeline rather than being queried in place.
Querying: CloudWatch Logs Insights and Athena
CloudWatch Logs Insights
For the default (version-2) format, Logs Insights auto-discovers named fields; note they are camelCase, not the hyphenated names of the raw record, which trips up every first query:
| Raw v2 field | Logs Insights field |
|---|---|
version |
version |
account-id |
accountId |
interface-id |
interfaceId |
srcaddr |
srcAddr |
dstaddr |
dstAddr |
srcport |
srcPort |
dstport |
dstPort |
protocol |
protocol |
packets |
packets |
bytes |
bytes |
action |
action |
log-status |
logStatus |
For a custom format, those auto-discovered fields may not appear, so parse the @message yourself in the field order you configured. Here is the cookbook.
| Goal | Query |
|---|---|
| Top talkers by bytes | filter action="ACCEPT" | stats sum(bytes) as b by srcAddr, dstAddr | sort b desc | limit 20 |
| REJECT hunting | filter action="REJECT" | stats count(*) as rej by srcAddr, dstAddr, dstPort | sort rej desc | limit 20 |
| Blocks on one port | filter action="REJECT" and dstPort=443 | stats count(*) by srcAddr | sort count(*) desc |
| All flows for one client | filter srcAddr="203.0.113.10" | sort @timestamp desc | limit 50 |
| Rejects for one ENI | filter interfaceId="eni-0abc123" and action="REJECT" | stats count(*) by dstPort |
| SYN-only (half-open), custom fmt | parse @message "* * * ..." as ... , tcpFlags | filter tcpFlags="2" and action="REJECT" |
| Real client behind NAT, custom fmt | parse @message ... as ..., pktSrcAddr, ... | filter action="REJECT" | stats count(*) by pktSrcAddr, dstPort |
| Ingress vs egress split, custom fmt | parse @message ... as ..., flowDirection | stats count(*) by flowDirection, action |
Run one from the CLI to prove the loop end to end:
QID=$(aws logs start-query \
  --log-group-name /vpc/flowlogs \
  --start-time $(($(date +%s) - 3600)) \
  --end-time $(date +%s) \
  --query-string 'filter action="REJECT" | stats count(*) as rej by srcAddr, dstAddr, dstPort | sort rej desc | limit 20' \
  --query 'queryId' --output text)

sleep 5
aws logs get-query-results --query-id "$QID"
Athena over S3
First point Athena at the bucket. This DDL matches the version-2 default column order (align it with your --log-format if you customised it):
CREATE EXTERNAL TABLE IF NOT EXISTS vpc_flow_logs (
  version int, account_id string, interface_id string,
  srcaddr string, dstaddr string, srcport int, dstport int,
  protocol bigint, packets bigint, bytes bigint,
  start bigint, `end` bigint, action string, log_status string
)
PARTITIONED BY (`aws_region` string, `year` string, `month` string, `day` string)
ROW FORMAT DELIMITED FIELDS TERMINATED BY ' '
LOCATION 's3://kv-flowlogs/AWSLogs/123456789012/vpcflowlogs/'
TBLPROPERTIES ("skip.header.line.count"="1");
Loading partitions is the part people get wrong. Three ways, best first:
| Approach | How | Trade-off |
|---|---|---|
| Partition projection | TBLPROPERTIES describe the partition ranges; Athena computes them |
No crawler, no MSCK; scans only matched partitions — best |
MSCK REPAIR TABLE |
Scans S3 for new partitions each time | Slow on big buckets; must re-run |
| Glue crawler | Scheduled crawler populates the catalog | Extra cost + lag |
Partition projection for the hive-compatible layout — set once, never think again:
ALTER TABLE vpc_flow_logs SET TBLPROPERTIES (
  'projection.enabled'='true',
  'projection.aws_region.type'='enum',
  'projection.aws_region.values'='us-east-1,eu-west-1',
  'projection.year.type'='integer','projection.year.range'='2024,2030',
  'projection.month.type'='integer','projection.month.range'='1,12','projection.month.digits'='2',
  'projection.day.type'='integer','projection.day.range'='1,31','projection.day.digits'='2',
  'storage.location.template'='s3://kv-flowlogs/AWSLogs/123456789012/vpcflowlogs/aws_region=${aws_region}/year=${year}/month=${month}/day=${day}'
);
Then the query cookbook. Always include a partition filter — it is the difference between scanning megabytes and terabytes.
| Goal | Query (partition filter shown) |
|---|---|
| Rejects on a day | SELECT srcaddr,dstaddr,dstport,count(*) c FROM vpc_flow_logs WHERE action='REJECT' AND year='2026' AND month='07' AND day='14' GROUP BY 1,2,3 ORDER BY c DESC LIMIT 20; |
| Rejects to one port | ... WHERE action='REJECT' AND dstport=443 AND year='2026' AND month='07' AND day='14' ... |
| Top talkers by bytes | SELECT srcaddr,dstaddr,sum(bytes) b FROM vpc_flow_logs WHERE action='ACCEPT' AND year='2026' AND month='07' AND day='14' GROUP BY 1,2 ORDER BY b DESC LIMIT 20; |
| Human timestamps | SELECT from_unixtime(start) t, srcaddr, dstaddr, dstport, action FROM vpc_flow_logs WHERE ... ORDER BY t DESC; |
| Protocol decode | SELECT CASE protocol WHEN 6 THEN 'TCP' WHEN 17 THEN 'UDP' WHEN 1 THEN 'ICMP' ELSE cast(protocol as varchar) END proto, count(*) FROM vpc_flow_logs WHERE ... GROUP BY 1; |
Finding the blocking layer — the workflow
This is the point of the whole exercise. You have a silent failure; the Flow Log record (or its absence) tells you which layer to fix. The rule in one sentence: a REJECT inbound at the ENI is the security group (or an inbound NACL deny); an ACCEPT inbound with a REJECT outbound on an ephemeral port is a stateless NACL; and no record at all means the packet never reached the ENI, so look upstream at routing.
The verdict decision table
| What the Flow Log shows | Conclusion | Confirm with | Fix |
|---|---|---|---|
REJECT, ingress, at the ENI |
Security group has no matching inbound allow (or inbound NACL denies) | describe-security-groups; then describe-network-acls |
Add the ingress rule for the port + source; check the NACL is not denying |
ACCEPT ingress + REJECT egress on 1024–65535 |
Stateless NACL dropped the return | describe-network-acls outbound rules |
Add NACL egress allow for ephemeral 1024–65535 to the client CIDR |
ACCEPT both ways, app still fails |
Not SG/NACL — host firewall / listener / app | ss -tlnp / tcpdump on the host |
Start the service; open the host firewall |
ACCEPT ingress + tcp-flags include RST |
Host actively refused (reached the OS) | Host logs | App not listening on that port |
| No record at all | Packet never reached the ENI | describe-route-tables, IGW/NAT, peering routes |
Fix the route / gateway / peering, not a firewall |
srcaddr = a NAT/LB address |
You are reading the rewritten source | Add pkt-srcaddr to the format |
Re-query on pkt-srcaddr for the real client |
The symptom → what the Flow Log shows → conclusion → fix playbook
This is the table to keep open at 02:14. Each row is a real, recurring network incident.
| # | Symptom (what the user sees) | What the Flow Log shows | Conclusion (the layer) | Fix |
|---|---|---|---|---|
| 1 | Client times out on :443 |
REJECT, ingress, tcp-flags=2 (SYN) at the ENI |
Security group has no inbound allow for 443 | authorize-security-group-ingress 443 from the client CIDR; verify NACL-in |
| 2 | Handshake half-opens then stalls | ingress ACCEPT (SYN) + egress REJECT on 1024–65535 |
NACL outbound missing the ephemeral allow (stateless return dropped) | Add NACL egress ALLOW 1024–65535 to the client CIDR |
| 3 | “Connection refused” instantly | ingress ACCEPT + tcp-flags includes RST (4) |
Packet reached the host; app not listening / host firewall RST | Start the service / open the OS firewall — not SG/NACL |
| 4 | Nothing happens, pure timeout | No record for the attempt at all | Packet never reached the ENI — routing black hole | Fix the subnet route table / IGW / NAT / peering route |
| 5 | Works same-subnet, fails cross-subnet | REJECT ingress from the other subnet’s CIDR |
SG or NACL scoped to the wrong source CIDR | Widen the allow to the peer subnet CIDR |
| 6 | Logs show the NAT GW IP, not the client | ACCEPT/REJECT with srcaddr = NAT address |
You are reading srcaddr behind NAT |
Add pkt-srcaddr; re-query for the real client |
| 7 | Private-subnet egress to internet fails | egress present at ENI but no return, or REJECT |
Missing NAT/route or NACL ephemeral-in | Add NAT GW + 0.0.0.0/0 route; allow NACL ephemeral inbound |
| 8 | Load-balancer health checks fail | REJECT ingress from the LB subnet on the health-check port |
SG does not allow the LB’s SG/subnet on that port | Allow the LB security group on the health-check port |
| 9 | Return works one way only | Asymmetric ACCEPT/REJECT pair across directions |
Stateless NACL asymmetry (inbound ≠ outbound rules) | Align the inbound and outbound NACL rules |
| 10 | DNS resolution failing | No record for 10.0.0.2 (base + 2) |
Amazon DNS traffic is not logged (a gap) | Debug via VPC DNS attributes / Resolver query logs, not Flow Logs |
| 11 | IMDS / role creds failing | No record for 169.254.169.254 |
IMDS link-local is not logged (a gap) | Check IMDSv2 token + metadata hop limit, not Flow Logs |
| 12 | Whole log is NODATA |
log-status=NODATA on every row |
ENI idle — no traffic in the window | Generate traffic; NODATA is not a block |
| 13 | Cross-account / peered VPC unreachable | REJECT or no record depending on the hop |
REJECT = SG/NACL; no record = peering route missing |
If REJECT: fix SG/NACL. If none: add peering routes in both route tables |
| 14 | On-prem over VPN/DX unreachable | No record, or REJECT if it arrives |
No record = route not propagated; REJECT = SG/NACL | Fix route propagation on the VGW/TGW, or the SG/NACL |
| 15 | “Right rule, wrong ENI” | REJECT despite a correct-looking SG |
The SG is not attached to this ENI (or a second ENI exists) | describe-instances; attach the SG to the correct interface |
| 16 | Intermittent REJECTs under load | REJECT spikes correlate with connection count |
Ephemeral-port exhaustion behind NAT (not a firewall rule) | Fix connection reuse / add NAT capacity; NACL/SG are innocent |
When Flow Logs are not enough
Flow Logs tell you what happened to the packet, but the action field never literally prints “SG sg-0abc denied you.” When you need the exact blocking component named for you, reach for Reachability Analyzer, which statically evaluates the path between two ENIs and returns the precise SG rule, NACL entry, or missing route that blocks it — the perfect complement to a Flow Log REJECT. For the history of who changed the firewall, that is a control-plane question for CloudTrail and Config, covered in AWS CloudTrail and Config: Audit and Compliance at Scale.
Architecture at a glance
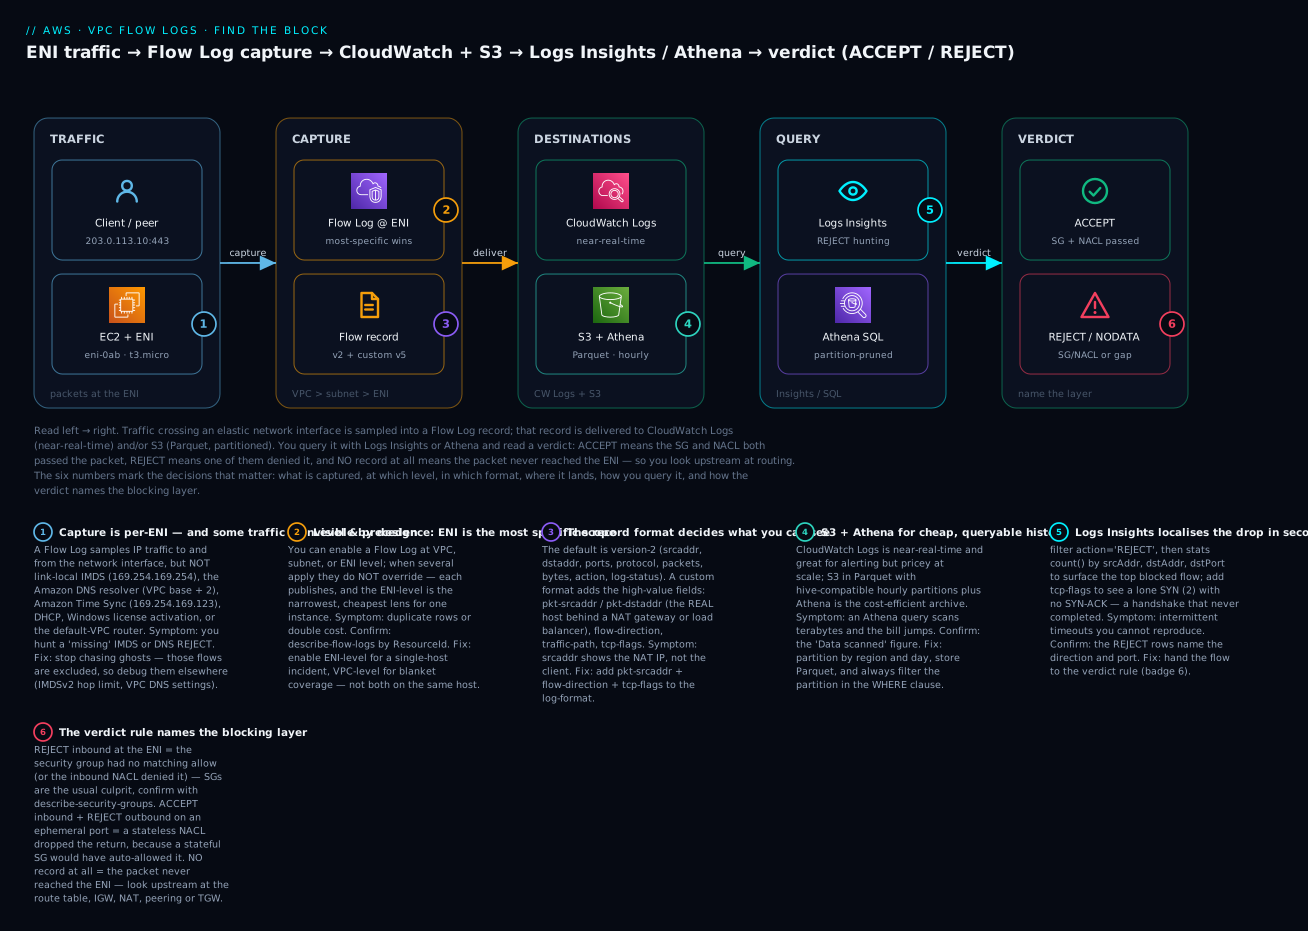
Read the diagram left to right. Traffic crossing an EC2 instance’s ENI is sampled into a flow record; you choose the capture level (VPC, subnet, or ENI — the ENI is the sharpest lens) and the format (version-2 default, or a custom format that adds pkt-srcaddr, flow-direction, traffic-path and tcp-flags). The record is delivered to CloudWatch Logs for near-real-time querying with Logs Insights and/or to S3 (Parquet, hive-partitioned) for cheap SQL with Athena. You query for the failing flow and read a verdict: ACCEPT means both the security group and the NACL passed the packet; REJECT means one denied it; and no record at all means the packet never reached the ENI, so you look upstream at routing. The six badges mark the decisions that matter — what is captured, at which level, in which format, where it lands, how you query, and how the verdict names the guilty layer.
Real-world scenario
Nimbus Retail runs a checkout API on EC2 behind an internal Application Load Balancer, in private subnets across two AZs, egressing through a NAT gateway. On a Tuesday the mobile app starts throwing intermittent checkout failures — not all requests, maybe one in eight — and only from the newest AZ, us-east-1c, which the platform team had added a week earlier to add capacity. The app team insists the code is unchanged. The security team insists the security groups are identical across AZs. The network team insists routing is symmetric. Three teams, three “it’s not us,” and a revenue graph sagging.
The on-call engineer, instead of joining the argument, opens the VPC-level Flow Log they had running to S3 the whole time. She queries Athena for REJECTs on the checkout port during the incident window, filtered to that day’s partition:
SELECT srcaddr, dstaddr, dstport, action, count(*) c
FROM vpc_flow_logs
WHERE action='REJECT' AND dstport=8443
  AND year='2026' AND month='07' AND day='08'
GROUP BY 1,2,3,4 ORDER BY c DESC LIMIT 20;
The result is unambiguous: a cluster of REJECT rows, all egress, all on ephemeral ports 1024–65535, all with a destination in the us-east-1c subnet’s CIDR, 10.0.5.0/24. The inbound requests to those same instances were ACCEPT. ACCEPT in, REJECT out on an ephemeral port — the textbook fingerprint of a stateless NACL that is missing the return allow. The security groups genuinely were identical; the security team was right. But when the platform team created the new subnet in us-east-1c, they had attached a custom NACL copied from an older template that allowed inbound ephemeral traffic but whose outbound rules only allowed 80 and 443 — not the 1024–65535 ephemeral range the load balancer’s return traffic needed.
The fix took ninety seconds: add an outbound ALLOW for TCP 1024–65535 to the load-balancer subnet CIDR on the us-east-1c NACL. Checkout success recovered immediately. The lesson Nimbus took away was not “NACLs are dangerous” but “the Flow Log named the layer while three teams were still guessing.” They made two permanent changes: a metric filter on the CloudWatch-mirrored Flow Log that alarms when egress REJECTs on ephemeral ports exceed a baseline, and a Terraform module for subnets that ships NACLs with a correct symmetric ephemeral rule by default, so a copy-paste template can never reintroduce the asymmetry. The intermittency — one in eight — had been the tell all along: only the fraction of the load balancer’s connection pool that hashed to us-east-1c hit the broken NACL.
Advantages and disadvantages
| Advantages | Disadvantages |
|---|---|
| Records the actual verdict (ACCEPT/REJECT) per flow | Metadata only — no packet payload or deep inspection |
| “No record” localises failures to upstream routing | Not real-time — 5–10 min lag even at 1-min interval |
Reveals the real client behind NAT/LB (pkt-srcaddr) |
Excludes IMDS, Amazon DNS, DHCP — silent gaps |
| Cheap at rest in S3 + Parquet; SQL via Athena | action names the verdict, not which SG/NACL rule |
| Enables at VPC/subnet/ENI with no agent on the host | Overlapping logs duplicate records and cost |
| Feeds SIEM/alerting via CloudWatch and Firehose | Aggregated windows lose sub-second timing |
Flow Logs are a layer-3/4 metadata ledger, and every advantage and limitation follows from that. They shine at answering “was this flow allowed, denied, or absent, and where did it really come from” — which is exactly the question a silent timeout poses. They are the wrong tool for “what was in the HTTP request” (that is application logging or a mirror/IDS), for “which exact SG rule blocked me” (that is Reachability Analyzer), and for “who changed the security group” (that is CloudTrail). Use them for what they are: the fastest way to turn a multi-team argument into a single row that names the guilty hop.
Hands-on lab
You will enable an ENI-level Flow Log to S3 with a custom format, generate a blocked connection, find the REJECT, and identify the blocking layer. Free-tier-friendly: a t3.micro, a tiny S3 footprint, and a few Athena scans. Region us-east-1.
⚠️ Costs money: the EC2 instance (if you launch one and run it beyond free tier), S3 storage for the log objects, and Athena data scanned. All are cents at this scale; the teardown removes everything.
Step 1 — Identify the target ENI
Use an existing instance or launch a throwaway t3.micro in a public subnet. Capture its ENI:
ENI=$(aws ec2 describe-instances \
  --filters "Name=tag:Name,Values=flowlog-lab" "Name=instance-state-name,Values=running" \
  --query 'Reservations[0].Instances[0].NetworkInterfaces[0].NetworkInterfaceId' \
  --output text)
echo "ENI=$ENI"
Expected: ENI=eni-0abc123def4567890.
Step 2 — Create the S3 bucket for logs
ACCT=$(aws sts get-caller-identity --query Account --output text)
BUCKET="kv-flowlogs-$ACCT"
aws s3api create-bucket --bucket "$BUCKET" --region us-east-1
The VPC Flow Logs service writes to the bucket using a service-linked delivery path; you do not need a custom bucket policy for same-account S3 delivery in most setups, but if delivery fails with an access error, add the AWS-documented delivery.logs.amazonaws.com bucket policy (see Step 8’s troubleshooting note).
Step 3 — Create the ENI-level Flow Log with a custom format
aws ec2 create-flow-logs \
  --resource-type NetworkInterface \
  --resource-ids "$ENI" \
  --traffic-type ALL \
  --log-destination-type s3 \
  --log-destination "arn:aws:s3:::$BUCKET" \
  --max-aggregation-interval 60 \
  --destination-options FileFormat=parquet,HiveCompatiblePartitions=true,PerHourPartition=true \
  --log-format '${version} ${account-id} ${interface-id} ${srcaddr} ${dstaddr} ${srcport} ${dstport} ${protocol} ${packets} ${bytes} ${start} ${end} ${action} ${log-status} ${flow-direction} ${pkt-srcaddr} ${pkt-dstaddr} ${traffic-path} ${tcp-flags}'
Expected:
{ "FlowLogIds": ["fl-0a1b2c3d4e5f67890"], "Unsuccessful": [] }
An empty Unsuccessful array means the log was created; a populated one carries the per-resource error to fix.
The equivalent in Terraform:
resource "aws_flow_log" "eni" {
  eni_id                   = "eni-0abc123def4567890"
  traffic_type             = "ALL"
  log_destination          = aws_s3_bucket.flowlogs.arn
  log_destination_type     = "s3"
  max_aggregation_interval = 60

  log_format = "$${version} $${account-id} $${interface-id} $${srcaddr} $${dstaddr} $${srcport} $${dstport} $${protocol} $${packets} $${bytes} $${start} $${end} $${action} $${log-status} $${flow-direction} $${pkt-srcaddr} $${pkt-dstaddr} $${traffic-path} $${tcp-flags}"

  destination_options {
    file_format                = "parquet"
    hive_compatible_partitions = true
    per_hour_partition         = true
  }
}

resource "aws_s3_bucket" "flowlogs" {
  bucket = "kv-flowlogs-123456789012"
}
(The doubled $$ escapes Terraform interpolation so the literal ${field} tokens reach AWS.)
Step 4 — Generate a blocked connection
Make sure the instance’s security group has no inbound rule for TCP 8080. From your laptop, try to reach it on that closed port:
PUBIP=$(aws ec2 describe-instances \
  --filters "Name=tag:Name,Values=flowlog-lab" \
  --query 'Reservations[0].Instances[0].PublicIpAddress' --output text)
curl -m 5 "http://$PUBIP:8080/" ; echo "exit=$?"
Expected: the curl hangs for 5 seconds and returns exit=28 (timeout) — the SYN was silently dropped because the security group has no allow for 8080. That silent drop is exactly what you will now find in the log.
Step 5 — Wait for delivery
Records are windowed. Give it 5–10 minutes, then confirm objects arrived:
aws s3 ls "s3://$BUCKET/AWSLogs/$ACCT/vpcflowlogs/" --recursive | tail
Expected: Parquet objects under ...aws-region=us-east-1/year=2026/month=07/day=14/....
Step 6 — Build the Athena table
In the Athena console (or via the CLI/SDK) create a database and a table over the bucket. Because you chose Parquet + hive partitions, use partition projection so no MSCK is needed. Point storage.location.template at your bucket. Then run:
Step 7 — Find the REJECT and identify the layer
SELECT from_unixtime(start) AS t, srcaddr, dstaddr, dstport,
       action, flow_direction, tcp_flags
FROM vpc_flow_logs
WHERE action='REJECT' AND dstport=8080
  AND year='2026' AND month='07' AND day='14'
ORDER BY t DESC LIMIT 20;
Expected: one or more rows with action=REJECT, flow_direction=ingress, tcp_flags=2 (SYN only — the handshake never completed). Apply the verdict rule: REJECT, ingress, at the ENI = the security group denied inbound. Confirm the layer:
SG=$(aws ec2 describe-instances --filters "Name=tag:Name,Values=flowlog-lab" \
  --query 'Reservations[0].Instances[0].SecurityGroups[0].GroupId' --output text)
aws ec2 describe-security-groups --group-ids "$SG" \
  --query 'SecurityGroups[0].IpPermissions[?ToPort==`8080`]'
Expected: [] — no ingress rule for 8080 exists. That is the block, named. (Fix, if you wanted the connection to work, would be authorize-security-group-ingress --group-id "$SG" --protocol tcp --port 8080 --cidr <your-ip>/32 — but for the lab you have proved the diagnosis, which is the point.)
Step 8 — Teardown
# Delete the Flow Log
FLID=$(aws ec2 describe-flow-logs \
  --filter "Name=resource-id,Values=$ENI" \
  --query 'FlowLogs[0].FlowLogId' --output text)
aws ec2 delete-flow-logs --flow-log-ids "$FLID"

# Drop the Athena table (in Athena): DROP TABLE vpc_flow_logs;

# Empty and delete the bucket
aws s3 rm "s3://$BUCKET" --recursive
aws s3api delete-bucket --bucket "$BUCKET"

# Terminate the lab instance if you launched one for this
# aws ec2 terminate-instances --instance-ids <id>
Verify with aws ec2 describe-flow-logs --filter "Name=resource-id,Values=$ENI" returning an empty FlowLogs array.
Common mistakes & troubleshooting
The playbook above localises network failures. This section troubleshoots the Flow Logs themselves — why the log is empty, wrong, or expensive — because a broken log during an incident is its own emergency.
| # | Symptom | Root cause | Confirm (exact command / path) | Fix |
|---|---|---|---|---|
| 1 | No log objects / streams ever appear | Delivery IAM role (CloudWatch) or bucket policy (S3) missing/wrong | aws ec2 describe-flow-logs → read DeliverLogsErrorMessage |
Attach the correct role; add the delivery.logs.amazonaws.com bucket policy |
| 2 | Every row is log-status=NODATA |
ENI is idle — no traffic in the window | Is anything actually talking to the ENI? | Generate traffic; NODATA ≠ block, ≠ broken |
| 3 | Occasional log-status=SKIPDATA |
Internal capacity limit skipped some records | Grep for SKIPDATA frequency |
Rare is normal; sustained → reduce volume / split logs |
| 4 | Records lag 10+ minutes | 10-min aggregation interval + delivery delay | --max-aggregation-interval value |
Set 60 for active incidents |
| 5 | Athena columns all shifted / garbage | DDL column order ≠ custom --log-format order |
Compare the table DDL to the flow log’s LogFormat |
Rewrite the DDL to match the format exactly |
| 6 | Athena returns zero rows | Partitions not loaded, or wrong LOCATION/projection template |
SHOW PARTITIONS vpc_flow_logs; |
Fix projection template / MSCK REPAIR TABLE / correct LOCATION |
| 7 | Athena bill spikes | Full-table scan — no partition filter, text not Parquet | “Data scanned” in query stats | Add WHERE year/month/day=…; store Parquet |
| 8 | srcaddr is a NAT/LB IP, not the client |
Reading the rewritten address in v2 default | Is there a NAT GW/LB in the path? | Add pkt-srcaddr to the format; re-query |
| 9 | Hunting a REJECT that never appears | Traffic is on the exclusion list (IMDS/DNS/DHCP) | Is dst 169.254.x.x or the base+2 resolver? |
Stop — it is a gap; debug that service directly |
| 10 | Duplicate rows, doubled cost | VPC-level and ENI-level logs overlap | aws ec2 describe-flow-logs — count logs on the ENI |
Keep one scope; delete the redundant log |
| 11 | REJECT despite a “correct” SG | Rule is on an SG not attached to this ENI, or a 2nd ENI | describe-instances → each ENI’s Groups[] |
Attach the SG to the right ENI; audit secondary ENIs |
| 12 | protocol shows 6/17, not TCP/UDP |
It is the IANA number, not a name | — | Decode: 6=TCP, 17=UDP, 1=ICMP; not a bug |
| 13 | Everything ACCEPT but app still down |
Flow Logs are L3/L4 — ACCEPT ≠ app replied | ss -tlnp on the host; app logs |
Debug the listener / host firewall, not SG/NACL |
| 14 | Cannot tell SG from NACL on a REJECT | action does not name the layer |
Apply the verdict rule + describe-* |
Use direction: REJECT-in → SG; ACCEPT-in/REJECT-out → NACL |
The status / delivery reference
| Value or error | Where | Meaning | Fix |
|---|---|---|---|
log-status=OK |
Record | Healthy capture | None |
log-status=NODATA |
Record | Idle ENI, no traffic in window | Generate traffic; not an error |
log-status=SKIPDATA |
Record | Some records skipped (capacity) | Reduce volume if sustained |
DeliverLogsErrorMessage: ...role... |
describe-flow-logs |
CloudWatch delivery role lacks permission | Fix/attach the IAM role trust + policy |
Access Denied writing to S3 |
Delivery | Bucket policy missing delivery.logs.amazonaws.com |
Add the documented bucket policy |
Unsuccessful non-empty on create |
create-flow-logs |
The ENI/permissions rejected the log | Read the error; fix the resource or role |
The three failure modes worth internalising
First: NODATA is not “blocked.” The most common false alarm in the whole system. A screen of NODATA means the ENI had no traffic during those windows — a load balancer target that is out of rotation, a scaled-down instance, a test box no one is hitting. If you were expecting traffic and see NODATA, the interesting question is “why is nothing reaching this ENI,” which is an upstream question (routing, target-group registration), not a firewall one.
Second: the shifted-column disaster. When you customise --log-format, the fields land in the order you wrote, but your Athena DDL (or Logs Insights parse) has a separate fixed order. If they disagree by even one field, every column shifts: dstport reads into the protocol column, action reads a byte count, and your REJECT hunt returns nonsense. Always generate the DDL from the exact LogFormat string, and keep them versioned together.
Third: the Athena bill. A single unpartitioned SELECT * over a busy VPC’s year of text-format logs can scan terabytes and cost real money for one query. Three habits eliminate it: store Parquet, partition by date (hive-compatible), and never run a query without a partition filter in the WHERE. Watch the “Data scanned” figure — it is the price tag on every query.
Best practices
- Run one blanket VPC-level Flow Log to S3 (Parquet, hive-partitioned) for security and compliance, always-on, with
ALLtraffic — you cannot investigate an incident whose evidence you did not capture. - Add a temporary ENI-level log at 60-second interval during an active incident when you need faster records or a richer custom format than the blanket log carries — and delete it in teardown.
- Use a custom format with the high-value fields (
pkt-srcaddr,flow-direction,traffic-path,tcp-flags,subnet-id,instance-id) on any log you will use for troubleshooting; the default v2 hides the real client behind NAT/LB. - Store Parquet, partition by date, and always filter the partition in Athena — it is the single biggest control on query cost.
- Send REJECT spikes to an alarm via a CloudWatch metric filter (or an S3→Lambda), so a NACL/SG regression pages you instead of surfacing as a customer complaint.
- Set S3 lifecycle rules to expire or tier Flow Log objects (e.g. Glacier after 90 days, delete after a year) — the volume is relentless.
- Version your
--log-formatwith your Athena DDL together so the column order can never drift apart. - Know the exclusion list cold — never open an incident by hunting an IMDS or Amazon-DNS REJECT.
- Pair inbound and outbound records before blaming a layer; the ACCEPT-in / REJECT-out signature is the only reliable NACL fingerprint.
- Reach for Reachability Analyzer when you need the exact blocking rule named, not just the layer.
- Encrypt the destination (SSE-KMS on the bucket, or a CloudWatch log group with KMS) — flow metadata reveals your internal topology.
Security notes
Flow Log data is sensitive reconnaissance material: it maps your internal CIDRs, which hosts talk to which, on which ports, and where your egress goes. Treat the destination as you would any security log.
- Least privilege on the destination. The Flow Logs delivery role (CloudWatch) should be scoped to the specific log group; the S3 bucket policy should grant only
delivery.logs.amazonaws.comwrite and only your analysts read. Never make the bucket public. - Encrypt at rest. Use SSE-KMS on the S3 bucket (or a CMK on the CloudWatch log group). Restrict the KMS key policy so only the delivery service and your analysts can use it.
- Isolate the analytics account. In a multi-account org, deliver Flow Logs cross-account to a dedicated log-archive account (via Firehose or an S3 bucket policy) so a compromised workload account cannot tamper with its own evidence.
- Use Flow Logs as a security control. A metric filter on REJECT spikes, on unexpected egress
dstport, or onpkt-dst-aws-serviceyou do not expect turns the log into a detection, not just a forensic archive. - Remember what they cannot see. Because IMDS and DNS-to-the-resolver are excluded, do not rely on Flow Logs to detect SSRF-against-metadata or DNS exfiltration to the Amazon resolver — those need IMDSv2 enforcement and Route 53 Resolver query logging respectively.
- Retain to policy. Set S3 Object Lock or a lifecycle that matches your compliance retention; Flow Logs are frequently in scope for audits (PCI, SOC 2).
The least-privilege delivery grants, by destination — get these wrong and you get an empty log with a DeliverLogsErrorMessage:
| Destination | Who writes the records | Permission it needs |
|---|---|---|
| CloudWatch Logs | Flow Logs service, assuming your IAM role | Role (--deliver-logs-permission-arn) with logs:CreateLogGroup/Stream, logs:PutLogEvents, logs:DescribeLogStreams; trust vpc-flow-logs.amazonaws.com |
| S3 | The delivery.logs.amazonaws.com service principal |
Bucket policy allowing that principal s3:PutObject + s3:GetBucketAcl |
| S3 with SSE-KMS | Same delivery principal | KMS key policy granting the principal kms:GenerateDataKey* |
| Kinesis Data Firehose | Flow Logs via an IAM role | Role with firehose:PutRecord/PutRecordBatch; trust the flow-logs principal |
| Cross-account S3 | Delivery principal in the source account | Destination bucket policy scoped with an aws:SourceAccount condition |
Cost & sizing
Flow Logs have no per-log charge; you pay the destination’s ingestion and storage, plus query cost. The volume is a function of flow count, not bandwidth — a chatty microservice mesh generates far more records than a few big file transfers.
| Cost driver | Where it lands | Rough figure (us-east-1) | Lever |
|---|---|---|---|
| CloudWatch Logs ingestion | Per GB ingested | ~US$0.50 / GB (~₹42) | Log to S3 instead for archive |
| CloudWatch Logs storage | Per GB-month | ~US$0.03 / GB (~₹2.5) | Set log-group retention |
| S3 storage | Per GB-month | ~US$0.023 / GB (~₹2) | Parquet + lifecycle to Glacier |
| Athena scan | Per TB scanned | ~US$5 / TB (~₹420) | Parquet + partition filters |
| Firehose | Per GB ingested | ~US$0.029 / GB (~₹2.4) | Only if you need streaming fan-out |
Sizing intuition: CloudWatch Logs is for the recent, hot window you alert and query interactively; S3 is for the deep, cheap archive you occasionally query with Athena. A common pattern is both — a CloudWatch log with a short retention (say 7–14 days) for live incident response and metric-filter alarms, and an S3 log with a year+ lifecycle for compliance and post-incident analytics. The cost trap is logging a high-volume VPC to CloudWatch at full ALL traffic and long retention; the same data in S3-Parquet with lifecycle is an order of magnitude cheaper. Free-tier note: CloudWatch Logs includes a modest ingestion/storage free allowance, and Athena/S3 costs at lab scale are cents — but a production VPC’s Flow Logs are a real, recurring line item you should size and alarm on deliberately.
Interview & exam questions
1. What does action=REJECT in a Flow Log tell you, and what does it not tell you? It tells you a security group or a network ACL denied the flow. It does not tell you which one — the action field is the combined verdict. You disambiguate with direction and statefulness: REJECT inbound at the ENI points to the SG (or inbound NACL), while ACCEPT-in with REJECT-out on an ephemeral port points to a stateless NACL. (SAA-C03 / SOA-C02 / ANS-C01)
2. A connection times out and there is no Flow Log record for it at all. What is your conclusion? The packet never reached the ENI. Flow Logs capture at the interface, so absence means an upstream drop — a missing or wrong route table entry, a missing IGW/NAT, or an un-propagated peering/VPN route. Look at routing, not firewalls. (ANS-C01)
3. Why might srcaddr show a NAT gateway’s IP instead of the real client? Because srcaddr is the address as seen at the ENI, after NAT/LB rewriting. The pkt-srcaddr custom field (v3) preserves the original source before the rewrite, so you add it to a custom format to see the true client. (ANS-C01)
4. What are three types of traffic Flow Logs never record? Instance metadata (169.254.169.254), traffic to the Amazon DNS resolver (VPC base + 2), and DHCP — plus Amazon Time Sync (169.254.169.123), Windows license activation, and the reserved default-router address. Their absence is expected and says nothing about firewalls. (SOA-C02)
5. You enable a VPC-level and an ENI-level Flow Log covering the same interface. What happens? Both capture and deliver independently — you get duplicate records and pay twice. There is no override or merge; the ENI level is not “more specific wins.” (SAA-C03)
6. When would you choose S3 over CloudWatch Logs as a destination? For cheap long-term retention and large-scale analytics: S3 in Parquet with hive partitions, queried by Athena, is far cheaper per GB than CloudWatch ingestion. Choose CloudWatch for near-real-time interactive queries and metric-filter alarms. (SOA-C02)
7. What is the fingerprint of a NACL problem versus a security-group problem in Flow Logs? ACCEPT on the inbound flow paired with REJECT on the outbound return (on an ephemeral port 1024–65535) is a stateless NACL missing its return allow — a stateful SG would auto-allow the return. A plain REJECT on the inbound flow is the SG (or an inbound NACL deny). (ANS-C01)
8. What does log-status=NODATA mean, and why is it commonly misread? It means the ENI had no traffic during the aggregation window — the interface was idle. It is misread as “blocked” or “logging broken”; it is neither. If you expected traffic, the question is why nothing reached the ENI (routing, target registration). (SOA-C02)
9. How do you keep Athena costs down when querying Flow Logs? Store the logs as Parquet, partition by date (hive-compatible prefixes), and always include a partition filter in the WHERE clause; use partition projection to avoid crawlers/MSCK. Without those, a single query can scan terabytes. (SAA-C03)
10. What does tcp-flags=2 on a REJECTed ingress record tell you? Only a SYN was seen — a connection attempt that got no SYN-ACK because it was denied. It confirms the handshake never completed at the firewall layer, distinguishing “blocked” from “reached the host and was reset” (which would show an RST). (ANS-C01)
11. Flow Logs show ACCEPT both ways but the application still fails. Where do you look? Not at SG/NACL — an ACCEPT means both firewalls passed the packet. The problem is at the host or app: the listener is down, bound to the wrong interface, or a host OS firewall reset it. Check ss -tlnp, host firewall, and app logs. (SOA-C02)
12. You need the exact SG rule or NACL entry that blocks a path, not just the layer. What tool complements Flow Logs? Reachability Analyzer statically evaluates the path between two ENIs and names the precise blocking component (SG rule, NACL entry, or missing route) — the complement to a Flow Log REJECT that only names the layer. (ANS-C01)
Quick check
- In the version-2 default format, which field is position 13, and what are its two values?
- You see a Flow Log record with
flow-direction=egress,action=REJECT,dstportin 1024–65535. Which layer is the prime suspect and why? - Name two traffic types that never appear in Flow Logs.
- What single S3 + Athena habit most reduces query cost?
- A REJECT record shows
srcaddras your NAT gateway’s IP. Which field do you add to see the real client?
Answers
- Position 13 is
action, with values ACCEPT and REJECT. (Position 14 islog-status.) - A stateless network ACL missing the outbound ephemeral-port allow — a stateful security group would have auto-allowed the return of an accepted inbound flow, so a REJECT on the egress return points to the NACL.
- Any two of: instance metadata (
169.254.169.254), Amazon DNS resolver (VPC base + 2), DHCP, Amazon Time Sync (169.254.169.123), Windows license activation, the reserved default-router address. - Partitioning by date (hive-compatible) and always filtering the partition in the
WHERE— combined with storing Parquet. It bounds the data scanned. pkt-srcaddr(the v3 custom field) — it preserves the original source before the NAT/LB rewrite.
Glossary
| Term | Definition |
|---|---|
| VPC Flow Log | A per-interface record of IP traffic metadata (not payload) captured at VPC, subnet, or ENI level. |
| ENI | Elastic network interface — the capture point; a Flow Log records traffic to and from it. |
| Flow record | One aggregated row per flow tuple per aggregation interval, with counters and a verdict. |
| Aggregation interval | The capture window, 60 s or 600 s; larger = fewer records, more latency. |
action |
The combined SG+NACL verdict for a flow: ACCEPT or REJECT. |
log-status |
Capture health: OK (logging), NODATA (idle ENI), SKIPDATA (records skipped). |
srcaddr / dstaddr |
Addresses as seen at the ENI — may be a NAT/LB address, not the real endpoint. |
pkt-srcaddr / pkt-dstaddr |
The real source/destination before NAT/LB rewrite (custom v3 fields). |
flow-direction |
Whether the flow was ingress or egress at the ENI (custom v5 field). |
traffic-path |
The egress path a flow took — IGW, NAT, VGW, peering, etc. (custom v5, values 1–8). |
tcp-flags |
Bitmask of TCP flags seen in the window; 2 = SYN, 18 = SYN-ACK, 4 = RST, 1 = FIN. |
| Version 2 | The default record format: 14 space-delimited fields in a fixed order. |
| Custom format | A chosen subset/superset of fields (v3–v7) in an order you define. |
| Security group | Stateful, allow-only firewall on the ENI; return traffic auto-allowed. |
| Network ACL | Stateless, ordered allow/deny list on the subnet; return must be allowed explicitly. |
| Partition projection | Athena feature that computes partitions from ranges, avoiding crawlers/MSCK. |
Next steps
- Security Groups vs NACLs: A Deep Dive and a Connectivity-Blocking Troubleshooting Guide — the two firewalls whose verdict the
actionfield records. - Building an AWS VPC from Scratch: Subnets, Route Tables, IGW & a Public/Private Design — the routing layer you check when there is no Flow Log record.
- Private-Subnet Internet Egress: NAT Gateway vs NAT Instance, Hands-On & Cost — exactly where
srcaddrstops being the real client andpkt-srcaddrearns its column. - AWS CloudTrail and Config: Audit and Compliance at Scale — the control-plane record of who changed the firewall the Flow Log caught blocking traffic.
- AWS Data Lake and Analytics Architecture: S3, Glue, Athena, Redshift and Kinesis — scale the S3 + Athena pattern from one Flow Log table to a full analytics estate.