Quick take: A cost spike is a detective problem, not an accounting problem. Work it top-down through a fixed funnel: which service (Cost Explorer, group by Service) → which meter (group by Usage Type — the single most important move) → which resource (CUR line items over Athena,
line_item_resource_id) → which day/hour (daily/hourly granularity) → whose (tag / linked account). Cost Anomaly Detection does the first two steps for you — itsRootCauseslist names the service, region, and usage type before you open anything. Ninety percent of spikes are one of a handful of invisible meters: NAT data processing, cross-AZ / internet data transfer, idle provisioned capacity, and the silent giant — CloudWatch Logs ingestion.
The invoice went from $430 to $1,920 in eighteen days and nobody changed anything they can remember. That is the moment this article is written for. You are not trying to prevent a spike now — that ship sailed; you are trying to name it in twenty minutes: which service, which meter, which resource, which day it started, and who owns it. Do it with a method and it is a calm twenty-minute drill. Do it by clicking around the Bills page hoping a big number jumps out and it is a frustrated afternoon that ends with “I think it’s data transfer?”
The reason a spike is hard is that AWS bills meters, not resources. Your console shows you instances, buckets, and functions; your bill shows you NatGateway-Bytes, DataTransfer-Regional-Bytes, and USE1-DataProcessing-Bytes — meters that often have no corresponding row in any resource list. A NAT gateway processing 400 GB of cross-AZ chatter, an S3 lifecycle policy retrieving cold data, a debug log line shipping 30 GB/day to CloudWatch — none of these appear when you look at “my resources.” They only appear when you group the cost data by usage type. That single pivot — from Service to Usage Type — is the skill that separates a five-minute diagnosis from a lost afternoon.
This article is the diagnostic companion to setting up the guardrails. If you have not yet turned on the trip-wires (a Budget, a billing alarm, Cost Anomaly Detection, free-tier alerts), start with AWS Cost Control 101: Cost Explorer, Budgets, Alerts & Free-Tier Guardrails — that piece builds the alarms; this one is what you do when one of them fires. You will learn the triage funnel end to end, how to read a Cost Anomaly Detection root-cause list, how to drive Cost Explorer’s group-by ladder and resource-level view, how to decode any usage-type string, and how to write the handful of CUR-over-Athena queries that pin a spike to an exact resource ID. Every culprit — NAT, transfer, S3 requests and retrieval, orphaned EBS/EIP, CloudWatch Logs, idle RDS/OpenSearch/Kinesis/DynamoDB, KMS/Secrets per-request, cross-region GuardDuty/Config — is enumerated with the exact meter it hides behind and the exact query that finds it.
What problem this solves
An unexplained cost increase is one of the most stressful things a cloud engineer faces, because the money is already spent by the time you see it, the tools all lag by up to a day, and the default answer (“it’s probably data transfer”) is a guess, not a diagnosis. Three failure modes make it worse than it should be:
- You look in the wrong place. The Bills page and the resource console show you services and resources. But a spike is almost always a meter — a usage type that does not map to a listed resource. You can stare at your EC2 instance list all day and never see the
NatGateway-Bytesthat is 60% of the increase. - You stop at the service, not the resource. “It’s CloudWatch” or “it’s S3” is not actionable. Which log group? Which bucket? Which hour did it start? Without pinning the resource ID and the time, you cannot tell whether it is a config change, a code deploy, a runaway loop, or a compromise — and you cannot hand it to the team that owns it.
- You cannot attribute it. In a shared account with no tags, even a correct diagnosis (“a Kinesis stream is over-provisioned”) leaves you asking “whose stream?” Untagged spend is spend you cannot route, and a spike you cannot route is a spike that recurs.
Who hits this: every team, eventually. The FinOps analyst chasing a monthly variance. The SysOps engineer paged by a Budget forecast alert. The architect who inherited an account and needs to explain a 4× increase to finance. The startup founder who got a bill that is a meaningful fraction of runway. The method is the same for all of them, and it is the same whether the spike is $50 or $500,000 — only the stakes change.
Learning objectives
By the end of this article you can:
- Run the triage funnel — bill → service → usage type → resource → time → owner — as a repeatable drill, top-down, without guessing.
- Read a Cost Anomaly Detection anomaly’s
RootCauseslist and turn it directly into a Cost Explorer filter. - Drive Cost Explorer for triage: the group-by ladder (Service → Usage Type → Usage Type Group → Linked Account → Region → Tag), daily granularity to find the spike day, and the hourly / resource-level view to confirm the resource.
- Decode any usage-type string (region prefix, meter, dimension) and name the culprit from the meter alone.
- Write the CUR-over-Athena query set that pins a spike to
line_item_product_code→line_item_usage_type→line_item_resource_id, and to the day and hour it started. - Recognise the usual culprits — NAT data processing, cross-AZ / internet transfer, S3 requests/retrieval/early-delete/replication, orphaned EBS/snapshots/EIPs, CloudWatch Logs ingestion, idle provisioned RDS/OpenSearch/Kinesis/MSK/DynamoDB, KMS/Secrets per-request, cross-region GuardDuty/Config — and the exact meter each hides behind.
- Attribute a spike with cost-allocation tags and Cost Categories, and spot RI / Savings Plans coverage gaps that masquerade as spikes.
- Contain an in-progress runaway with a budget action while you finish the diagnosis.
Prerequisites & where this fits
You need an AWS account with billing access (the management/payer account in an Organization, or an IAM principal granted ce:*, cur:*, budgets:*, aws-portal:ViewBilling), Cost Explorer enabled (a one-time console action; it back-fills ~24 hours), and the AWS CLI v2. For the deepest drill-down you need a Cost and Usage Report (CUR) delivered to S3 with resource IDs enabled and the Athena integration turned on — set that up before a crisis, because a freshly enabled CUR only starts collecting from today. Terraform is optional; every step includes an aws provider snippet.
Where this fits: it is the reactive half of FinOps, downstream of the proactive guardrails. The companion AWS Cost Control 101 sets up the Budgets, the CloudWatch billing alarm, and Cost Anomaly Detection that alert you to a spike; this article is the runbook you open when one fires. Attribution depends on tagging discipline — see AWS Tagging Strategy and Cost-Allocation Enforcement — because a spike you cannot tag is a spike you cannot route. And the number-one culprit by frequency, NAT data processing, is dissected in NAT Gateway Private-Subnet Egress. This piece maps to SOA-C02 (monitoring and cost), SAP-C02 (cost optimisation at scale), and the FinOps Practitioner body of knowledge.
Core concepts
To triage a spike you need a precise mental model of how AWS represents cost. Everything you pay for is a stream of line items, and every line item has the same anatomy. Learn these fields — the console, Cost Explorer, and the CUR all use them, and the whole method is a walk down these columns.
| Field (CUR column) | What it is | Example value | Why it matters in triage |
|---|---|---|---|
Service (line_item_product_code) |
The AWS service | AmazonEC2, AmazonS3 |
Level 1 of the funnel — the what |
Usage type (line_item_usage_type) |
The exact meter | USE1-NatGateway-Bytes |
Level 2 — the meter, the key pivot |
Operation (line_item_operation) |
The API/action metered | GetObject, RunInstances |
Splits request-driven cost (S3/DDB) |
Resource ID (line_item_resource_id) |
The specific resource | nat-0abc…, i-0def…, log-group ARN |
Level 3 — the thing to fix |
Unblended cost (line_item_unblended_cost) |
Actual $ on the line | 41.20 |
What you sum |
Usage amount (line_item_usage_amount) |
Quantity metered | 915.6 (GB) |
Confirms it’s volume, not rate |
Region / AZ (product_region, line_item_availability_zone) |
Where it ran | us-east-1, use1-az2 |
Cross-AZ / cross-region transfer |
Linked account (line_item_usage_account_id) |
Which org account | 111122223333 |
Who in a multi-account org |
Line-item type (line_item_line_item_type) |
Usage / Tax / Credit / Discount | Usage, DiscountedUsage |
Exclude tax/credits when hunting |
Usage start (line_item_usage_start_date) |
Hour of usage | 2026-07-09 14:00 |
When — pins the spike hour |
Tags (resource_tags_user_<key>) |
Your cost-allocation tags | team=payments |
Attribution/ownership |
Two structural facts drive the whole discipline:
A meter is not a resource. Many of the costliest meters — data transfer, NAT bytes, cross-AZ, request charges — are attributes of traffic or behaviour, not line items you can see in a resource list. The only place they surface is the cost data, grouped by usage type. This is why “look at my resources” fails and “group cost by usage type” works.
Every signal lags, at a different rate. Cost data is not real-time. Pick the tool whose latency and granularity fit the question — and never expect any of them to catch a runaway in seconds.
| Signal | Typical latency | Finest granularity | Best question in triage |
|---|---|---|---|
CloudWatch EstimatedCharges |
~6 h | Per-service total, us-east-1 |
“Is MTD still climbing right now?” |
| Cost Explorer (daily) | Up to ~24 h | Daily / service / usage type / tag | “Which service & meter, and which day?” |
| Cost Explorer (hourly + resource-level) | Up to ~24 h | Hourly, per-resource (paid opt-in) | “Which resource, which hour?” |
| Cost Anomaly Detection | Detects within ~24 h | Per monitor, with root causes | “What deviated from baseline, and where?” |
| AWS Budgets | ~8–12 h | Per budget scope | “Am I forecast to blow the cap?” |
| CUR in S3 (+ Athena) | Up to ~24 h, refreshed 1–3×/day | Hourly, per-resource, SQL | “Pin the exact resource / hour / tag” |
| Bills page (invoice) | Finalised after month close | Per-service, per-region | The legal record, not a triage tool |
Because everything lags, the fastest loop is: let Anomaly Detection name the service + usage type, confirm in Cost Explorer, pin in the CUR. You are never watching a live meter — you are reconstructing what happened over the last day or two.
The triage funnel: bill → service → usage type → resource → time → owner
The method is a funnel: start at the widest, cheapest, fastest signal and narrow one level at a time. Never skip a level, and never start at the bottom (you will drown in CUR rows). Each level answers one question with one tool.
| Level | Question | Tool & move | Output you carry down |
|---|---|---|---|
| 0. Baseline | Is this real, and when did it start? | CE daily trend; CloudWatch EstimatedCharges |
The spike day and rough magnitude |
| 1. Service | Which service jumped? | CE group by Service, daily | The service (e.g. EC2, CloudWatch) |
| 2. Meter | Which meter within it? | CE group by Usage Type (+ filter Service) | The usage type (e.g. NatGateway-Bytes) |
| 3. Dimension | Where / who? | CE group by Region / AZ / Linked Account / Tag | Region, AZ, account, or team |
| 4. Resource | Which exact resource? | CUR + Athena line_item_resource_id; CE resource-level |
The resource ID |
| 5. Time | Which day/hour did it kink? | CE hourly; CUR group by hour | The onset — deploy? config? loop? |
| 6. Owner | Who owns it, what’s the fix? | Tags / Cost Category; the fix table | A ticket to the owning team |
Anomaly Detection is a shortcut that jumps you to level 2 for free — its root-cause list already names the service, region, and usage type, so you often start the manual work at level 3 or 4. Use it when it fired; use the full funnel from level 0 when you are chasing a slow monthly variance that never tripped an anomaly.
The first fifteen minutes
A fixed opening sequence beats improvisation. This is the checklist to run before you form any hypothesis.
| Step | Command / path | What you’re looking for |
|---|---|---|
| 1. Confirm it’s real | CE → Daily, last 30 days, group by Service | A visible step-change, not noise |
| 2. Note the onset day | Same chart, read the kink | Correlate with deploys/config changes |
| 3. Check anomalies | aws ce get-anomalies |
A ready-made root-cause list |
| 4. Rank services | CE group by Service, the spike window vs prior | The 1–2 services that moved |
| 5. Split the top service | Filter that service, group by Usage Type | The meter carrying the increase |
| 6. Rule out tax/credit | Filter Charge type = Usage | Don’t chase a one-off credit expiry |
| 7. Contain if runaway | Apply a budget action / stop the resource | Stop an active bleed before it grows |
If step 5 shows the meter is a data-transfer or NAT usage type, you are in the “invisible meter” family and should reach straight for the usage-type decoder and the CUR. If it is a provisioned-capacity meter (InstanceUsage, Shard-Hour, *CapacityUnit-Hrs), you are looking at something running 24×7 and the fix is right-sizing or deletion, not code.
Cost Explorer for spike triage
Cost Explorer (CE) answers which service and which meter, fast, in the UI, with no setup beyond the one-time enable. For triage you drive it with four levers — filter, group by, granularity, date range — plus the paid resource-level view for the final confirm.
The group-by ladder — the heart of the method
There is exactly one primary group-by at a time, so you walk the ladder: pick a group-by, read the top row, then add a filter and change the group-by to go one level deeper. Group-by Service answers what; group-by Usage Type answers which meter; the rest answer where and who.
| Group by | Question it answers | Typical next move |
|---|---|---|
| Service | “Which service jumped?” | Filter that service, group by Usage Type |
| Usage Type | “Which exact meter?” (the key pivot) | Note the meter; go to CUR for resource |
| Usage Type Group | “Compute vs storage vs transfer at a glance” | Coarse triage when Usage Type is noisy |
| Linked Account | “Which account (org)?” | Filter the account, restart at Service |
| Region | “Where is the regional / egress cost?” | Filter region; look for cross-region pairs |
| Availability Zone | “Is this cross-AZ transfer?” | Confirms DataTransfer-Regional-Bytes |
| API Operation | “Which call drives it (S3/DDB)?” | GetObject flood, PutItem storm |
| Instance Type | “Am I over-provisioned on a size?” | Right-sizing candidate |
| Purchase Option | “On-Demand jump = lost SP/RI coverage?” | Check SP/RI coverage report |
| Tag | “Which team / project / env?” | Ownership (tag must be activated) |
| Cost Category | “Which product / business unit?” | Chargeback attribution |
| Charge Type | “Usage vs tax vs credit vs refund” | Exclude non-usage before chasing |
The move that cracks most cases: filter Service = EC2 and switch group-by to Usage Type. The opaque “EC2-Other” bucket instantly decomposes into NatGateway-Hours, NatGateway-Bytes, EBS:VolumeUsage.gp3, DataTransfer-Regional-Bytes, and VpcEndpoint-Hours — and one of them is almost always your spike.
Filters — narrow the population before you pivot
| Filter | Use in triage | Example |
|---|---|---|
| Service | Isolate the jumped service | Amazon Elastic Compute Cloud |
| Usage Type | Confirm a specific meter | *NatGateway-Bytes (wildcard across regions) |
| Region | Regional / egress isolation | ap-south-1 |
| Linked Account | Per-account in an org | 1234-5678-9012 |
| Charge Type | Drop tax, credits, refunds, RI fees | Usage only |
| Tag | Team/project scope | Environment = prod |
| Purchase Option | Separate On-Demand from committed | On-Demand |
| Resource | Per-resource (hourly opt-in) | i-0abc… |
Filters stack (AND across dimensions, OR within one), so “Service = S3 AND Charge type = Usage, group by Usage Type” gives a clean view of S3 meters with credits and tax removed.
Granularity and the resource-level view
| Setting | Options | When to use it |
|---|---|---|
| Granularity | Monthly / Daily / Hourly | Daily to find the onset day; Hourly to find a loop |
| Date range | Up to ~14 months back | Compare spike window to the prior period |
| Forecast | Up to 12 months forward | Estimate month-end if the spike continues |
| Resource-level | Off / On (paid opt-in) | The final confirm: per-resource rows |
| Hourly + resource-level | Off / On (paid opt-in) | ~$0.01 / 1,000 usage records / mo |
Daily granularity is non-negotiable for triage — a monthly view hides the exact day the line kinked, and the onset day is your single best clue to the cause (it usually lines up with a deploy, a config change, or the day a trial ended). The resource-level opt-in adds per-resource rows to Cost Explorer itself, which is the quickest live confirm once the CUR has named a resource — but it is a paid feature and lags ~24h, so for deep or historical work the CUR over Athena is cheaper and unlimited.
Cost types — make sure you’re comparing like with like
| Cost type | Definition | Use it when |
|---|---|---|
| Unblended | Actual rate on each line at time of use | Default; matches the invoice |
| Amortized | Upfront RI/SP fees spread over the term | A spike that’s really an RI purchase |
| Net unblended | Unblended after credits/EDP discounts | Real out-of-pocket |
| Blended | Averaged rate across org accounts | Org-wide fairness view |
A classic false alarm: an RI or Savings Plan up-front payment lands as a big unblended line on one day. Switch to amortized and the “spike” spreads flat across the term — it was a commitment purchase, not a runaway. Always sanity-check a one-day spike against the amortized view before you escalate.
Cost Anomaly Detection: monitors, subscriptions, and reading a root cause
Cost Anomaly Detection (CAD) is free ML that learns your normal per-service spend and flags deviations you never thought to threshold. For triage its killer feature is the root-cause list attached to every anomaly — it does levels 1–3 of the funnel for you.
Monitors — what CAD watches
| Monitor type | API shape | Watches | Best for |
|---|---|---|---|
| AWS services (recommended) | DIMENSIONAL, MonitorDimension=SERVICE |
Every service, scored individually | Default; catches any service spiking |
| Linked account | CUSTOM + account filter |
One member account | Per-team accountability |
| Cost category | CUSTOM + cost-category filter |
A business bucket | Per-product / BU |
| Cost allocation tag | CUSTOM + tag filter |
A specific tag key/value | Per-project |
Start with the AWS services monitor — one object, covers everything. Add CUSTOM monitors for the tags, accounts, or cost categories that map to teams so a spike is auto-attributed the moment it fires.
Alert subscriptions — how you hear about it
| Setting | Options | Notes |
|---|---|---|
| Threshold | Absolute $ or % impact |
ANOMALY_TOTAL_IMPACT_ABSOLUTE ≥ 50, or _PERCENTAGE ≥ 20 |
| Frequency | IMMEDIATE / DAILY / WEEKLY |
IMMEDIATE = per-anomaly email (email only); SNS needs DAILY/WEEKLY digest or IMMEDIATE via email |
| Delivery | Email or SNS topic | SNS for Slack/PagerDuty fan-out |
| Recipients | Emails / SNS ARN | Route to the owning team |
Reading a detected anomaly — the fields that matter
When you call aws ce get-anomalies, each anomaly is a compact triage report. These are the fields to read, in order:
| Field | What it tells you | How you use it |
|---|---|---|
AnomalyStartDate / AnomalyEndDate |
The window it detected | The onset — correlate with changes |
Impact.TotalImpact |
$ above expected | Prioritise (is this $20 or $2,000?) |
Impact.TotalActualSpend / TotalExpectedSpend |
Actual vs baseline | The size of the deviation |
DimensionValue |
The service that spiked | Level 1 done |
RootCauses[].Service |
Service per root cause | Confirms the service |
RootCauses[].Region |
Region per root cause | Level 3 (where) |
RootCauses[].UsageType |
The meter | Level 2 done — the key field |
RootCauses[].LinkedAccount |
Which org account | Level 3 (who) |
The RootCauses[].UsageType field is the payoff: CAD hands you the meter (USE1-DataProcessing-Bytes, say) without you touching Cost Explorer. You go straight to the CUR to pin the resource.
# List anomalies in a window (add --max-results and paginate for busy accounts)
aws ce get-anomalies \
  --date-interval StartDate=2026-07-01,EndDate=2026-07-14 \
  --query 'Anomalies[].{start:AnomalyStartDate,impact:Impact.TotalImpact,svc:DimensionValue,causes:RootCauses[].{svc:Service,region:Region,usage:UsageType,acct:LinkedAccount}}' \
  --output json
# Create the recommended all-services monitor + a $50-impact IMMEDIATE email subscription
aws ce create-anomaly-monitor --anomaly-monitor \
  '{"MonitorName":"all-services","MonitorType":"DIMENSIONAL","MonitorDimension":"SERVICE"}'

aws ce create-anomaly-subscription --anomaly-subscription '{
  "SubscriptionName":"anomalies-over-50",
  "MonitorArnList":["arn:aws:ce::111122223333:anomalymonitor/REPLACE"],
  "Frequency":"IMMEDIATE",
  "Subscribers":[{"Type":"EMAIL","Address":"finops@example.com"}],
  "ThresholdExpression":{"Dimensions":{"Key":"ANOMALY_TOTAL_IMPACT_ABSOLUTE","Values":["50"],"MatchOptions":["GREATER_THAN_OR_EQUAL"]}}
}'
resource "aws_ce_anomaly_monitor" "services" {
  name              = "all-services"
  monitor_type      = "DIMENSIONAL"
  monitor_dimension = "SERVICE"
}

# A CUSTOM monitor scoped to a team tag, so its spikes are pre-attributed
resource "aws_ce_anomaly_monitor" "payments_team" {
  name         = "team-payments"
  monitor_type = "CUSTOM"
  monitor_specification = jsonencode({
    Tags = { Key = "team", Values = ["payments"], MatchOptions = ["EQUALS"] }
  })
}

resource "aws_ce_anomaly_subscription" "over_50" {
  name             = "anomalies-over-50"
  frequency        = "IMMEDIATE"
  monitor_arn_list = [aws_ce_anomaly_monitor.services.arn]

  subscriber {
    type    = "EMAIL"
    address = "finops@example.com"
  }

  threshold_expression {
    dimension {
      key           = "ANOMALY_TOTAL_IMPACT_ABSOLUTE"
      values        = ["50"]
      match_options = ["GREATER_THAN_OR_EQUAL"]
    }
  }
}
CAD needs about 10 days of history to build a baseline, evaluates roughly 3×/day, and will not catch a slow, steady creep that never deviates sharply (that is a job for the monthly Cost Explorer review). Use aws ce provide-anomaly-feedback to mark false positives so the model learns your real pattern.
Decoding a usage type (the reference)
The usage type is the Rosetta Stone of AWS billing. Once you can read the string, you can name the culprit from the meter alone. Bookmark this section — it is the reference you will come back to every time.
Anatomy of a usage-type string
A usage type is [<RegionPrefix>-]<Meter>[.<Dimension>]. The region prefix tells you where; the meter tells you what; the dimension refines it.
| Part | Examples | Meaning |
|---|---|---|
| Region prefix | USE1 (N. Virginia), USW2 (Oregon), APS3 (Mumbai), EUW1 (Ireland) |
The region; absent = us-east-1 (legacy) |
| Meter | NatGateway-Bytes, DataTransfer-Out-Bytes, BoxUsage, TimedStorage-ByteHrs |
The billed dimension |
| Sub-dimension | .gp3, .db.t3.micro, -SIA |
Storage class, instance size, tier |
| Region-pair | USE1-EUW1-AWS-Out-Bytes |
Inter-region transfer, source→dest |
So APS3-NatGateway-Bytes = “NAT gateway data processed, in Mumbai,” and USE1-EUW1-AWS-Out-Bytes = “data transferred from N. Virginia to Ireland.” When you see a region prefix that is not where you thought your workload lived, that alone is a finding.
Compute & EC2-Other meters
The EC2-Other bucket is where the most surprising costs hide — none of these are “an instance.”
| Usage type | Meter | Rough rate (us-east-1) | Culprit signature |
|---|---|---|---|
BoxUsage:<type> |
On-Demand instance hours | Per instance type | Forgotten running instance |
SpotUsage:<type> |
Spot instance hours | Variable | Runaway Spot fleet |
NatGateway-Hours |
NAT gateway existence | ~$0.045/hr each | Extra per-AZ NAT gateways |
NatGateway-Bytes |
NAT data processing | ~$0.045/GB | Chatty egress through NAT |
EBS:VolumeUsage.gp3 |
gp3 volume-months | ~$0.08/GB-mo | Orphaned / unattached volume |
EBS:VolumeP-IOPS.gp3 |
gp3 provisioned IOPS | ~$0.005/IOPS-mo | Over-provisioned IOPS |
EBS:VolumeUsage.piops |
io1/io2 volume-months | ~$0.125/GB-mo | Expensive io2 left running |
EBS:SnapshotUsage |
Snapshot storage | ~$0.05/GB-mo | Snapshots with no lifecycle |
ElasticIP:IdleAddress |
Unattached EIP | ~$0.005/hr | Released instance, kept EIP |
PublicIPv4:InUseAddress |
Any public IPv4 (since 2024) | ~$0.005/hr | Many public IPs |
VpcEndpoint-Hours |
Interface endpoint existence | ~$0.01/hr each | Endpoints in every AZ |
VpcEndpoint-Bytes |
Interface endpoint data | ~$0.01/GB | High-volume PrivateLink |
Data-transfer meters — the invisible family
Data transfer is the meter with no resource. This table is the decoder for every transfer path.
| Usage type | Path | Rough rate | Free tier |
|---|---|---|---|
DataTransfer-In-Bytes |
Internet → AWS | $0.00 | Always free |
DataTransfer-Out-Bytes |
AWS → internet | ~$0.09/GB (first 10 TB) | 100 GB/mo aggregate |
DataTransfer-Regional-Bytes |
Cross-AZ, same region | ~$0.01/GB each way | No |
<src>-<dst>-AWS-Out-Bytes |
Cross-region | ~$0.02/GB (varies by pair) | No |
DataTransfer-Out-OBytes (CloudFront) |
CloudFront → internet | ~$0.085/GB (first 10 TB) | 1 TB/mo always free |
<prefix>-DataTransfer-Regional-Bytes |
Cross-AZ in a named region | ~$0.01/GB each way | No |
PublicIP-In/-Out |
Traffic over a public IP within AWS | Small per-GB | No |
The trap most teams fall into: cross-AZ (DataTransfer-Regional-Bytes) is billed on both ends — sender and receiver each pay ~$0.01/GB, so a chatty app-to-database conversation across AZs is effectively ~$0.02/GB round-trip. A Kafka cluster or a read-replica set spread “for resilience” across three AZs can quietly meter terabytes.
S3 meters — storage, requests, retrieval, early-delete, replication
S3 has the richest meter set, and spikes here are usually requests (a loop) or retrieval / early-delete (a bad lifecycle policy), not storage.
| Usage type | Meter | Rough rate | Culprit signature |
|---|---|---|---|
TimedStorage-ByteHrs |
Standard storage | ~$0.023/GB-mo | Steady growth (not usually a spike) |
TimedStorage-INT-* |
Intelligent-Tiering storage | Tiered | Auto-tiered data |
Requests-Tier1 |
PUT/COPY/POST/LIST | ~$0.005/1,000 | Write storm / S3-as-a-queue |
Requests-Tier2 |
GET/SELECT and others | ~$0.0004/1,000 | Read loop / per-object polling |
Retrieval-SIA |
Standard-IA retrieval | ~$0.01/GB | Reading data you tiered to IA |
Retrieval-GLACIER / -GIR |
Glacier retrieval | Varies by speed | Restoring archives |
EarlyDelete-SIA |
Delete IA before 30 days | Pro-rated storage | Short-lived data in IA |
EarlyDelete-GDA |
Delete Deep Archive before 180 days | Pro-rated | Wrong lifecycle target |
Monitoring-INT |
Intelligent-Tiering per-object fee | ~$0.0025/1,000 obj | Millions of tiny objects |
S3-RTC-Bytes |
Replication Time Control | Per-GB | CRR with RTC enabled |
<src>-<dst>-AWS-Out-Bytes |
Cross-region replication transfer | ~$0.02/GB | Broad CRR scope |
CloudWatch meters — the silent giant
CloudWatch Logs ingestion is the single most common “where did that come from?” spike, because logging volume scales with traffic and log level, and nobody watches it.
| Usage type | Meter | Rough rate | Culprit signature |
|---|---|---|---|
<prefix>-DataProcessing-Bytes |
Logs ingestion (Standard) | ~$0.50/GB | Debug logging, ALL VPC Flow Logs |
<prefix>-VendedLog-Bytes |
Logs ingestion (Infrequent Access) | ~$0.25/GB | Lower-cost log class |
<prefix>-TimedStorage-ByteHrs |
Logs storage | ~$0.03/GB-mo | Log groups with no retention |
<prefix>-DataScanned-Bytes |
Logs Insights query scan | ~$0.005/GB | Heavy Insights dashboards |
CW:MetricMonitorUsage |
Custom metrics | ~$0.30/metric/mo | High-cardinality custom metrics |
CW:AlarmMonitorUsage |
Alarms | ~$0.10/alarm/mo | Thousands of per-resource alarms |
CW:Requests |
GetMetricData / PutMetricData | Per 1,000 | Scripted polling |
CW:GMD-Metrics |
GetMetricData metrics | Per 1,000 | Dashboards / Grafana pulling hard |
KMS, Secrets Manager & other per-request meters
Per-request meters spike when an app hits them in a hot loop instead of caching.
| Usage type | Service | Rough rate | Culprit signature |
|---|---|---|---|
<prefix>-KMS-Requests |
KMS | ~$0.03/10,000 | Decrypting per-request, no data-key cache |
KMS-Keys |
KMS | ~$1/key/mo | Sprawl of CMKs |
<prefix>-AWS-Secrets |
Secrets Manager | ~$0.40/secret/mo | Secret-per-tenant sprawl |
<prefix>-APIRequest |
Secrets Manager | ~$0.05/10,000 | Fetching a secret every invocation |
SSM:ParameterStoreAdvanced |
SSM Parameter Store | ~$0.05/param/mo | Advanced-tier params |
Requests (Step Functions) |
Step Functions Express | Per request + duration | Fan-out loop |
Provisioned-but-idle meters — capacity billing 24×7
These bill for existence, not use — a stopped-looking service still charging because capacity is provisioned. Spikes here are usually “someone launched it and forgot,” or “traffic dropped but capacity didn’t.”
| Usage type | Service | Bills for | Fix direction |
|---|---|---|---|
InstanceUsage:db.<type> |
RDS | Instance-hours (running) | Stop dev; scheduler |
Multi-AZUsage:db.<type> |
RDS | Doubled for Multi-AZ | Single-AZ for non-prod |
RDS:GP2-Storage / RDS:PIOPS |
RDS | Allocated storage / IOPS | Right-size storage |
ESInstance:<type> / OpenSearch:<type> |
OpenSearch | Node-hours | Right-size / delete domain |
ES:<...>-Storage |
OpenSearch | EBS per node | Reduce shards/replicas |
Shard-Hour |
Kinesis Data Streams | Provisioned shards | On-demand mode; scale down |
Kafka.<type> |
MSK | Broker-hours + storage | Right-size brokers; MSK Serverless |
WriteCapacityUnit-Hrs / ReadCapacityUnit-Hrs |
DynamoDB | Provisioned WCU/RCU | On-demand or autoscaling |
Aurora:ServerlessV2Usage |
Aurora | ACU-hours | Set a sane min ACU |
ClusterUsage:<type> |
Redshift / EMR | Cluster-hours | Pause / terminate idle |
Security & governance meters — the cross-region multiplier
These are cheap per-unit but multiply across regions and accounts, so enabling them org-wide “to be safe” is a classic slow-burn spike.
| Usage type | Service | Bills for | Culprit signature |
|---|---|---|---|
PaidEventsAnalyzed-Bytes |
GuardDuty | CloudTrail events analysed | Enabled in all regions/accounts |
VPCFlowLogsAndDNSLogs-Bytes |
GuardDuty | Flow-log + DNS analysis | High-traffic VPCs |
S3Data-Bytes / Runtime-* |
GuardDuty | S3 / EKS / runtime protection | New protection plan turned on |
ConfigurationItemRecorded |
AWS Config | Each config item recorded | Recording ephemeral resources |
ConfigRuleEvaluations |
AWS Config | Rule evaluations | Chatty rules over many resources |
PaidStorage-Bytes |
Security Lake / Detective | Ingested data | Broad ingestion scope |
CUR + Athena: line-item drill-down to a resource ID
Cost Explorer stops at the meter and lags; the Cost and Usage Report (CUR) pins the resource, at hourly granularity, in SQL, with unlimited history. This is where you turn “it’s CloudWatch Logs ingestion” into “it’s /aws/lambda/order-processor, starting 09 Jul 14:00, 31 GB/day.” Enable the CUR with resource IDs on and the Athena integration before you need it — a new CUR only collects from today forward.
The CUR columns you actually query
| Athena column | CUR field | Role in the drill-down |
|---|---|---|
line_item_product_code |
lineItem/ProductCode |
Service (funnel L1) |
line_item_usage_type |
lineItem/UsageType |
Meter (funnel L2) — the key filter |
line_item_operation |
lineItem/Operation |
API operation (S3/DDB splits) |
line_item_resource_id |
lineItem/ResourceId |
Resource (funnel L4) — needs resource IDs on |
line_item_unblended_cost |
lineItem/UnblendedCost |
The dollars you SUM() |
line_item_usage_amount |
lineItem/UsageAmount |
Quantity (GB, hours, requests) |
line_item_usage_start_date |
lineItem/UsageStartDate |
Hour (funnel L5) |
line_item_availability_zone |
lineItem/AvailabilityZone |
Cross-AZ evidence |
line_item_usage_account_id |
lineItem/UsageAccountId |
Account (funnel L3) |
line_item_line_item_type |
lineItem/LineItemType |
Filter to Usage (drop tax/credits) |
resource_tags_user_<key> |
resourceTags/user:<key> |
Owner (funnel L6) |
bill_billing_period_start_date |
bill/BillingPeriodStartDate |
Partition — always constrain it |
Note on CUR versions: legacy CUR (the classic Athena integration) uses the column names above. CUR 2.0 / Data Exports uses the same snake_case names for these core columns, so the queries port with minimal change. Always constrain
bill_billing_period_start_date(or the CUR 2.0billing_period) so Athena prunes partitions and the scan stays cheap.
The query catalog — five queries that walk the funnel
Run these in order; each takes the output of the last as a filter. Replace the table/database names with your CUR’s (the Athena integration creates a database like athenacurcfn_<report> and a table named for the report).
-- Q1 · Rank services for the billing period (funnel L1)
SELECT line_item_product_code AS service,
       round(sum(line_item_unblended_cost), 2) AS cost
FROM   cur
WHERE  bill_billing_period_start_date = DATE '2026-07-01'
  AND  line_item_line_item_type = 'Usage'
GROUP  BY 1
ORDER  BY 2 DESC
LIMIT  20;
-- Q2 · Split the top service into meters (funnel L2)
SELECT line_item_usage_type AS usage_type,
       round(sum(line_item_unblended_cost), 2) AS cost,
       round(sum(line_item_usage_amount),   2) AS quantity
FROM   cur
WHERE  line_item_product_code = 'AmazonEC2'          -- the service Q1 surfaced
  AND  line_item_usage_start_date >= TIMESTAMP '2026-07-08 00:00:00'
  AND  line_item_line_item_type = 'Usage'
GROUP  BY 1
ORDER  BY 2 DESC
LIMIT  25;
-- Q3 · Pin the resource + AZ for the culprit meter (funnel L4)
SELECT line_item_resource_id      AS resource,
       line_item_availability_zone AS az,
       round(sum(line_item_unblended_cost), 2) AS cost,
       round(sum(line_item_usage_amount),   2) AS gb
FROM   cur
WHERE  line_item_usage_type LIKE '%NatGateway-Bytes%'  -- the meter Q2 surfaced
  AND  bill_billing_period_start_date = DATE '2026-07-01'
GROUP  BY 1, 2
ORDER  BY 3 DESC
LIMIT  25;
-- Q4 · Find the onset day/hour (funnel L5) — did it kink on a deploy?
SELECT date_trunc('hour', line_item_usage_start_date) AS hour,
       round(sum(line_item_unblended_cost), 2) AS cost
FROM   cur
WHERE  line_item_resource_id = 'nat-0abc123def456'     -- the resource Q3 surfaced
GROUP  BY 1
ORDER  BY 1;
-- Q5 · Attribute it to an owner (funnel L6)
SELECT COALESCE(resource_tags_user_team, '(untagged)') AS team,
       round(sum(line_item_unblended_cost), 2) AS cost
FROM   cur
WHERE  line_item_product_code = 'AmazonCloudWatch'
  AND  bill_billing_period_start_date = DATE '2026-07-01'
GROUP  BY 1
ORDER  BY 2 DESC;
A sixth query pattern earns its keep for S3 and DynamoDB, where the cost is operation-driven: group by line_item_operation to see whether a GetObject read loop or a PutItem write storm is the driver, and join count(*) to see the raw record explosion.
-- Q6 · Request-driven cost: which operation is the storm? (S3/DynamoDB)
SELECT line_item_operation AS op,
       count(*)            AS line_items,
       round(sum(line_item_unblended_cost), 2) AS cost
FROM   cur
WHERE  line_item_product_code = 'AmazonS3'
  AND  line_item_usage_start_date >= TIMESTAMP '2026-07-09 00:00:00'
GROUP  BY 1
ORDER  BY 3 DESC
LIMIT  20;
Budgets and budget actions: contain the bleed
When triage reveals an active runaway — a loop still hammering S3, a fleet still scaling — you do not want to finish the diagnosis while the meter keeps spinning. AWS Budgets with a budget action is the closest AWS has to a hard stop. It still fires on the delayed budget evaluation, so it is containment, not a real-time circuit-breaker, but it stops an overnight bleed from becoming a week-long one.
| Action type | Effect | Applies to | Use for |
|---|---|---|---|
| Apply IAM policy | Attach a restrictive/Deny policy | Users / groups / roles | Freeze a compromised principal |
| Apply SCP | Attach a Service Control Policy | OUs / member accounts | Freeze a runaway account (org) |
| Stop EC2 instances | Stop specified running instances | Tagged EC2 | Halt a runaway fleet |
| Stop RDS instances | Stop specified DB instances | Tagged RDS | Halt an idle/forgotten DB |
Scope the budget tightly so the action is surgical, and prefer approval-required for anything that applies a Deny policy — an auto-applied SCP that fires on a forecast blip can lock a team out of the account.
| Budget scope filter | Containment use |
|---|---|
| Service | Cap a single runaway service |
| Linked account | Ring-fence one account’s spend |
| Tag | Cap a team/project/env |
| Usage type | Cap a specific meter (e.g. NAT bytes) |
| Region | Cap an unexpected region |
# A forecasted 100% alert is your early spike warning; pair it with an action.
aws budgets create-budget \
  --account-id 111122223333 \
  --budget file://spike-guard-budget.json \
  --notifications-with-subscribers file://spike-guard-notify.json
# Approval-required action: stop tagged non-prod EC2 if a scoped budget is blown
resource "aws_budgets_budget_action" "freeze_nonprod_ec2" {
  budget_name        = aws_budgets_budget.nonprod.name
  action_type        = "RUN_SSM_DOCUMENTS"
  approval_model     = "MANUAL"
  notification_type  = "ACTUAL"
  execution_role_arn = aws_iam_role.budget_action.arn

  action_threshold {
    action_threshold_type  = "PERCENTAGE"
    action_threshold_value = 100
  }

  definition {
    ssm_action_definition {
      action_sub_type = "STOP_EC2_INSTANCES"
      region          = "ap-south-1"
      instance_ids    = []   # target by tag via the SSM document/resource group
    }
  }

  subscriber {
    address           = "finops@example.com"
    subscription_type = "EMAIL"
  }
}
Full Budgets setup — types, thresholds, actual vs forecasted, the SNS topic policy gotcha — lives in the companion AWS Cost Control 101. Here the point is narrow: a scoped, forecasted budget with an action is your containment while you run the funnel.
Attributing the spike: tags, cost categories, and RI/SP coverage gaps
A correct diagnosis you cannot route is only half a fix. Attribution turns “an over-provisioned Kinesis stream” into “the analytics team’s clickstream stream” — a ticket, not a mystery.
| Method | Granularity | Requires | Best for |
|---|---|---|---|
| Cost allocation tags | Per-resource | Tag keys activated (~24h lag) | Team / project / env ownership |
| Cost Categories | Business bucket | Rules on tags/accounts/services | Product / BU chargeback |
| Linked account | Per-account | Multi-account org | Team-per-account models |
| Resource ID (CUR) | Exact resource | CUR resource IDs on | The literal thing to fix |
The catch: only tags activated as cost-allocation tags appear in Cost Explorer and the CUR, and only from activation forward (no back-fill). An untagged spike shows up as (untagged) in Q5 above — which is itself a finding: it tells you the resource predates your tagging policy or was created outside IaC. Enforcement (so this does not recur) is covered in AWS Tagging Strategy and Cost-Allocation Enforcement.
The spike that is really a coverage gap
Not every increase is new usage. A very common false spike is a Reserved Instance or Savings Plan expiring — the underlying usage is unchanged, but it flips from a discounted rate to full On-Demand overnight, and the daily cost jumps.
| Signal | What it means | Confirm |
|---|---|---|
| On-Demand line jumps, usage flat | RI/SP expired or coverage dropped | CE group by Purchase Option; SP Coverage report |
DiscountedUsage lines vanish |
RIs ended | CUR line_item_line_item_type change |
| Coverage % falls in the report | Usage grew past commitment | CE Savings Plans Coverage report |
| One big up-front line, one day | New RI/SP purchase (not a leak) | Switch to amortized cost type |
Always group a compute spike by Purchase Option before you go hunting for a runaway — if the usage is flat and only the rate changed, the fix is buying or renewing a commitment, not deleting anything.
Architecture at a glance
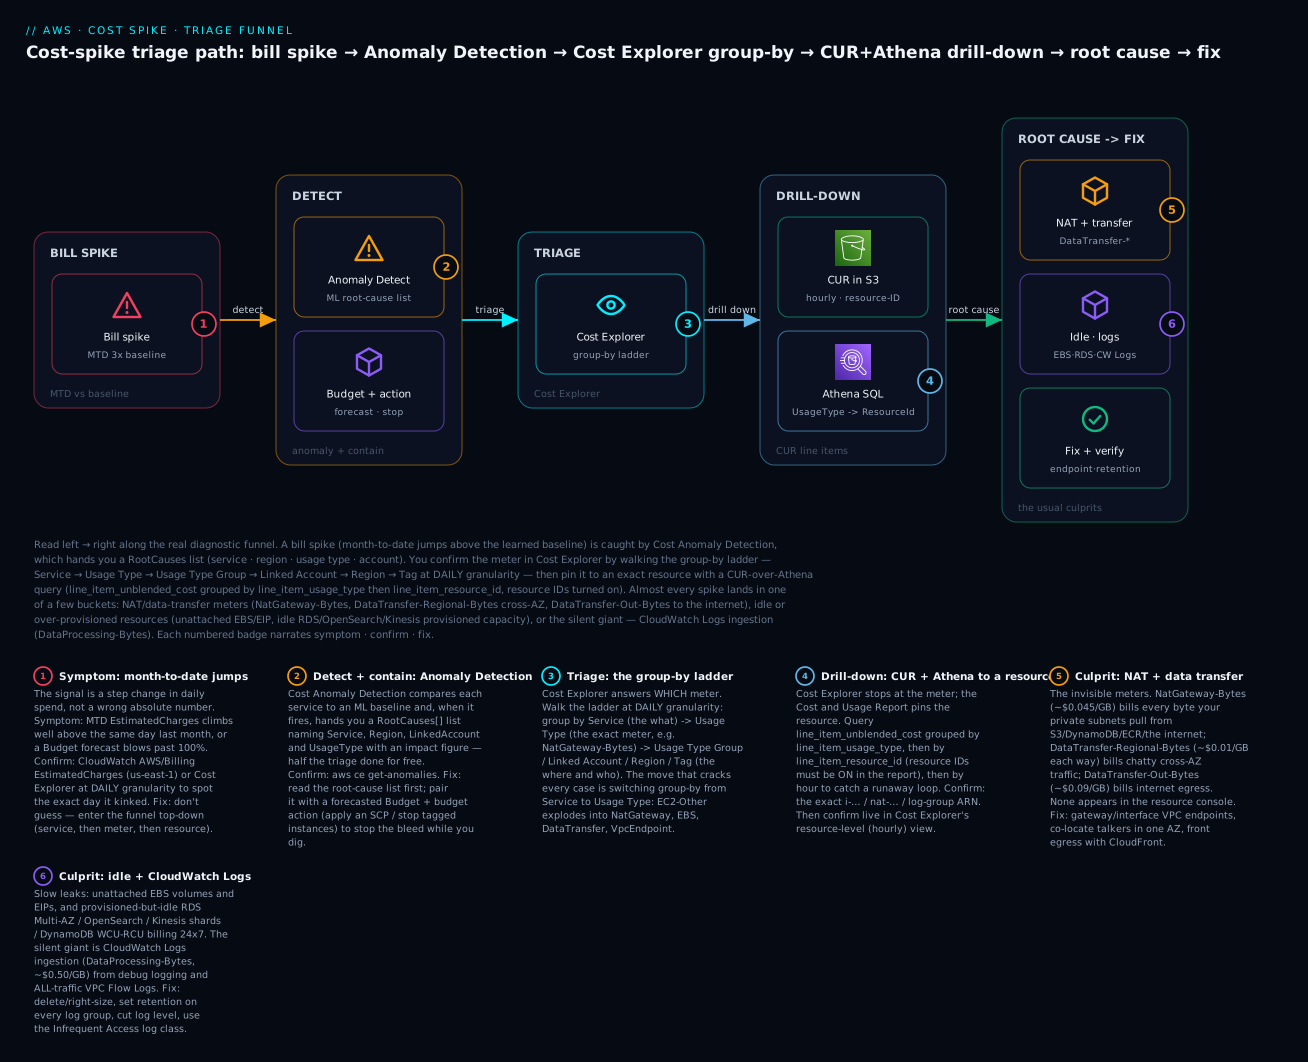
The diagram traces the triage funnel as a left-to-right pipeline, from the moment the bill kinks to the moment you hand a fix to the owning team, with six numbered badges on the exact points where the diagnosis is won or lost. Start at BILL SPIKE (badge 1): the signal is a step change in daily spend — month-to-date climbing well above the same day last month — which you confirm on the AWS/Billing EstimatedCharges metric or a Cost Explorer daily trend, reading the exact day it kinked. That signal is caught at DETECT: Cost Anomaly Detection compares each service to an ML baseline and, when it fires, hands you a RootCauses list already naming the service, region, and usage type (badge 2) — half the funnel done for free — while a scoped, forecasted Budget with a budget action stands ready to stop an active bleed.
You confirm the meter at TRIAGE: Cost Explorer, walked down the group-by ladder — Service → Usage Type → Usage Type Group → Linked Account → Region → Tag, at daily granularity (badge 3) — where the decisive move is switching group-by from Service to Usage Type, exploding the opaque “EC2-Other” into NatGateway, EBS, and DataTransfer meters. Then you pin the resource at DRILL-DOWN: the CUR landing hourly line items in S3, queried by Athena — line_item_unblended_cost grouped by line_item_usage_type, then by line_item_resource_id, then by hour (badge 4) — which names the exact nat-… / log-group / i-… and the onset hour. Finally, ROOT CAUSE → FIX sorts almost every spike into three buckets: NAT + data transfer meters — NatGateway-Bytes, cross-AZ DataTransfer-Regional-Bytes, internet DataTransfer-Out-Bytes (badge 5) — and idle / logs — unattached EBS/EIP, idle provisioned RDS/OpenSearch/Kinesis/DynamoDB, and the silent giant, CloudWatch Logs DataProcessing-Bytes ingestion (badge 6) — each with its structural fix: VPC endpoints, AZ co-location, deletion/right-sizing, and log retention. Read the legend as symptom · confirm · fix for each number.
Real-world scenario
LedgerLoop, a 40-person fintech in Pune, ran a multi-account AWS Organization with a shared platform account for observability and CI. On the 12th, the FinOps analyst got a Cost Anomaly Detection email: impact $1,490, service AmazonCloudWatch, in the platform account. The month-to-date for CloudWatch had gone from a steady ~$260 to a run-rate that would land near $1,800 — a nearly 7× jump on a service nobody thought about.
The triage took eighteen minutes and followed the funnel exactly. The anomaly’s RootCauses already named the meter: APS3-DataProcessing-Bytes — CloudWatch Logs ingestion in Mumbai. Level 1 and 2 were done for free. In Cost Explorer, filtering Service = CloudWatch and grouping by Usage Type at daily granularity confirmed it: ingestion was flat at ~8 GB/day until the 9th, then jumped to ~55 GB/day and stayed there. The onset day was the clue. A quick check of the deploy log showed a release to the order-processor Lambda on the 9th.
Now for the resource. In Athena over the CUR, query Q2 (filter AmazonCloudWatch, group by usage type) reconfirmed the meter; query Q3 (filter %DataProcessing-Bytes%, group by line_item_resource_id) named the resource unambiguously: /aws/lambda/order-processor, responsible for $1,410 of the $1,490. Query Q4 (group that resource by hour) showed the ingestion climbing from 14:00 on the 9th — precisely the deploy time. The cause was mundane and expensive: a developer had left a logger.debug(JSON.stringify(event)) in a hot path, and every invocation now shipped the full event payload — a few KB × millions of invocations × $0.50/GB ingestion.
The fixes were layered. Immediate: drop the log level to INFO in a hotfix (killed 85% of the volume) and set 7-day retention on the log group (it had been “Never expire,” so storage had been quietly accruing too). Structural: move the group to the Infrequent Access log class (~$0.25/GB) for the still-verbose paths, add a metric filter instead of logging raw events, and put a CloudWatch usage budget on Logs ingestion GB with a forecasted alert at 120% of baseline so the next debug-log regression trips on day one. Attribution: the platform account’s log groups were now tagged team=payments via a Config rule, so the ticket routed itself. The next month’s CloudWatch bill was $240 — below where it started, because the retention fix cleaned up months of accumulated storage. Total triage cost: one anomaly email, a dozen Cost Explorer clicks, and about $0.30 of Athena scan.
Advantages and disadvantages
Any spike-triage practice built on these tools has a characteristic shape — fast and precise once set up, but always retrospective.
| Advantages | Disadvantages |
|---|---|
| Anomaly Detection root-causes the service + meter for free | Needs ~10 days of history; misses slow creeps |
| Cost Explorer needs no setup beyond the one-time enable | Lags up to ~24h; resource-level is a paid opt-in |
| CUR pins the exact resource, hour, and tag in SQL | Must be enabled before the spike (no back-fill) |
| The funnel is a repeatable drill, not improvisation | Only as good as your tagging for attribution |
| Usage-type decoding names culprits with no resource | Meter strings are cryptic until you learn them |
| Budget actions can contain an active runaway | Actions fire on delayed evaluation — not real-time |
| Athena scans are cheap on partitioned Parquet | Unpartitioned/CSV CUR queries get slow and costly |
The through-line: these tools make you fast and certain after the fact, never instantaneous. The real-time job belongs to guardrails set up in advance (scoped budgets, anomaly monitors, service quotas); triage is what you do in the ~24-hour window after they fire. Set the CUR up now, learn the meters now, and the actual incident is a calm drill.
Hands-on lab
You will stand up the triage stack — a Cost Anomaly Detection monitor and a scoped Budget — then run a CUR-over-Athena query set that walks a spike from service to usage type to resource ID, and confirm it live in Cost Explorer’s resource-level view. Everything here is free or costs cents (Anomaly Detection is free; the first two budgets are free; Athena scans on a partitioned CUR are pennies). It assumes a CUR with resource IDs + Athena integration already delivering to S3 — if you do not have one, Part A creates it, but note it only collects data from today forward.
⚠️ Cost note: Anomaly Detection is free. The first two budgets are free (then $0.02/budget/day). Athena bills ~$5/TB scanned — partitioned Parquet keeps a query to cents. Cost Explorer’s hourly/resource-level opt-in is paid (~$0.01/1,000 records/mo) — turn it off after the lab if you enabled it.
Part A — Ensure a CUR with resource IDs + Athena (CLI / Terraform)
# CUR lives in us-east-1. Create an hourly, Parquet, resource-level report with Athena integration.
aws cur put-report-definition --region us-east-1 --report-definition '{
  "ReportName":"kloudvin-cur",
  "TimeUnit":"HOURLY",
  "Format":"Parquet",
  "Compression":"Parquet",
  "AdditionalSchemaElements":["RESOURCES"],
  "S3Bucket":"kloudvin-cur-111122223333",
  "S3Prefix":"cur",
  "S3Region":"us-east-1",
  "AdditionalArtifacts":["ATHENA"],
  "ReportVersioning":"OVERWRITE_REPORT"
}'

# Verify
aws cur describe-report-definitions --region us-east-1 \
  --query 'ReportDefinitions[?ReportName==`kloudvin-cur`].[ReportName,TimeUnit,Format,AdditionalSchemaElements]' \
  --output table
resource "aws_cur_report_definition" "cur" {
  provider                   = aws.use1
  report_name                = "kloudvin-cur"
  time_unit                  = "HOURLY"
  format                     = "Parquet"
  compression                = "Parquet"
  additional_schema_elements = ["RESOURCES"]   # RESOURCES = per-resource line_item_resource_id
  s3_bucket                  = aws_s3_bucket.cur.id
  s3_region                  = "us-east-1"
  s3_prefix                  = "cur"
  additional_artifacts       = ["ATHENA"]       # drops the Glue/Athena setup into the bucket
  report_versioning          = "OVERWRITE_REPORT"
}
Expected: the report lists with RESOURCES in its schema elements. The Athena artifact makes AWS place a CloudFormation template + Glue crawler in the bucket that create a database athenacurcfn_kloudvin_cur and a table kloudvin_cur once the first data lands (allow up to ~24h for the first delivery).
Part B — Anomaly Detection monitor + subscription (CLI)
# All-services monitor
MON_ARN=$(aws ce create-anomaly-monitor --anomaly-monitor \
  '{"MonitorName":"all-services","MonitorType":"DIMENSIONAL","MonitorDimension":"SERVICE"}' \
  --query MonitorArn --output text)
echo "$MON_ARN"

# Email me whenever an anomaly's impact >= $20
aws ce create-anomaly-subscription --anomaly-subscription "{
  \"SubscriptionName\":\"anomalies-over-20\",
  \"MonitorArnList\":[\"$MON_ARN\"],
  \"Frequency\":\"IMMEDIATE\",
  \"Subscribers\":[{\"Type\":\"EMAIL\",\"Address\":\"finops@example.com\"}],
  \"ThresholdExpression\":{\"Dimensions\":{\"Key\":\"ANOMALY_TOTAL_IMPACT_ABSOLUTE\",\"Values\":[\"20\"],\"MatchOptions\":[\"GREATER_THAN_OR_EQUAL\"]}}
}"

# Verify the monitor exists
aws ce get-anomaly-monitors --query 'AnomalyMonitors[].[MonitorName,MonitorArn]' --output table
Expected: the monitor lists; you will receive an email the first time a service deviates by ≥ $20. To see any anomalies already detected: aws ce get-anomalies --date-interval Start=2026-07-01,End=2026-07-14.
Part C — A scoped containment Budget (CLI)
Create cw-logs-budget.json — a usage budget on CloudWatch that trips if ingestion runs hot:
{
  "BudgetName": "cw-logs-guard",
  "BudgetLimit": { "Amount": "50", "Unit": "USD" },
  "TimeUnit": "MONTHLY",
  "BudgetType": "COST",
  "CostFilters": { "Service": ["AmazonCloudWatch"] }
}
aws budgets create-budget \
  --account-id 111122223333 \
  --budget file://cw-logs-budget.json \
  --notifications-with-subscribers '[{
    "Notification":{"NotificationType":"FORECASTED","ComparisonOperator":"GREATER_THAN","Threshold":100,"ThresholdType":"PERCENTAGE"},
    "Subscribers":[{"SubscriptionType":"EMAIL","Address":"finops@example.com"}]
  }]'
Expected: a $50/month CloudWatch-scoped budget with a forecasted 100% alert — an early warning specifically for a Logs-ingestion regression.
Part D — Walk a spike through Athena (the drill-down)
Run the funnel queries. The CLI submits to Athena and polls for the result location.
DB="athenacurcfn_kloudvin_cur"
OUT="s3://kloudvin-athena-results-111122223333/"

run_query () {
  QID=$(aws athena start-query-execution \
    --query-string "$1" \
    --query-execution-context Database=$DB \
    --result-configuration OutputLocation=$OUT \
    --query QueryExecutionId --output text)
  # Poll until it finishes
  until aws athena get-query-execution --query-execution-id "$QID" \
    --query 'QueryExecution.Status.State' --output text | grep -qE 'SUCCEEDED|FAILED'; do sleep 2; done
  aws athena get-query-results --query-execution-id "$QID" \
    --query 'ResultSet.Rows[].Data[].VarCharValue' --output text
}

# L1 — rank services this period
run_query "SELECT line_item_product_code, round(sum(line_item_unblended_cost),2) c
           FROM kloudvin_cur
           WHERE bill_billing_period_start_date = DATE '2026-07-01'
             AND line_item_line_item_type='Usage'
           GROUP BY 1 ORDER BY 2 DESC LIMIT 10;"

# L2 — split the top service into meters
run_query "SELECT line_item_usage_type, round(sum(line_item_unblended_cost),2) c
           FROM kloudvin_cur
           WHERE line_item_product_code='AmazonCloudWatch'
             AND bill_billing_period_start_date = DATE '2026-07-01'
           GROUP BY 1 ORDER BY 2 DESC LIMIT 15;"

# L4 — pin the resource for the culprit meter
run_query "SELECT line_item_resource_id, round(sum(line_item_unblended_cost),2) c
           FROM kloudvin_cur
           WHERE line_item_usage_type LIKE '%DataProcessing-Bytes%'
             AND bill_billing_period_start_date = DATE '2026-07-01'
           GROUP BY 1 ORDER BY 2 DESC LIMIT 15;"
Expected: L1 shows the service ranking; L2 names the meter (e.g. APS3-DataProcessing-Bytes); L4 prints the log-group ARN carrying the cost. That log-group ARN is your fix target.
Part E — Confirm live in Cost Explorer (resource-level)
- Billing → Cost Explorer → Preferences → enable hourly and resource-level data (paid opt-in; back-fills ~24h).
- New report → Filter Service = CloudWatch, Group by = Usage Type, Granularity = Daily, last 30 days. Confirm the meter and the onset day match Athena.
- Add Filter Usage Type =
*DataProcessing-Bytes, switch Group by = Resource → confirm the same resource the CUR named.
Expected: Cost Explorer’s resource-level rows agree with Athena — meter, resource, and onset day. Two independent tools confirming the same resource is your green light to act.
Part F — Teardown
# Remove the lab's monitor, subscription, budget. (Leave the CUR — it's your history.)
aws ce delete-anomaly-subscription --subscription-arn <arn-from-create>
aws ce delete-anomaly-monitor --monitor-arn "$MON_ARN"
aws budgets delete-budget --account-id 111122223333 --budget-name cw-logs-guard
terraform destroy   # if you used Part A's Terraform
Expected: get-anomaly-monitors and describe-budget return empty/NotFound. Turn off the Cost Explorer hourly/resource-level opt-in if you enabled it in Part E, since it is a paid feature. Keep the CUR and the all-services anomaly monitor in real life — they cost nothing meaningful and you want them permanently.
Common mistakes & troubleshooting
This is the playbook — the bulk of your value in an incident. First the master culprit table (scan it top-down), then the three nastiest failures in full, then the error/decision references.
The master culprit playbook
Twenty rows covering every family the funnel will land on. Read left to right: the meter you see, the likely cause, exactly how to confirm, and the fix.
| # | Symptom (usage type / service) | Likely cause | Confirm (Cost Explorer group-by / CUR query) | Fix |
|---|---|---|---|---|
| 1 | NatGateway-Bytes jump (EC2-Other) |
App egress routed through NAT — S3/DDB/ECR pulls, cross-AZ chatter, container image pulls | CE filter Usage Type *NatGateway-Bytes, group by Resource; CUR Q3 on %NatGateway-Bytes% by line_item_resource_id |
Add gateway endpoints (S3/DynamoDB, free) + interface endpoints (ECR/etc.); keep chatty traffic off NAT |
| 2 | NatGateway-Hours jump |
New NAT gateways (one per AZ ×3) or new VPCs | CE Usage Type *NatGateway-Hours, count distinct resources |
Collapse to one NAT per AZ only where egress is truly needed; share via Transit Gateway |
| 3 | DataTransfer-Regional-Bytes (cross-AZ) |
Chatty cross-AZ traffic — app↔DB, Kafka, replicas spread across AZs | CE group by Usage Type + AZ; CUR group by line_item_availability_zone |
Co-locate talkers in one AZ; AZ-aware clients; topology-aware routing |
| 4 | DataTransfer-Out-Bytes (internet) |
Large responses/downloads to the internet; no CDN; possible data exfiltration | CE Usage Type *DataTransfer-Out-Bytes group by Region; check for a leaked key |
Front with CloudFront; compress; if unexplained, treat as a security event |
| 5 | <src>-<dst>-AWS-Out-Bytes (inter-region) |
Cross-region replication/reads — S3 CRR, DynamoDB global tables, cross-region queries | CE group by Region; CUR filter the region-pair usage type | Localise reads; narrow CRR scope; batch cross-region calls |
| 6 | S3 Requests-Tier1/Requests-Tier2 explosion |
A loop doing millions of PUT/GET/LIST — per-object polling, S3-as-a-queue | CE Service S3 group by API Operation; CUR Q6 group by line_item_operation |
Batch; cache; paginate; use S3 event notifications instead of polling |
| 7 | S3 Retrieval-SIA / Retrieval-GLACIER |
Reading data you lifecycle’d into IA/Glacier | CE S3 group by Usage Type; CUR filter retrieval usage types | Fix the lifecycle; don’t tier hot data; consider Intelligent-Tiering |
| 8 | S3 EarlyDelete-* |
Deleting IA/Glacier objects before the 30/90/180-day minimum | CE S3 Usage Type EarlyDelete-* |
Correct the lifecycle target; don’t write short-lived data to IA/Glacier |
| 9 | EBS:VolumeUsage.* steady on stopped work |
Volumes not deleted on instance terminate; orphaned volumes | CE EBS group by Usage Type; CUR resource IDs vs live volume list | Delete orphaned volumes; set DeleteOnTermination=true |
| 10 | EBS:SnapshotUsage growth |
Snapshots accumulating with no lifecycle | CE EBS Usage Type SnapshotUsage trend |
DLM lifecycle to age out snapshots; delete stale AMIs |
| 11 | ElasticIP:IdleAddress / PublicIPv4:InUseAddress |
Unattached EIPs; all public IPv4 now charged (since 2024) | CE Usage Type *ElasticIP* / *PublicIPv4* |
Release idle EIPs; reduce public IPs; use IPv6 / private subnets |
| 12 | CloudWatch DataProcessing-Bytes (Logs ingest) |
Debug logging, chatty apps, ALL-traffic VPC Flow Logs, Lambda logging full events | CE Service CloudWatch group by Usage Type; CUR resource_id = log group | Cut log level; sample; IA log class; set retention; drop noisy flow logs |
| 13 | CloudWatch TimedStorage-ByteHrs (Logs storage) |
Log groups set to “Never expire” | CE CloudWatch Usage Type (storage); CUR by log group | Set retention on every log group (7/14/30d) |
| 14 | RDS InstanceUsage / Multi-AZUsage idle |
Dev/test RDS left running; Multi-AZ on non-prod (doubles cost) | CE RDS group by Instance Type; CUR resource_id | Stop/scale-down; Single-AZ for dev; instance scheduler |
| 15 | OpenSearch ESInstance:* idle |
Domain left running; over-provisioned nodes/replicas | CE Service OpenSearch group by Usage Type | Right-size / delete; consider Serverless; fewer replicas |
| 16 | Kinesis Shard-Hour / MSK Kafka.* |
Over-provisioned shards/brokers vs throughput | CE Service Kinesis/MSK group by Usage Type | Scale shards to load; on-demand mode; MSK right-size |
| 17 | DynamoDB *CapacityUnit-Hrs idle |
Provisioned WCU/RCU far above traffic | CE DynamoDB group by Usage Type; CUR resource_id = table | Switch to on-demand or autoscaling; right-size |
| 18 | KMS-Requests / Secrets APIRequest spike |
Decrypting/fetching per-request in a hot loop | CE Service KMS/Secrets group by Usage Type/Operation | Cache data keys/secrets; envelope encryption; batch |
| 19 | GuardDuty *-Bytes / Config ConfigurationItemRecorded |
Enabled org-wide across all regions; recording ephemeral resources | CE Service GuardDuty/Config group by Region | Scope to used regions; exclude noisy resource types from the Config recorder |
| 20 | On-Demand compute jumps, usage flat | RI/Savings Plan expired or coverage dropped | CE group by Purchase Option; SP Coverage report; switch to amortized | Buy/renew a Savings Plan; set coverage to your risk appetite |
The three nastiest, in full
The NAT data-processing bill (NatGateway-Bytes). This is the most common six-figure surprise at scale and the most common “$97 became $600” surprise for a startup, and it is nasty because the meter has no resource you would think to look at. A NAT gateway charges ~$0.045/hr to exist (NatGateway-Hours) and ~$0.045/GB for every byte it processes (NatGateway-Bytes) — and everything in a private subnet that reaches S3, DynamoDB, ECR, Systems Manager, or the internet goes through it unless you built a VPC endpoint. The classic amplifiers: an EKS/ECS cluster pulling container images from ECR on every scale-out (gigabytes, repeatedly), a data pipeline reading and writing S3 across the NAT instead of through a free gateway endpoint, and cross-AZ traffic that pays NAT bytes and DataTransfer-Regional-Bytes at the same time. Confirm it by filtering Cost Explorer to Usage Type *NatGateway-Bytes and grouping by Resource, then run CUR Q3 to see which nat-… id and which AZ carry the cost; group by hour (Q4) to see whether it is a steady grind (S3 pipeline) or spiky (image pulls on deploys). The fix is almost always VPC endpoints: a gateway endpoint for S3 and DynamoDB is free and removes that traffic from NAT entirely; interface endpoints for ECR, Systems Manager, and others cost ~$0.01/hr but save far more in NAT bytes at volume. The deep mechanics are in NAT Gateway Private-Subnet Egress.
Cross-AZ data transfer (DataTransfer-Regional-Bytes). This one is insidious because it is the cost of an architecture people were told was a best practice — spread across AZs “for high availability.” Every byte that crosses an AZ boundary within a region is billed ~$0.01/GB, and — the part that surprises everyone — it is charged on both the sending and receiving side, so a round-trip conversation is effectively ~$0.02/GB. The big generators are replicated data stores (a Kafka/MSK cluster or a database with read replicas placed in different AZs from their clients), microservice chatter where service A in az1 constantly calls service B in az2, and load balancers with cross-zone balancing fanning requests to targets in other AZs. It hides because no single resource “owns” it — it is an emergent property of where your talkers sit. Confirm by grouping Cost Explorer by Usage Type and adding an Availability Zone dimension, or in the CUR by grouping DataTransfer-Regional-Bytes by line_item_availability_zone and correlating the volume with your topology. The fix is topological: co-locate chatty pairs in the same AZ, use AZ-aware clients (many SDKs and service meshes can prefer same-zone endpoints), keep Kafka consumers in the broker’s AZ, and weigh cross-zone load balancing against its transfer cost. You rarely eliminate cross-AZ transfer (you need HA), but you can often cut it by an order of magnitude by not letting every hop cross a boundary.
CloudWatch Logs ingestion (DataProcessing-Bytes). The silent giant. Logs ingestion is billed at ~$0.50/GB for the Standard class — an order of magnitude more than S3 storage — and logging volume scales with both traffic and verbosity, so a single logger.debug in a hot path, or turning VPC Flow Logs to “ALL” on a busy VPC, or a library that logs full request/response bodies, can multiply your ingestion overnight with no infrastructure change at all. It is nasty for three reasons: it does not look like a resource (it is a log group, buried under CloudWatch), the storage side (TimedStorage-ByteHrs) keeps accruing silently because most log groups default to “Never expire,” and the onset almost always coincides with a code deploy, not an infra change, so infra-focused triage misses it. Confirm by filtering Cost Explorer to CloudWatch, grouping by Usage Type (look for DataProcessing-Bytes and TimedStorage-ByteHrs), then run CUR Q3 filtering %DataProcessing-Bytes% grouped by line_item_resource_id — the resource id is the log group ARN, naming the exact source. Q4 by hour pins the onset to the deploy. The fix is layered: cut the log level (the biggest lever), sample high-volume logs, move verbose groups to the Infrequent Access log class (~$0.25/GB), replace raw-event logging with metric filters, scope VPC Flow Logs to REJECT-only or specific subnets, and — always — set a retention policy on every log group so storage cannot accrue forever.
Error & exception reference (the tooling itself)
When the tools misbehave mid-triage, these are the messages and their fixes.
| Code / message | Where | Meaning | Fix |
|---|---|---|---|
DataUnavailableException |
ce API |
Cost Explorer not enabled / data not ready | Enable CE once in console; wait ~24h |
AccessDeniedException |
ce / cur / budgets |
Principal lacks billing permissions | Attach ce:*/cur:*/budgets:*; management acct must allow IAM billing access |
RequestChangedException |
ce get-cost-and-usage |
Next-page token used with changed params | Re-issue without stale NextPageToken |
ThrottlingException |
ce API |
Too many CE calls (also $0.01 each) | Back off; cache; batch |
Athena TABLE_NOT_FOUND |
Athena | CUR Glue table not created yet | Run the CUR’s crawler-cfn.yml; wait for first delivery |
Athena HIVE_PARTITION_SCHEMA_MISMATCH |
Athena | CUR schema changed month-to-month | Re-run the Glue crawler / repair partitions |
| Athena scan cost surprise | Athena | Query scanned all partitions | Always filter bill_billing_period_start_date; use Parquet |
line_item_resource_id empty |
CUR | Report created without RESOURCES |
Re-create the CUR with AdditionalSchemaElements=["RESOURCES"] |
| Tag column missing in CUR/CE | Cost allocation | Tag key not activated | Activate the key in Billing; wait ~24h; no back-fill |
ReportLimitExceeded |
cur API |
Too many CUR definitions | Delete an old report definition |
| Anomaly never fires on a real spike | CAD | No subscription, threshold too high, or < 10 days history | Add a subscription; lower the $ threshold; wait for baseline |
Decision table — from meter to cause to action
| If you see this meter… | it’s probably… | do this |
|---|---|---|
NatGateway-Bytes high, -Hours flat |
Traffic routed through NAT | Add S3/DynamoDB gateway endpoints; interface endpoints for ECR/SSM |
DataTransfer-Regional-Bytes high |
Cross-AZ chatter | Co-locate talkers in one AZ; AZ-aware routing |
DataTransfer-Out-Bytes high, unexplained |
Internet egress or exfiltration | CloudFront + compression; if unexplained, investigate as security |
S3 Requests-Tier1/2 in the millions |
A polling loop / S3-as-a-queue | Batch, cache, use event notifications |
S3 EarlyDelete-* |
Bad lifecycle to IA/Glacier | Fix the lifecycle transition timing |
CloudWatch DataProcessing-Bytes |
Verbose logging (often a deploy) | Cut log level; retention; IA log class |
Multi-AZUsage:db.* on non-prod |
Multi-AZ dev database | Single-AZ for dev/test |
Shard-Hour / *CapacityUnit-Hrs flat-high |
Over-provisioned streaming/DB capacity | On-demand mode; autoscale; right-size |
| On-Demand up, usage flat | Expired RI/SP coverage | Renew/buy a Savings Plan |
| One big line, one day, amortizes flat | An RI/SP purchase, not a leak | No action — it’s a commitment, verify amortized |
Best practices
- Work top-down, never bottom-up. Baseline → Service → Usage Type → Resource → Time → Owner. Starting in the CUR without a target is how you waste an afternoon.
- The Service→Usage Type pivot is the whole game. The moment you have a suspect service, switch group-by to Usage Type — it decomposes “EC2-Other” and names the meter.
- Use daily granularity to find the onset day, then correlate it with your deploy and change logs — the kink almost always lines up with a change.
- Let Anomaly Detection do levels 1–3. Read the
RootCauseslist first; it hands you the service, region, and usage type for free. - Enable the CUR with resource IDs and Athena before a crisis. A freshly enabled report has no history — set it up on day one and never think about it until you need it.
- Learn to read usage-type strings.
APS3-NatGateway-Bytesshould read instantly as “NAT data processing, Mumbai.” The meter names the culprit. - Always constrain the billing period in Athena so it prunes partitions; a
SELECT ... FROM curwith no partition filter can scan terabytes. - Check Purchase Option before hunting a runaway — an On-Demand jump with flat usage is a coverage gap, not a leak, and switching to amortized cost reveals a one-day RI/SP purchase.
- Tag for attribution now. A perfect diagnosis you cannot route recurs; activate cost-allocation tags and enforce them so every spike is pre-attributed.
- Contain active runaways with a scoped budget action, but prefer approval-required for anything that applies a Deny policy.
- Fix structurally, not with alerts. VPC endpoints, AZ co-location, log retention, right-sizing, and deletion beat “watch it more closely.”
- Write down each incident’s meter → resource → fix. Your account develops a personality; the second CloudWatch spike is faster because you remember the first.
Security notes
A cost spike is sometimes the first symptom of a compromise, and cost data itself is sensitive. Treat both accordingly.
| Concern | Guidance |
|---|---|
| Egress spike = possible exfiltration | A sudden DataTransfer-Out-Bytes jump with no product reason can be data leaving; correlate with CloudTrail/GuardDuty before assuming benign |
| Compute/GPU spike = possible cryptomining | A leaked access key spinning up large/GPU instances shows as a BoxUsage explosion in an unexpected region; check IAM/CloudTrail |
| Who can see cost | Grant ce:*, cur:*, budgets:*, aws-portal:ViewBilling least-privilege; cost data reveals architecture, scale, and launch timing |
| CUR bucket is sensitive | It holds full billing detail — Block Public Access, encrypt (SSE-S3/KMS), restrict the policy to billingreports.amazonaws.com and analysts |
| Athena results bucket | Query outputs contain cost detail too — lock it down and lifecycle-expire results |
| Budget action policies | The IAM/SCP a budget action applies is powerful; scope it tightly and prefer approval-required to avoid self-lockout |
| Cross-account visibility | In an org, don’t leak org-wide cost to a single team; members see only their own unless the payer shares |
| Audit the triage | Billing/CE actions are logged by CloudTrail — see AWS CloudTrail, Config and Audit Compliance if a spike needs a forensic timeline |
When a spike is unexplained by any legitimate change — a new region you don’t use, a GPU family you never launch, egress to an unknown destination — stop treating it as a FinOps problem and escalate it as a security incident: rotate keys, review CloudTrail, and contain with an SCP before you finish the cost analysis.
Cost & sizing
The triage tools are nearly free; the savings dwarf them. What each costs:
| Item | Cost | Notes |
|---|---|---|
| Cost Explorer UI | Free | Unlimited group-by/filter in the console |
Cost Explorer API (ce) |
$0.01 / request | Adds up in scripts; cache results |
| Cost Explorer hourly + resource-level | ~$0.01 / 1,000 usage records / mo | Paid opt-in; enable for a confirm, then off |
| Cost Anomaly Detection | Free | Monitors and alerts cost nothing |
| AWS Budgets | First 2 free, then $0.02/budget/day | ~$0.60/mo per extra budget |
| Budget actions | Free (the feature) | You pay only for what the action doesn’t stop |
| CUR delivery | S3 storage only | Parquet + partitioning keeps it small |
| Athena | ~$5 / TB scanned | Partitioned Parquet → a triage query is cents |
| CUR → QuickSight | QuickSight per-user/session | Only if you build dashboards |
In INR terms, a complete triage stack — an all-services anomaly monitor, a couple of scoped budgets, a partitioned CUR, and ad-hoc Athena — runs effectively ₹0–200/month, against spikes that routinely run into thousands of dollars. The sizing rule is blunt: spend nothing on the triage tooling, spend your effort on the structural fixes the funnel reveals (VPC endpoints, AZ co-location, log retention, right-sizing, deletion). The most expensive thing in this whole discipline is the spike you didn’t catch because the CUR wasn’t enabled and no anomaly monitor existed — so the one thing worth doing eagerly is turning those on before you need them.
Interview & exam questions
1. A bill spiked and you have twenty minutes. What is your first move? (SOA-C02, FinOps) — Confirm it’s real and find the onset in Cost Explorer at daily granularity grouped by Service, then check aws ce get-anomalies for a ready-made root-cause list. Work top-down: service → usage type → resource. Don’t start in the CUR without a target.
2. Why is grouping Cost Explorer by “Usage Type” so important? (SOA-C02) — Because a spike is usually a meter, not a resource. Grouping by Usage Type decomposes opaque buckets like “EC2-Other” into NatGateway-Bytes, EBS:VolumeUsage, and DataTransfer-*, naming the exact meter. The resource console never shows these meters.
3. Cost Anomaly Detection fired. What does its output give you that Budgets doesn’t? (CLF-C02, SOA-C02) — A RootCauses list naming the service, region, usage type, and linked account of the deviation, plus the impact in dollars — it does the first three funnel levels for you. Budgets only tell you a threshold was crossed, not what caused it.
4. How do you pin a spike to a specific resource and hour? (SAP-C02) — Query the CUR over Athena: line_item_unblended_cost grouped by line_item_usage_type (the meter), then line_item_resource_id (the resource, which requires the report to include RESOURCES), then date_trunc('hour', line_item_usage_start_date) for the onset. Cost Explorer’s resource-level view can confirm it live.
5. Where do NAT gateway data-processing costs appear, and what’s the fix? (SOA-C02, ANS-C01) — In the NatGateway-Bytes usage type (filed under EC2-Other), separate from NatGateway-Hours. Everything in a private subnet reaching S3/DynamoDB/ECR/internet meters ~$0.045/GB through NAT. The fix is VPC endpoints — free gateway endpoints for S3/DynamoDB, interface endpoints for others.
6. Cross-AZ transfer surprises people. Why, and how is it billed? (SAP-C02) — Every byte crossing an AZ boundary within a region is DataTransfer-Regional-Bytes at ~$0.01/GB, charged on both sender and receiver (~$0.02/GB round-trip). It’s an emergent cost of spreading chatty services/data stores across AZs “for HA.” Fix by co-locating talkers in one AZ and using AZ-aware clients.
7. CloudWatch cost jumped after a deploy but no infrastructure changed. What happened? (SOA-C02) — Almost certainly Logs ingestion (DataProcessing-Bytes, ~$0.50/GB) from a new debug/verbose log line shipping large payloads at high call volume. Confirm by grouping CloudWatch by Usage Type and pinning the log group via line_item_resource_id. Fix: cut log level, set retention, use the IA log class.
8. A one-day cost spike appears, but it’s not a runaway. What might it be? (SAP-C02) — An RI or Savings Plan up-front payment, which lands as a large unblended line on the purchase day. Switch the cost type to amortized and it spreads flat across the term — it was a commitment purchase, not a leak.
9. Compute cost rose but usage looks flat. What do you check? (SAP-C02, SOA-C02) — Group by Purchase Option and open the Savings Plans / RI Coverage report. If usage is unchanged and only the rate went up, an RI/SP expired or usage grew past coverage — the fix is buying/renewing a commitment, not deleting resources.
10. How would you keep an Athena CUR query cheap? (SAP-C02) — Store the CUR as Parquet, ensure it’s partitioned (by billing period), and always constrain bill_billing_period_start_date (or CUR 2.0 billing_period) so Athena prunes partitions. A well-partitioned triage query scans megabytes and costs cents; an unfiltered SELECT * scans terabytes.
11. When is a cost spike actually a security incident? (SCS-C02) — When it has no legitimate change behind it: a BoxUsage explosion in a region you don’t use (cryptomining on a leaked key), or a DataTransfer-Out-Bytes jump to an unknown destination (exfiltration). Escalate — rotate keys, review CloudTrail/GuardDuty, contain with an SCP — before finishing the cost analysis.
12. What must be true for line_item_resource_id to be populated in your CUR? (SAP-C02) — The report must be created with resource IDs enabled (AdditionalSchemaElements includes RESOURCES). Without it, the CUR has no per-resource rows and you can pin the meter but not the resource — so enable it when you create the report, before you need it.
Quick check
- Your bill jumped and an anomaly email says the service is CloudWatch. What two Cost Explorer settings turn “it’s CloudWatch” into “it’s this log group, since the 9th”?
- You see a large
DataTransfer-Regional-Bytesline. What is it, and why is the true cost roughly double the per-GB rate you first read? - A one-day spike shows in unblended cost but vanishes into a flat line when you change one setting. What setting, and what was the “spike”?
- Cost Explorer named the meter
NatGateway-Bytesbut you need the exactnat-…resource and the hour it started. Which tool and which two columns? - Compute cost rose 30% but every instance count and size is unchanged. What single group-by tells you whether this is a runaway or a coverage gap?
Answers
- Granularity = Daily (to see the onset day, the 9th) and Group by = Usage Type then Resource (to go from “CloudWatch” to
DataProcessing-Bytesto the specific log-group ARN). Enable the resource-level opt-in for the final per-resource confirm. - It is cross-AZ data transfer within a region (~$0.01/GB). It’s roughly double because it is billed on both the sending and receiving side, so a round-trip conversation is effectively ~$0.02/GB. The fix is co-locating chatty pairs in the same AZ.
- Switch the cost type from unblended to amortized. The “spike” was an RI or Savings Plan up-front purchase — a real charge, but a commitment that amortizes flat across its term, not a runaway.
- The CUR over Athena: group by
line_item_resource_id(filtered to%NatGateway-Bytes%) for the resource, and byline_item_usage_start_date(truncated to the hour) for the onset. Cost Explorer’s resource-level view can confirm live. - Group by Purchase Option (and check the Savings Plans / RI Coverage report). Flat usage with an On-Demand jump means an expired or outgrown commitment — a coverage gap you fix by buying/renewing a Savings Plan, not by deleting anything.
Glossary
| Term | Definition |
|---|---|
| Line item | The atomic unit of an AWS bill — one metered charge with service, usage type, resource, cost, and time |
| Usage type | The exact meter billed (NatGateway-Bytes, DataProcessing-Bytes), optionally prefixed by region — the key triage pivot |
| Usage type group | A coarser bucket of related usage types (e.g. “EC2: Data Transfer”) |
| EC2-Other | The Cost Explorer bucket where NAT, EBS, data transfer, and VPC endpoints hide until you group by usage type |
| Triage funnel | The top-down method: baseline → service → usage type → resource → time → owner |
| Cost Explorer | Interactive UI + ce API to visualise cost by service, usage type, tag, region, and more |
| Resource-level data | A paid Cost Explorer opt-in that adds per-resource (and hourly) rows |
| Cost Anomaly Detection (CAD) | Free ML that learns per-service spend and flags deviations, with a root-cause list |
| RootCauses | The field on a detected anomaly naming the service, region, usage type, and account of a deviation |
| CUR | Cost and Usage Report — hourly, per-resource, SQL-queryable line items delivered to your S3 bucket |
line_item_resource_id |
The CUR column naming the exact resource; populated only if the report includes RESOURCES |
| Unblended cost | The actual rate charged on each line at time of use (matches the invoice) |
| Amortized cost | Up-front RI/SP fees spread across the commitment term — reveals a purchase masquerading as a spike |
| Cross-AZ transfer | DataTransfer-Regional-Bytes, billed both directions, from chatty traffic across AZ boundaries |
| NAT data processing | NatGateway-Bytes, ~$0.045/GB for every byte a NAT gateway processes — a top invisible-meter culprit |
| Logs ingestion | CloudWatch DataProcessing-Bytes, ~$0.50/GB — the silent giant, scales with traffic and log verbosity |
| Budget action | Automation a budget triggers on breach — apply an IAM/SCP policy or stop tagged EC2/RDS |
| Cost allocation tag | A tag key activated so Cost Explorer and the CUR can break cost down by it |
| Coverage gap | Usage that fell out of RI/Savings Plans coverage, flipping to On-Demand rates — a false spike |
Next steps
You can now take a spike from “the bill jumped” to a named resource, hour, and owner. Extend outward:
- Set the trip-wires that feed this drill: the companion AWS Cost Control 101: Cost Explorer, Budgets, Alerts & Free-Tier Guardrails builds the Budgets, billing alarm, and anomaly monitors that alert you — this article is what you do when they fire.
- Make every spike pre-attributed: AWS Tagging Strategy and Cost-Allocation Enforcement so
line_item_resource_idcomes with ateamtag and the ticket routes itself. - Fix the number-one culprit at the source: NAT Gateway Private-Subnet Egress — VPC endpoints, per-AZ NAT, and how to keep S3/DynamoDB/ECR traffic off the NAT meter entirely.
- Build the forensic timeline when a spike is a compromise: AWS CloudTrail, Config and Audit Compliance — correlate a cost anomaly with the API calls that caused it.
- Turn the CUR into a standing dashboard so the monthly variance review is a saved query, not an archaeology dig — CUR → Athena → QuickSight for chargeback and trend lines.