You have a fleet of virtual machines and a vague sense that one of them is “slow.” The Azure portal’s Metrics blade shows CPU and disk from outside the VM — the hypervisor’s view — but it cannot see inside the guest: which process is eating memory, which logical disk is full, or which TCP connection to a database just started timing out. To answer those questions you need an agent inside the OS collecting guest-level performance counters, plus something mapping the process-to-process and VM-to-VM connections so you can see that app-web-01 talks to app-sql-01 on port 1433 and that link is the one degrading. That is exactly what VM Insights delivers, and this is the end-to-end guide to switching it on correctly the first time.
VM Insights is the Azure Monitor experience for monitoring the performance and dependencies of Azure VMs, Virtual Machine Scale Sets, and Azure Arc-enabled servers. Under the hood it is three parts you must get right: the Azure Monitor Agent (AMA) inside the guest, the Dependency Agent that watches connections for the map, and a Data Collection Rule (DCR) telling the agent what to collect and where to send it — a Log Analytics workspace. Enable it and you get pre-built performance charts (CPU, available memory, logical-disk IOPS and free space, bytes sent/received), a live dependency map, and a workbook view across your estate. The data lands in queryable tables (InsightsMetrics, VMConnection, VMComputer, VMProcess, VMBoundPort) you drive with KQL and alerts.
By the end you will be able to enable VM Insights from the portal, with az CLI, and as Bicep; choose between the performance-only and performance-and-maps options and know what the difference costs; validate that data is flowing before you walk away; read the dependency map and the underlying tables; and avoid the handful of mistakes — missing managed identity, the legacy agent left running, an unassociated DCR — that turn a ten-minute setup into a day of “why is there no data.” This is the AMA-and-DCR world that replaced the old Log Analytics agent; we do it the current way throughout.
What problem this solves
The platform metrics Azure gives you for free stop at the VM boundary. Percentage CPU from the host tells you the VM is busy; it does not tell you a runaway log-shipping process is the culprit, or that the C: drive is at 98%. Available memory, per-logical-disk free space and latency, per-process CPU and working set, and connection health all live inside the guest, and nothing collects them until you put an agent there. Teams discover this during an incident: they open Metrics, see nothing useful, RDP in, and start running top by hand — per-VM toil that does not scale to fifty machines.
The second half is dependencies. Workloads are chains — web tier calls app tier calls database calls cache — and when latency spikes the hard question is which hop. Without a map you reconstruct the topology from memory, often wrong. VM Insights’ map draws the actual observed connections (process to process, VM to VM, VM to an external IP:port), so you see the link that changed: the difference between “the database is slow” (a hypothesis) and “app-web-01 → 10.2.0.7:1433 is failing 12% of attempts” (a fact you can act on).
Who hits this: anyone running IaaS VMs in production — lift-and-shift estates, scale sets, Arc-enabled hybrid servers. It bites hardest on teams that migrated VMs, assumed host metrics were “monitoring,” and got blindsided by an in-guest problem (disk-full, memory-leak, chatty dependency) the host could never see. VM Insights is built on the same Azure Monitor Agent and Data Collection Rule plumbing you reuse for log collection and security agents — so learning it pays off beyond this feature.
| What you want to know | Host metrics show it? | VM Insights shows it? | Where VM Insights puts it |
|---|---|---|---|
| VM is busy (CPU %) | Yes (hypervisor view) | Yes (guest view) | Performance chart + InsightsMetrics |
| Which process is eating CPU/RAM | No | Yes (with maps) | Map + VMProcess |
| Available memory inside the guest | No | Yes | Performance chart + InsightsMetrics |
| Per-logical-disk free space / latency | No | Yes | Performance chart + InsightsMetrics |
| Connections VM→VM / VM→IP:port | No | Yes (with maps) | Dependency map + VMConnection |
| Failed outbound connection attempts | No | Yes (with maps) | Map (red link) + VMConnection |
| Listening ports per VM | No | Yes (with maps) | VMBoundPort |
Learning objectives
By the end of this article you can:
- Explain the three components of VM Insights — Azure Monitor Agent, Dependency Agent, and the Data Collection Rule — and how data flows to a Log Analytics workspace.
- Choose between the “Performance counters only” and “Performance and dependency maps” enablement options and state precisely what each adds and costs.
- Enable VM Insights on a single VM three ways: the Azure portal, the
azCLI, and Bicep, including the managed identity and association the agent needs. - Validate end to end that telemetry is flowing — agent is provisioned, the DCR is associated, and
InsightsMetrics/VMConnectionrows are arriving — before you trust the dashboards. - Read the VM Insights Performance and Map tabs, and query the underlying tables (
InsightsMetrics,VMConnection,VMComputer,VMProcess,VMBoundPort) with KQL. - Diagnose the common “no data” and “no map” failures: wrong/legacy agent, missing managed identity, unassociated DCR, blocked Dependency Agent egress, and workspace mismatch.
- Right-size the cost — understand what drives Log Analytics ingestion for VM Insights and how to trim counter frequency and table scope without losing the signal you need.
Prerequisites & where this fits
You should already understand what a virtual machine and a resource group are, and be comfortable running az in Cloud Shell and reading JSON output. You need a Log Analytics workspace to send the data to — if you do not have one, Create and design a Log Analytics workspace walks through it, and you can also create one inline during VM Insights onboarding. Helpful but not required: a mental model of the Azure Monitor data platform (metrics vs logs) from Metrics, Logs and Traces explained, and the agent/DCR architecture from Azure Monitor data collection rules and the agent, which this article applies hands-on.
This sits in the Observability track, one layer above raw monitoring plumbing. The pipeline it relies on — Azure Monitor Agent → Data Collection Rule → Log Analytics workspace — is the same one used for custom logs and the Windows event log; VM Insights is a curated, opinionated application of it for VM performance and dependencies. Once the data is in the workspace you query it with KQL (KQL for Log Analytics) and alert on it via metric or log alerts (Metric alerts and action groups). If you are deciding what to collect where, Metrics vs Log Analytics: when to use which frames the trade-off VM Insights makes for you.
A quick map of the moving parts and who owns each, so you know where to look when something is off:
| Component | What it is | Lives where | Who/what manages it |
|---|---|---|---|
| Azure Monitor Agent (AMA) | Collects guest perf counters & logs | VM extension inside the guest | Azure (extension), you (DCR config) |
| Dependency Agent | Watches connections/processes for the map | VM extension inside the guest | Azure (extension); depends on AMA |
| Data Collection Rule (DCR) | Declares what to collect, where to send | Azure resource (ARM) | You (author), associated to the VM |
| DCR Association | Binds a DCR to a specific VM/VMSS | Azure resource | You (one per VM or via policy) |
| Log Analytics workspace | Stores the collected data | Azure resource | You (capacity, retention, RBAC) |
| Managed identity | How AMA authenticates to Azure | On the VM (system/user-assigned) | You (enable + nothing else needed) |
Core concepts
Five ideas make the whole setup — and every later “why is there no data” — obvious.
VM Insights is an experience, not a service you provision. There is no “VM Insights resource.” Enabling it does three concrete things: installs the Azure Monitor Agent extension, optionally installs the Dependency Agent extension, and associates a Data Collection Rule that routes guest counters (and, with maps, connection data) into a Log Analytics workspace. The charts and map are just the portal rendering that data back — so no data almost always means one of those three pieces is missing.
The Data Collection Rule is the contract. A DCR is an Azure resource that declaratively says collect these counters at this sample rate, send them to this workspace. VM Insights uses a well-known DCR shape: the standard counter set into InsightsMetrics and (in the maps variant) the Dependency Agent’s data. One DCR associates with many VMs — how you standardise a fleet — and it is separate from the agent (the agent is the engine, the DCR the instruction sheet), so you change collection by editing the DCR without touching a VM.
Two flavours: performance-only vs performance-and-maps. Enablement offers two options. Performance counters only installs just the Azure Monitor Agent and a perf-counters DCR — you get all the CPU/memory/disk/network charts and InsightsMetrics, but no dependency map. Performance and dependency maps additionally installs the Dependency Agent, which populates VMConnection, VMComputer, VMProcess, and VMBoundPort and draws the map. The maps option collects more data (more ingestion cost) and runs a second extension. Choose maps when you need topology and per-process visibility; choose performance-only when you just need the resource charts and want to keep ingestion lean.
The agent authenticates with a managed identity — no keys. AMA uses the VM’s managed identity (system-assigned is enabled automatically during onboarding if absent) to authenticate and fetch its DCR — no workspace keys, unlike the legacy agent. If the VM has no identity, the agent can’t pull its config — a frequent “agent installed but no data” cause. Azure VMs handle this for you; Arc-enabled servers get the identity from the Arc agent.
This replaced the legacy Log Analytics agent. The old way used the Log Analytics agent (MMA/OMS) plus the Service Map solution, configured with workspace ID + key. That agent retired in August 2024; new deployments use the Azure Monitor Agent. Running an inherited MMA + Service Map alongside AMA causes duplicate data — removing the old agent is part of onboarding. Everything here is the current AMA + DCR path.
The vocabulary in one table
Pin these down before the steps; the glossary repeats them for lookup:
| Term | One-line definition | Why it matters |
|---|---|---|
| VM Insights | The Azure Monitor performance + dependency experience for VMs | The feature you are enabling |
| Azure Monitor Agent (AMA) | The current in-guest agent collecting counters/logs | Without it, no guest data at all |
| Dependency Agent | Extension that watches connections/processes | Needed for the map; optional |
| Data Collection Rule (DCR) | Declares what to collect and where to send | The instruction sheet; edit to change collection |
| DCR Association | Binds a DCR to a VM/VMSS | No association → agent has nothing to do |
| Log Analytics workspace | The store the data lands in | Owns retention, cost, RBAC |
InsightsMetrics |
Table holding the perf counters | Where CPU/mem/disk/net live |
VMConnection |
Table holding observed connections | The raw data behind the map |
| Managed identity | How AMA authenticates to Azure | No identity → agent can’t fetch its DCR |
| Service Map (legacy) | The deprecated map solution | Remove it; replaced by VM Insights maps |
How VM Insights collects data, end to end
Before clicking anything, walk the pipeline once — every “no data” symptom maps to exactly one stage breaking. A guest counter — say % available memory — is sampled by the Azure Monitor Agent, which downloads its Data Collection Rule (authenticating with the VM’s managed identity), collects exactly what the DCR lists at its sample rate (default 60 s), and ships it over HTTPS to the Log Analytics workspace in the DCR’s destination. It lands in InsightsMetrics with dimensions for namespace (Memory), counter name (AvailableMB), and the VM; the portal queries that table to draw the charts.
The map is a parallel path. The Dependency Agent (maps only) observes every TCP connection and the process on each end and feeds it to AMA, which ships it across four tables: VMComputer (machine properties), VMProcess (processes), VMBoundPort (listening ports), and VMConnection (connections, with success/failure counts, bytes, remote IP/port). The Map tab reads these — and this is why turning maps off saves cost, since VMConnection on a chatty VM can dwarf the perf counters. Two properties matter throughout: the DCR is reusable (one rule associates with hundreds of VMs — you onboard a fleet by associating, not configuring each box), and the agent is dumb without the DCR (an AMA extension that is “provisioning succeeded” but unassociated produces zero data — the most common mistake and the first thing to check).
| Stage | Component | What can break here | Symptom |
|---|---|---|---|
| 1. Sample counter | Azure Monitor Agent | Agent not installed / failed provisioning | No data; extension shows failed |
| 2. Fetch config | AMA + managed identity | No managed identity, or no DCR associated | Agent up, no data |
| 3. Collect per DCR | Data Collection Rule | DCR collects wrong counters / wrong table | Some metrics missing |
| 4. Ship to workspace | Network egress (443) | Outbound blocked to AMA endpoints | No data; agent errors |
| 5. Land in tables | Log Analytics workspace | Wrong workspace / region mismatch | Data in a different workspace |
| 6. Observe connections | Dependency Agent | Maps option not chosen / DA egress blocked | Charts work, map empty |
| 7. Render | VM Insights portal blade | Time range / wrong scope selected | “No data for selected period” |
Choosing the enablement option
The first real decision is performance-only vs performance-and-maps, and it is worth making deliberately because it sets both your visibility and your bill.
Performance counters only installs the Azure Monitor Agent and a DCR that collects the standard VM Insights counter set into InsightsMetrics. You get every performance chart — CPU, available memory, logical disk space/IOPS/latency, network bytes — plus the cross-VM grid and the ability to alert on any counter. You do not get the dependency map, per-process data, or connection health. It runs one extension and ingests the least data: the right default for most VMs that need resource visibility and alerting but not topology.
Performance and dependency maps does everything above and installs the Dependency Agent, which populates the connection and process tables and draws the map. Pick this when you need dependencies — investigating which downstream a slow tier calls, validating a migration’s connectivity, or hunting a failing connection. The cost is real: a second extension and meaningfully more ingestion, dominated by VMConnection on busy hosts.
| Dimension | Performance counters only | Performance and dependency maps |
|---|---|---|
| Extensions installed | Azure Monitor Agent | AMA + Dependency Agent |
| Performance charts | Yes | Yes |
| Dependency map | No | Yes |
Per-process data (VMProcess) |
No | Yes |
Connection health (VMConnection) |
No | Yes |
Listening ports (VMBoundPort) |
No | Yes |
| Tables written | InsightsMetrics |
InsightsMetrics + VMConnection/VMComputer/VMProcess/VMBoundPort |
| Relative ingestion cost | Lower | Higher (connection data dominates) |
| On-box footprint | One extension | Two extensions |
| Best for | Resource charts + alerting | Topology, migration validation, dependency hunts |
A practical rule: default new VMs to performance-only, and switch the subset that needs topology to maps. Since the only difference is whether the Dependency Agent is installed and which DCR is associated, you can upgrade a VM later without rebuilding — install the agent and associate the maps DCR.
Where to send the data: the workspace
VM Insights writes to a Log Analytics workspace, and the choice matters. Consolidate into few workspaces (often one per region per environment) so cross-VM queries and the fleet workbook work without cross-workspace joins. Keep the workspace in the same region as the bulk of your VMs for lowest latency (cross-region is supported). Retention and RBAC are set on the workspace, so VM Insights inherits them. For this guide, one workspace in your VMs’ region is the sane default.
| Workspace choice | When it’s right | Watch-out |
|---|---|---|
| One workspace per region/env | Most estates; clean cross-VM queries | Plan retention/cost centrally |
| One workspace per team/app | Strong RBAC isolation needs | Cross-team queries need cross-workspace joins |
| Many small workspaces | Rarely; strict data-boundary mandates | Fleet workbook & joins get painful |
| Reuse an existing shared one | You already standardised on it | Confirm retention/cost owner and region |
Anatomy of the VM Insights Data Collection Rule
The DCR is where collection is actually defined, so it pays to know what the VM Insights rule contains. It has two halves wired by a data flow: data sources (what to collect) and destinations (where to send it).
For performance, the data source is a performance counters block listing the VM Insights counter set at a samplingFrequencyInSeconds (default 60), flowing into the Microsoft-InsightsMetrics stream and a Log Analytics destination. The standard set covers processor time, available memory, logical disk metrics (free space, free %, transfers/sec, read/write latency), and network bytes — the counters the charts render. You can add or remove counters by editing the DCR; the defaults are well chosen. For maps, the DCR additionally declares the dependency-agent data source (the Microsoft-ServiceMap stream family) so connection/process data lands in the VM* tables. The portal’s “Performance and dependency maps” toggle creates the right DCR for you; knowing its shape helps for debugging and for authoring it as Bicep.
| DCR element | What it declares | VM Insights value | Editable? |
|---|---|---|---|
dataSources.performanceCounters |
Counters + sample rate | VM Insights counter set @ 60s | Yes (add/remove counters, change rate) |
samplingFrequencyInSeconds |
How often to sample | 60 (default) | Yes (15–1800; higher = more cost) |
dataFlows.streams |
Which stream the data uses | Microsoft-InsightsMetrics (perf) |
Via supported streams |
| Dependency data source (maps) | Connection/process collection | Feeds VMConnection etc. |
Present only in maps DCR |
destinations.logAnalytics |
Target workspace | Your workspace resource ID | Yes (one or more) |
dataFlows |
Binds sources → destinations | Routes counters to workspace | Yes |
A note on sampling frequency: 60 seconds is the default and right for almost everyone. Dropping to 15 s gives finer charts but multiplies InsightsMetrics row count (and cost) by 4; raising it to 300 s cuts cost but blurs short spikes. Change it only with a reason — and the change is in the DCR, so one edit propagates to every associated VM.
Architecture at a glance
Read the diagram left to right as the life of one metric and one connection record. On the left, a VM (or scale-set instance, or Arc server) runs two in-guest extensions: the Azure Monitor Agent, which samples performance counters, and — maps option only — the Dependency Agent, which observes every TCP connection and process. The agent authenticates with the VM’s managed identity; with no identity it cannot fetch its config (failure point ①).
In the middle, the Data Collection Rule is the instruction sheet the agent downloads, and the DCR association binds it to this VM — a missing association (②) is why an installed agent produces no data. On the right, both paths land in the Log Analytics workspace: counters in InsightsMetrics, and the Dependency Agent’s data across VMConnection/VMComputer/VMProcess/VMBoundPort. The blade reads those tables to draw the Performance charts and the Map. Block the Dependency Agent’s egress (③) and the charts work but the map stays empty; block the agent’s egress to the AMA endpoints (④) and nothing arrives at all. The badges mark exactly these four break points.
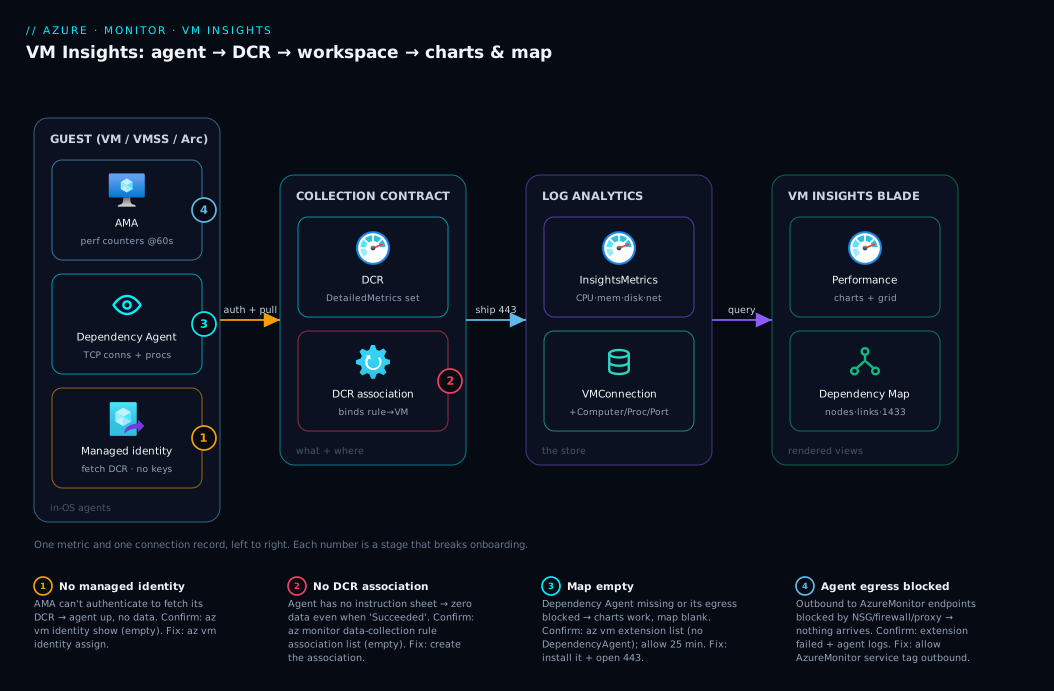
The shape to remember: agent (with identity) → DCR (associated) → workspace (tables) → portal (charts + map). Four stages, and almost every onboarding problem is one of them missing.
Real-world scenario
Meridian Retail ran a three-tier order system on Azure VMs after a lift-and-shift: two web VMs behind a load balancer (B2ms each), one app VM (D4s_v5), and a SQL Server on a db VM (E8s_v5) with premium disks. For months their “monitoring” was the platform Metrics blade and a couple of CPU alerts. Then, during a Friday-evening promotion, the site got slow — not down, just slow — and the on-call engineer stared at Metrics showing all four VMs under 50% CPU and shrugged. No host metric explained it. They restarted the app VM (it helped for ten minutes), scaled the web tier (no change), and limped to Monday.
The post-incident review made the case for VM Insights, and they enabled it with the performance-and-maps option on all four VMs, sending to one Log Analytics workspace in the same region. The onboarding took under an hour: portal enablement on the db VM first to validate, then an az loop for the rest, then the maps DCR association. Within fifteen minutes the Performance tab on the db VM showed what the host never could — available memory had dropped to under 400 MB during the promotion, and the logical disk read latency on the data drive had climbed past 30 ms as SQL Server spilled to disk under memory pressure. The host CPU stayed low precisely because the box was starved of memory and waiting on disk, not compute.
The dependency map sealed it. It drew the app VM connecting to the db VM on port 1433, and during the incident window that link showed a spike in failed connection attempts in VMConnection — the app’s connection pool exhausting against a database too busy to accept new sessions. Two unknown outbound connections from the app VM turned out to be a misconfigured telemetry SDK retrying in a tight loop, adding load nobody had accounted for. None of this was visible from outside the guest.
The fixes were now obvious: resize the db VM to an E16s_v5 (double the memory, ending the spill), fix the runaway telemetry SDK, and add log alerts on InsightsMetrics for available memory under 1 GB and on VMConnection for a failed-connection rate. The next promotion passed with available memory never below 4 GB and the map showing a clean link to the database. The takeaway was blunt: host metrics had been lying by omission for months, and a one-hour enablement turned a recurring two-day mystery into a dashboard the team now checks first — at roughly ₹3,500/month of Log Analytics for four VMs with maps, trivial against one slow Friday.
Advantages and disadvantages
| Advantages | Disadvantages |
|---|---|
| Guest-level visibility the host metrics can’t give (memory, disk free, per-process) | Requires an agent inside every VM (install + lifecycle) |
| Pre-built charts and a fleet workbook — no dashboard building | Dependency maps add real ingestion cost (VMConnection volume) |
| Dependency map shows the actual topology and failing links | Two extensions to manage when maps are on |
| Built on standard AMA + DCR plumbing you reuse elsewhere | Data lands in Log Analytics — you pay per GB ingested + retention |
| One DCR onboards a whole fleet via association/policy | Managed identity + DCR association are easy to forget → “no data” |
| Works for Azure VMs, scale sets, and Arc-enabled servers | Legacy-agent estates need migration off MMA first |
| Queryable with KQL; alertable with metric/log alerts | Map is near-real-time, not a packet capture — it shows flows, not payloads |
The advantages dominate for any production IaaS estate: the in-guest signal is exactly what host metrics miss, and the cost of not having it is measured in incident hours. The disadvantages are mostly operational discipline — keep the agent healthy, mind the ingestion bill on chatty VMs, and don’t forget the identity and association. The one genuine limitation is that the map shows connections and flows, not packet contents: it tells you VM A talks to VM B on 1433 and how often that fails, not the SQL inside. For payload-level inspection you reach for Network Watcher packet capture — a different question.
Hands-on lab
This is the centrepiece: enable VM Insights end to end on one VM, validate data flows, read the results, and tear it down — in the portal, with az CLI, and as Bicep, the same outcome three ways. Effort is free-tier-friendly (a small B-series VM for an hour costs a few rupees; one VM’s ingestion is negligible), and the final step deletes everything.
Prerequisites for the lab. A subscription where you can create a resource group, VM, and Log Analytics workspace; Contributor on the resource group; and az (Cloud Shell is easiest). Confirm tooling and that the monitor extension commands are present:
az version -o table
az extension add --name monitor-control-service 2>/dev/null || true   # DCR commands; harmless if already present
az account show --query "{sub:name, id:id}" -o table
Expected: a version table, and your subscription name/ID. The monitor-control-service extension provides az monitor data-collection rule commands used later.
Part A — Set up the resource group, workspace, and a test VM
Step 1 — Variables and resource group. Pick a region close to you (Central India here).
RG=rg-vmi-lab
LOC=centralindia
WS=law-vmi-lab
VM=vm-vmi-lab
az group create -n $RG -l $LOC -o table
Expected: a row with provisioningState = Succeeded.
Step 2 — Create a Log Analytics workspace. This is where VM Insights data will land.
az monitor log-analytics workspace create \
  -g $RG -n $WS -l $LOC \
  --query "{name:name, sku:sku.name, retention:retentionInDays}" -o table
WS_ID=$(az monitor log-analytics workspace show -g $RG -n $WS --query id -o tsv)
echo "Workspace resource ID: $WS_ID"
Expected: a workspace named law-vmi-lab, SKU PerGB2018, retention 30. Save $WS_ID — both the portal and the DCR need it.
Step 3 — Create a small Linux VM to monitor. A B2s is cheap and sufficient; system-assigned managed identity is enabled so AMA can authenticate.
az vm create \
  -g $RG -n $VM --image Ubuntu2204 --size Standard_B2s \
  --admin-username azureuser --generate-ssh-keys \
  --assign-identity \
  --query "{vm:name, identity:identity.type, ip:publicIpAddress}" -o table
Expected: VM created, identity = SystemAssigned. The --assign-identity flag is the bit people forget — without a managed identity the Azure Monitor Agent cannot fetch its DCR.
Step 4 — Generate a little load (optional, makes charts/map interesting). SSH in and run a brief stress, or skip — VM Insights collects idle data fine.
# Optional: a short CPU/network nudge so charts aren't flat. Requires SSH access.
# ssh azureuser@<publicIp> 'sudo apt-get update -qq && sudo apt-get install -y stress-ng && stress-ng --cpu 1 --timeout 120s &'
Expected: nothing required; this just makes the first charts less boring.
Part B — Enable VM Insights in the Azure portal (the click path)
Do this once to see the experience; you will automate it in Parts C and D.
Step 5 — Open VM Insights for the VM. In the portal go to Virtual machines → vm-vmi-lab → Monitoring → Insights (or Monitor → Virtual Machines → Not monitored tab). You will see a banner: “Insights is not enabled for this resource.”
Step 6 — Click “Enable” and choose the option. Click Enable. The dialog asks how to collect:
- Choose Performance and dependency maps to get charts and the map (or Performance counters only for charts alone).
- For Data collection rule, choose Create new (the portal proposes a name like
MSVMI-<workspace>), or pick an existing VM Insights DCR. - For the Log Analytics workspace, select
law-vmi-lab.
Click Enable / Configure. Expected: a deployment notification; the portal installs the Azure Monitor Agent (and, for maps, the Dependency Agent) and associates the DCR. This typically completes in 3–7 minutes.
Step 7 — Watch the extensions provision. While it runs, open vm-vmi-lab → Settings → Extensions + applications. You should see AzureMonitorLinuxAgent (and DependencyAgentLinux for maps) progress to Provisioning succeeded.
Step 8 — First look at data (allow 5–10 minutes). Return to Insights. The Performance tab populates first — CPU utilisation, available memory, logical disk, and bytes sent/received. The Map tab (maps option only) can take 15–25 minutes to draw the first topology, because it needs to observe connections over time. Don’t conclude “it’s broken” before then.
The portal path mapped to what each choice does:
| Portal field | What you pick | Effect |
|---|---|---|
| Enable method | Performance and dependency maps / Performance only | Installs Dependency Agent or not |
| Data collection rule | Create new / existing | Authors or reuses the VM Insights DCR |
| Log Analytics workspace | law-vmi-lab |
Sets the DCR destination |
| (automatic) | Managed identity | Enabled if absent, so AMA can authenticate |
| (automatic) | DCR association | Binds the DCR to this VM |
Part C — Enable VM Insights with the az CLI (the repeatable path)
This is how you onboard at scale. The CLI approach installs the agents as extensions and associates a DCR. We create a VM Insights DCR, then attach the agents and the association.
Step 9 — Create a VM Insights performance DCR. The cleanest portable way is to author the DCR from a JSON spec. Create the file:
cat > /tmp/vmi-dcr.json <<'JSON'
{
  "location": "centralindia",
  "kind": "Linux",
  "properties": {
    "dataSources": {
      "performanceCounters": [
        {
          "name": "VMInsightsPerfCounters",
          "streams": [ "Microsoft-InsightsMetrics" ],
          "samplingFrequencyInSeconds": 60,
          "counterSpecifiers": [ "\\VmInsights\\DetailedMetrics" ]
        }
      ]
    },
    "destinations": {
      "logAnalytics": [
        { "name": "laDest", "workspaceResourceId": "__WS_ID__" }
      ]
    },
    "dataFlows": [
      { "streams": [ "Microsoft-InsightsMetrics" ], "destinations": [ "laDest" ] }
    ]
  }
}
JSON
sed -i "s|__WS_ID__|$WS_ID|g" /tmp/vmi-dcr.json
The \VmInsights\DetailedMetrics specifier is the VM Insights shorthand for the full curated counter set — you do not have to list each counter. Create the DCR:
az monitor data-collection rule create \
  -g $RG -n dcr-vmi-perf -l $LOC \
  --rule-file /tmp/vmi-dcr.json \
  --query "{name:name, kind:kind}" -o table
DCR_ID=$(az monitor data-collection rule show -g $RG -n dcr-vmi-perf --query id -o tsv)
echo "DCR resource ID: $DCR_ID"
Expected: a DCR named dcr-vmi-perf. Save $DCR_ID.
Step 10 — Install the Azure Monitor Agent extension. (Skip if you already enabled via the portal in Part B and are using the same VM — installing twice is idempotent but unnecessary.)
az vm extension set \
  -g $RG --vm-name $VM \
  --name AzureMonitorLinuxAgent \
  --publisher Microsoft.Azure.Monitor \
  --enable-auto-upgrade true \
  --query "{name:name, state:provisioningState}" -o table
Expected: provisioningState = Succeeded. (For Windows VMs, the name is AzureMonitorWindowsAgent.)
Step 11 — Install the Dependency Agent (maps only). Only needed for the dependency map. On Linux it depends on AMA being present first.
az vm extension set \
  -g $RG --vm-name $VM \
  --name DependencyAgentLinux \
  --publisher Microsoft.Azure.Monitoring.DependencyAgent \
  --settings '{"enableAMA":"true"}' \
  --query "{name:name, state:provisioningState}" -o table
Expected: provisioningState = Succeeded. The "enableAMA":"true" setting tells the Dependency Agent to feed the Azure Monitor Agent (the current model) rather than the legacy agent. (Windows: DependencyAgentWindows.)
Step 12 — Associate the DCR with the VM. This is the step that makes the agent actually collect — the one people forget.
VM_ID=$(az vm show -g $RG -n $VM --query id -o tsv)
az monitor data-collection rule association create \
  --name dcra-vmi \
  --rule-id "$DCR_ID" \
  --resource "$VM_ID" \
  --query "{name:name, state:provisioningState}" -o table
Expected: provisioningState = Succeeded. Now the agent has its instruction sheet.
The CLI steps and what each one is responsible for:
| Step | Command | Responsible for | Skip when |
|---|---|---|---|
| 9 | data-collection rule create |
The collection contract | Reusing an existing VM Insights DCR |
| 10 | vm extension set (AMA) |
The collection engine | Already installed (portal/other) |
| 11 | vm extension set (Dependency) |
The map data | You only want performance |
| 12 | data-collection rule association create |
Binding rule → VM | Never skip — no association, no data |
Part D — The Bicep version (infrastructure as code)
For repeatable fleet onboarding, declare the workspace, DCR, agents, and association as code. This Bicep enables performance-and-maps on one VM by symbolic name; loop or modularise it for many.
@description('Existing VM name and location')
param vmName string
param location string = resourceGroup().location

resource workspace 'Microsoft.OperationalInsights/workspaces@2023-09-01' = {
  name: 'law-vmi-lab'
  location: location
  properties: {
    sku: { name: 'PerGB2018' }
    retentionInDays: 30
  }
}

resource dcr 'Microsoft.Insights/dataCollectionRules@2023-03-11' = {
  name: 'dcr-vmi-perf'
  location: location
  kind: 'Linux'
  properties: {
    dataSources: {
      performanceCounters: [
        {
          name: 'VMInsightsPerfCounters'
          streams: [ 'Microsoft-InsightsMetrics' ]
          samplingFrequencyInSeconds: 60
          counterSpecifiers: [ '\\VmInsights\\DetailedMetrics' ]
        }
      ]
    }
    destinations: {
      logAnalytics: [
        { name: 'laDest', workspaceResourceId: workspace.id }
      ]
    }
    dataFlows: [
      { streams: [ 'Microsoft-InsightsMetrics' ], destinations: [ 'laDest' ] }
    ]
  }
}

resource vm 'Microsoft.Compute/virtualMachines@2024-07-01' existing = {
  name: vmName
}

resource ama 'Microsoft.Compute/virtualMachines/extensions@2024-07-01' = {
  parent: vm
  name: 'AzureMonitorLinuxAgent'
  location: location
  properties: {
    publisher: 'Microsoft.Azure.Monitor'
    type: 'AzureMonitorLinuxAgent'
    typeHandlerVersion: '1.0'
    autoUpgradeMinorVersion: true
    enableAutomaticUpgrade: true
  }
}

resource depAgent 'Microsoft.Compute/virtualMachines/extensions@2024-07-01' = {
  parent: vm
  name: 'DependencyAgentLinux'
  location: location
  dependsOn: [ ama ]   // Dependency Agent needs AMA present first
  properties: {
    publisher: 'Microsoft.Azure.Monitoring.DependencyAgent'
    type: 'DependencyAgentLinux'
    typeHandlerVersion: '9.10'
    autoUpgradeMinorVersion: true
    settings: { enableAMA: 'true' }
  }
}

resource dcra 'Microsoft.Insights/dataCollectionRuleAssociations@2023-03-11' = {
  name: 'dcra-vmi'
  scope: vm
  properties: {
    dataCollectionRuleId: dcr.id
  }
}
Deploy and confirm:
az deployment group create -g $RG \
  --template-file vmi.bicep \
  --parameters vmName=$VM \
  --query "properties.provisioningState" -o tsv
Expected: Succeeded. This is the version to commit and reuse; the association (dcra) is what most hand-rolled templates miss.
Part E — Validate that data is actually flowing
Never trust the dashboard until you have confirmed each stage. Validate bottom-up.
Step 13 — Confirm the extensions are healthy.
az vm extension list -g $RG --vm-name $VM \
  --query "[].{name:name, state:provisioningState}" -o table
Expected: AzureMonitorLinuxAgent = Succeeded, and (for maps) DependencyAgentLinux = Succeeded.
Step 14 — Confirm the DCR association exists.
az monitor data-collection rule association list \
  --resource "$VM_ID" \
  --query "[].{name:name, dcr:dataCollectionRuleId}" -o table
Expected: a row pointing at dcr-vmi-perf. If this is empty, the agent has no instructions — go back to Step 12.
Step 15 — Query InsightsMetrics for performance data (wait ~5–10 min after enabling).
az monitor log-analytics query \
  -w $(az monitor log-analytics workspace show -g $RG -n $WS --query customerId -o tsv) \
  --analytics-query "InsightsMetrics | where TimeGenerated > ago(15m) | summarize n=count() by Namespace, Name | order by n desc | take 10" \
  -o table
Expected: rows for namespaces like Processor, Memory, LogicalDisk, Network with non-zero counts. This proves the performance pipeline end to end.
Step 16 — Query VMConnection for map data (maps only; allow 15–25 min).
az monitor log-analytics query \
  -w $(az monitor log-analytics workspace show -g $RG -n $WS --query customerId -o tsv) \
  --analytics-query "VMConnection | where TimeGenerated > ago(30m) | summarize connections=count() by Computer, Direction | take 10" \
  -o table
Expected (once the Dependency Agent has observed traffic): rows with connection counts. An empty result early on is normal; if it is still empty after ~30 minutes, jump to the troubleshooting section’s “map empty” entry.
The validation ladder — run these in order, stop at the first failure:
| Check | Command / blade | Pass looks like | If it fails |
|---|---|---|---|
| Agent installed | az vm extension list |
AMA Succeeded |
Reinstall AMA (Step 10); check VM is running |
| Has managed identity | az vm identity show |
SystemAssigned present |
az vm identity assign |
| DCR associated | ... association list |
Row → your DCR | Create association (Step 12) |
| Perf data arriving | KQL on InsightsMetrics |
Rows in last 15 min | Check DCR streams/destination; egress |
| Map data arriving | KQL on VMConnection |
Rows in ~30 min | Confirm Dependency Agent + its egress |
| Charts render | Portal → Insights → Performance | Lines, not “no data” | Widen time range; recheck above |
Part F — Read the results
Step 17 — Performance tab. In Insights → Performance, the charts show CPU %, Available Memory, Logical Disk Space Used %, Disk IOPS / latency, and Bytes Sent/Received, with aggregation and time range controls. The lower grid lists all monitored VMs — sort by available memory to find the starved box across your fleet.
Step 18 — Map tab (maps only). In Insights → Map, the VM is a node; expand it for processes and their connections. Green links are healthy; a link with failures is flagged. Click a connection for the remote IP/port and success/failure counts (the VMConnection data) — this is where you confirm “VM A → VM B on 1433” and spot an unexpected link.
Step 19 — Query the tables directly. The portal is just queries; run your own. A few useful ones:
// Available memory (MB) over the last hour for this VM
InsightsMetrics
| where TimeGenerated > ago(1h) and Namespace == "Memory" and Name == "AvailableMB"
| summarize avg(Val) by bin(TimeGenerated, 5m), Computer
| order by TimeGenerated desc
// Failed outbound connections by remote port (needs maps / VMConnection)
VMConnection
| where TimeGenerated > ago(1h) and Direction == "outbound"
| summarize attempts=sum(LinksEstablished), failed=sum(LinksFailed) by DestinationPort
| where failed > 0
| order by failed desc
// Logical disk free space % per disk
InsightsMetrics
| where TimeGenerated > ago(1h) and Namespace == "LogicalDisk" and Name == "FreeSpacePercentage"
| summarize min(Val) by tostring(todynamic(Tags)["vm.azm.ms/mountId"]), Computer
Expected: tabular results you can pin to a workbook or wrap in a log alert.
Part G — Teardown
Step 20 — Delete everything. One resource-group delete removes the VM, workspace, DCR, association, and extensions.
az group delete -n $RG --yes --no-wait
Expected: the delete begins in the background. Cost note: a B2s for an hour is a few rupees and one VM’s ingestion is a fraction of a rupee — deleting the resource group stops all of it.
| Lab part | What you proved | Real-world analogue |
|---|---|---|
| A | Workspace + VM with identity exist | The prerequisites every onboarding needs |
| B | Portal enablement works and what it installs | First VM; learning the experience |
| C | CLI enablement is scriptable | Onboarding a fleet repeatably |
| D | Bicep makes it declarative + reviewable | Fleet onboarding in IaC / policy |
| E | Data actually flows (bottom-up checks) | The 90-second “is it working” gate |
| F | Charts, map, and KQL answer real questions | Day-to-day investigation |
| G | Teardown leaves nothing billing | Lab hygiene |
Common mistakes & troubleshooting
The failure modes are few and almost always one broken stage in the pipeline. Scan the table, then read the detail for the row that matches.
| # | Symptom | Root cause | Confirm (exact cmd / portal path) | Fix |
|---|---|---|---|---|
| 1 | Agent installed, no data at all | No DCR associated with the VM | az monitor data-collection rule association list --resource <vmId> (empty) |
Create the association (lab Step 12) |
| 2 | Agent “installed” but failing / no data | VM has no managed identity | az vm identity show -g <rg> -n <vm> (empty) |
az vm identity assign -g <rg> -n <vm> |
| 3 | Charts work, map is empty | Dependency Agent missing or its egress blocked | az vm extension list (no DependencyAgent*); allow 25 min |
Install Dependency Agent; open outbound 443 |
| 4 | No data, agent shows errors | Outbound to AMA endpoints blocked (NSG/firewall/proxy) | az vm extension list shows failed; agent logs |
Allow AMA endpoints / Azure Monitor service tag |
| 5 | Duplicate / confusing data | Legacy Log Analytics agent (MMA) still installed | Extensions list shows MicrosoftMonitoringAgent/OmsAgentForLinux |
Remove the legacy agent; keep AMA only |
| 6 | Data goes to the wrong workspace | DCR destination points elsewhere | az monitor data-collection rule show ... --query properties.destinations |
Edit DCR destination or associate the right DCR |
| 7 | Portal says “no data for selected period” | Time range before data started / clock skew | Widen the time picker; check TimeGenerated in KQL |
Use a wider range; wait for first ingestion |
| 8 | Higher-than-expected cost | Maps on everywhere / sample rate too high | Usage table by DataType; DCR samplingFrequencyInSeconds |
Maps only where needed; raise sample interval |
| 9 | Some counters missing | DCR counter set trimmed / wrong specifier | Inspect DCR performanceCounters |
Use \VmInsights\DetailedMetrics or add counters |
| 10 | Extension stuck provisioning | VM stopped/deallocated, or guest agent unhealthy | az vm get-instance-view power state; WAAgent |
Start the VM; repair the Azure VM guest agent |
The entries that bite hardest, expanded:
1. Agent installed but no data at all. The number-one mistake: you installed AMA (and maybe the Dependency Agent) but never created the DCR association, so the agent has no instruction sheet and collects nothing. Confirm: az monitor data-collection rule association list --resource "$VM_ID" returns empty. Fix: create the association pointing at a VM Insights DCR (lab Step 12). The portal “Enable” flow does this for you — pure CLI/Bicep onboarding is where it gets dropped.
2. No managed identity. AMA authenticates with the VM’s managed identity to download its DCR. If the VM has none, it can’t fetch config and produces no data. Confirm: az vm identity show -g <rg> -n <vm> is empty. Fix: az vm identity assign -g <rg> -n <vm>; no role grant is needed for the agent to read its own DCR. For Arc servers, the Arc agent supplies the identity.
3. Map empty though charts work. Either the Dependency Agent isn’t installed (you chose performance-only, or it failed) or its outbound is blocked — or it simply hasn’t had time, since the first map can take 15–25 minutes. Confirm: az vm extension list shows no DependencyAgentLinux/DependencyAgentWindows. Fix: install the Dependency Agent (lab Step 11) with enableAMA=true and allow outbound 443 to the Azure Monitor endpoints.
5. Legacy agent still present. A migrated VM may still carry the retired Log Analytics agent (MMA/OMS) and old Service Map; running it alongside AMA produces duplicate/confusing data. Confirm: extensions list shows MicrosoftMonitoringAgent (Windows) or OmsAgentForLinux. Fix: remove the legacy agent — the modern map comes from the Dependency Agent + AMA, not Service Map. (The Log Analytics agent retired in August 2024.)
8. Cost higher than expected. VM Insights cost is Log Analytics ingestion, and the two big multipliers are maps everywhere (VMConnection volume on chatty VMs) and a low sample interval. Confirm: query the Usage table grouped by DataType; check the DCR’s samplingFrequencyInSeconds. Fix: enable maps only where you need topology, leave the rest on performance-only, and keep sampling at 60 s.
Best practices
- Standardise on one (or few) DCRs and associate at scale via Azure Policy (
DeployIfNotExists) so every new VM is onboarded automatically — don’t click per-VM in production. - Default to performance-only; opt specific VMs into maps. Most VMs need charts and alerts, not topology. Reserve maps (and its
VMConnectioncost) for tiers where you investigate dependencies. - Always confirm the managed identity and the DCR association — the two silent “no data” causes. Bake both checks into your onboarding script or pipeline.
- Keep sampling at 60 seconds unless you have a reason. Finer sampling multiplies ingestion linearly; change the DCR (one edit, all VMs) only for a specific need.
- Consolidate workspaces so cross-VM queries and the fleet workbook work without cross-workspace joins, and retention/cost/RBAC are governed centrally.
- Set retention to the question, not the maximum — performance and connection data is most useful recent, and long retention multiplies cost.
- Alert on the in-guest signals host metrics miss — available memory, logical-disk free %, and (with maps) failed-connection rate — via log alerts on
InsightsMetrics/VMConnection. - Remove the legacy Log Analytics agent during onboarding — MMA/OMS + Service Map alongside AMA duplicates data and confuses the map.
- Onboard scale sets via the model, not per-instance, so new VMSS instances are monitored automatically as they scale out.
- Use the same DCR pattern for Arc servers — identical AMA + Dependency Agent + DCR shape, so hybrid boxes match Azure VMs in IaC.
- Validate before you trust. Run the bottom-up ladder (extension → identity → association →
InsightsMetrics→VMConnection); a green portal banner is not proof of data.
Security notes
- Managed identity, not keys. AMA authenticates with the VM’s managed identity — no workspace keys to store, leak, or rotate. Keep the identity enabled; the agent needs no extra role to read its own DCR.
- Least privilege on the workspace. Control who can read VM Insights data with Azure RBAC on the workspace (and table-level RBAC for sensitive estates). The map reveals topology — treat read access as you would network diagrams.
- Mind what the map exposes.
VMConnection/VMBoundPortenumerate internal IPs, ports, and process names — operationally useful, but a map of your topology. Restrict workspace read access and avoid exporting it broadly. - Egress, not ingress. The agents make outbound 443 to Azure Monitor endpoints; you open no inbound ports for VM Insights. Allow the AzureMonitor service tag outbound, keep inbound locked.
- Private networking where required. Route agent traffic through Azure Monitor Private Link Scope (AMPLS) so collection stays on private endpoints rather than the public internet.
- Governed onboarding. Use Azure Policy to enforce the agent and DCR association — an operational and security control, ensuring no production VM is silently unmonitored.
| Control | Mechanism | Protects against |
|---|---|---|
| No stored secrets | Managed identity auth | Leaked workspace keys |
| Workspace read scoping | Azure RBAC on the workspace | Topology/connection data exposure |
| Outbound-only collection | 443 egress to AzureMonitor tag | Inbound attack surface |
| Private collection | Azure Monitor Private Link Scope | Data traversing the public internet |
| Enforced monitoring | Azure Policy DeployIfNotExists | Unmonitored (blind) production VMs |
Cost & sizing
VM Insights itself has no licence fee — the cost is Log Analytics ingestion and retention. Two levers dominate, both under your control: whether maps are on (VMConnection is the single largest contributor on busy VMs) and the sampling frequency (60 s default; halving the interval roughly doubles InsightsMetrics volume). Rough orders of magnitude (they vary with traffic): a performance-only VM ingests tens of MB/day; with maps it can run several times that, dominated by connection records. A handful of performance-only VMs cost a few hundred rupees a month; turning maps on across a chatty fleet is where the bill grows, and the free monthly Log Analytics allowance can cover a small lab.
To right-size: leave most VMs on performance-only, enable maps on the subset you investigate, keep sampling at 60 s, set retention to your real lookback need, and consider a Commitment Tier once steady ingestion is predictable. Watch the Usage table to see which tables drive spend.
| Cost driver | What you pay for | How to control it | Watch-out |
|---|---|---|---|
InsightsMetrics ingestion |
Perf counters per VM | Keep sampling at 60 s | Finer sampling = linear cost rise |
VMConnection etc. (maps) |
Connection/process data | Maps only where needed | Chatty VMs dominate the bill |
| Retention | Days of data kept | Tune to real lookback | Long retention multiplies storage cost |
| Workspace pricing tier | Per-GB vs Commitment Tier | Commitment Tier at steady volume | Estimate before committing |
| Number of monitored VMs | Per-VM ingestion × count | Onboard what you need | Fleet-wide maps adds up fast |
| Setup | Approx monthly INR (small estate) | What it buys |
|---|---|---|
| 1 VM, performance-only | ~₹100–300 | Resource charts + alerting |
| 1 VM, performance + maps | ~₹400–900 | Above + dependency map |
| 5 VMs, performance-only | ~₹500–1,500 | Fleet charts + alerts |
| 4 VMs, performance + maps | ~₹2,500–4,000 | Full topology (Meridian’s case) |
| Lab (1 VM, 1 hour) | < ₹10 | This article’s hands-on |
(Figures are indicative — confirm against current Azure Monitor pricing for your region; the cost is Log Analytics, not VM Insights.)
Interview & exam questions
1. What are the three components of VM Insights and how do they fit together? The Azure Monitor Agent (collects guest performance counters inside the VM), the Dependency Agent (observes connections/processes for the map, optional), and a Data Collection Rule (declares what to collect and which Log Analytics workspace to send it to). The agent downloads its DCR using the VM’s managed identity and ships data to the workspace, where the portal renders charts and the map.
2. What is the difference between the two VM Insights enablement options? Performance counters only installs just the Azure Monitor Agent and writes performance counters to InsightsMetrics — charts but no map. Performance and dependency maps additionally installs the Dependency Agent, which populates VMConnection, VMComputer, VMProcess, and VMBoundPort and draws the dependency map, at higher ingestion cost.
3. An agent shows “provisioning succeeded” but no data appears. What’s the first thing to check? Whether a Data Collection Rule is associated with the VM. The agent collects nothing without a DCR — az monitor data-collection rule association list --resource <vmId> should return a rule. A missing association is the most common “no data” cause, especially with CLI/Bicep onboarding.
4. How does the Azure Monitor Agent authenticate, and why does it matter? It uses the VM’s managed identity (system- or user-assigned) to authenticate to Azure and fetch its DCR — no workspace keys, unlike the legacy agent. If the VM has no managed identity, the agent can’t pull its configuration and produces no data, so enabling an identity is part of onboarding.
5. Which Log Analytics tables does VM Insights write, and what’s in each? InsightsMetrics (performance counters: CPU, memory, disk, network), and with maps: VMComputer (machine properties), VMProcess (processes), VMBoundPort (listening ports), and VMConnection (observed connections with success/failure counts and remote IP/port).
6. The performance charts work but the dependency map is empty. Why? Either the Dependency Agent isn’t installed (you chose performance-only, or the extension failed) or its outbound 443 is blocked — or it simply hasn’t had time, since the first map can take 15–25 minutes to populate. Confirm the extension is present and egress is allowed, then wait.
7. What replaced the legacy Log Analytics agent, and what should you do with an inherited MMA install? The Azure Monitor Agent replaced the Log Analytics agent (MMA/OMS), which retired in August 2024. On a VM still carrying MMA and Service Map, remove the legacy agent so it doesn’t run alongside AMA and produce duplicate/confusing data.
8. How do you onboard a whole fleet to VM Insights consistently? Author the VM Insights DCR(s) once and associate them via Azure Policy (DeployIfNotExists) so every new VM gets the agent and association automatically, rather than clicking per-VM. For scale sets, apply the agent/DCR through the scale-set model so new instances are covered as they scale.
9. What are the main drivers of VM Insights cost and how do you control them? Cost is Log Analytics ingestion, driven mainly by whether maps are enabled (VMConnection volume) and the sampling frequency (60 s default). Control it by enabling maps only where needed, keeping sampling at 60 s, tuning retention, and considering a Commitment Tier at steady volume.
10. Does VM Insights work on non-Azure servers? Yes — on Azure Arc-enabled servers it uses the same Azure Monitor Agent + Dependency Agent + Data Collection Rule model, with the Arc agent providing the managed identity. The onboarding shape is identical, which is why standardising the IaC pays off across hybrid estates.
11. Why might VM Insights data land in a workspace you’re not looking at? Because the DCR’s destination points to a different Log Analytics workspace than the one you’re querying. Check properties.destinations.logAnalytics on the associated DCR; consolidating on few workspaces avoids the mismatch.
12. How does VM Insights differ from the platform Metrics blade? Platform Metrics are the hypervisor’s outside-the-guest view (host CPU, disk, network at the VM boundary). VM Insights runs an agent inside the guest to collect what the host can’t see — available memory, per-logical-disk free space/latency, per-process data, and (with maps) connections — and stores it as queryable logs.
These map to AZ-104 (Administrator) — monitor and maintain Azure resources, configure VM Insights, Log Analytics, and the Azure Monitor Agent — and touch AZ-204 where app teams use the data for diagnostics. A compact cert mapping:
| Question theme | Primary cert | Objective area |
|---|---|---|
| VM Insights components / enablement | AZ-104 | Monitor resources with Azure Monitor |
| Azure Monitor Agent + DCR | AZ-104 | Configure data collection |
| Log Analytics tables / KQL | AZ-104 / AZ-204 | Query and analyse monitoring data |
| Cost / workspace design | AZ-104 | Configure Log Analytics workspaces |
| Arc-enabled servers | AZ-104 / AZ-800 | Monitor hybrid resources |
Quick check
- Name the three components installed/configured when you “enable VM Insights,” and which one is optional.
- You enabled VM Insights via the CLI, the agent extension is “Succeeded,” but no data appears. What single thing do you check first?
- Which Log Analytics table holds the performance counters, and which holds the observed connections behind the map?
- The performance charts work but the dependency map is blank after five minutes. Give two possible reasons.
- What authenticates the Azure Monitor Agent to Azure, and what breaks if it’s missing?
Answers
- The Azure Monitor Agent (collects performance counters), the Dependency Agent (observes connections for the map — optional, only in the maps option), and a Data Collection Rule associated to the VM (declares what to collect and where to send it).
- Whether a Data Collection Rule is associated with the VM (
az monitor data-collection rule association list --resource <vmId>). Without an association the agent has no instructions and collects nothing — the most common CLI/Bicep onboarding miss. InsightsMetricsholds the performance counters (CPU, memory, disk, network);VMConnectionholds the observed connections (with the rest of the map data inVMComputer/VMProcess/VMBoundPort).- (a) The Dependency Agent isn’t installed (performance-only chosen, or the extension failed), or its outbound 443 is blocked; (b) it simply hasn’t populated yet — the first map can take 15–25 minutes. Either is plausible at the five-minute mark.
- The VM’s managed identity authenticates the agent so it can fetch its DCR. If the VM has no managed identity, the agent can’t download its configuration and produces no data.
Glossary
- VM Insights — the Azure Monitor experience for monitoring VM performance and dependencies; an opinionated application of AMA + DCR, not a separate provisioned service.
- Azure Monitor Agent (AMA) — the current in-guest agent that collects performance counters (and logs); authenticates via managed identity; replaced the Log Analytics agent.
- Dependency Agent — the optional extension that observes TCP connections and processes to populate the dependency map and the
VM*tables. - Data Collection Rule (DCR) — an Azure resource declaring what to collect (counters, sample rate) and where to send it (workspace); the agent’s instruction sheet.
- DCR Association — the binding that attaches a DCR to a specific VM/VMSS; without it the agent collects nothing.
- Log Analytics workspace — the store VM Insights data lands in; owns retention, cost, and RBAC.
InsightsMetrics— the table holding VM Insights performance counters (namespace, counter name, value, VM).VMConnection— the table of observed connections with direction, remote IP/port, and success/failure counts; the data behind the map.VMComputer/VMProcess/VMBoundPort— map-supporting tables: machine properties, processes, and listening ports.- Managed identity — the VM’s Azure identity used by AMA to authenticate and fetch its DCR; no keys involved.
- Sampling frequency — how often the DCR samples counters (VM Insights default 60 s); lower = more data and cost.
- Service Map (legacy) — the deprecated map solution paired with the retired Log Analytics agent; superseded by VM Insights maps.
- Log Analytics agent (MMA/OMS) — the legacy guest agent that retired in August 2024; replaced by AMA.
\VmInsights\DetailedMetrics— the counter specifier shorthand for the full VM Insights performance counter set in a DCR.- Azure Monitor Private Link Scope (AMPLS) — the mechanism to route agent collection over private endpoints instead of the public internet.
Next steps
You can now enable VM Insights correctly, validate it, and read the results. Build outward:
- Next: Azure Monitor data collection rules and the agent architecture — go deeper on the DCR/AMA model you just used, including collecting logs and events.
- Related: Create and design a Log Analytics workspace — get the destination right: region, retention, RBAC, and cost.
- Related: KQL for Log Analytics: summarize, join and time-series queries — turn
InsightsMetricsandVMConnectioninto the queries and workbooks you’ll live in. - Related: Metric alerts and action groups: email and SMS — alert on available memory, disk free %, and failed connections so the data pages you.
- Related: No data in Log Analytics: ingestion troubleshooting — the deeper “why isn’t data arriving” playbook when the validation ladder fails.
- Related: Metrics vs Log Analytics: when to use which — understand the trade-off VM Insights makes by storing guest data as logs.