You enabled “VM insights” on a fleet of forty virtual machines, waited the obligatory fifteen minutes, opened Log Analytics, and ran Perf | take 10. Nothing. Or worse — you got CPU counters but no memory, Syslog from Ubuntu but nothing from the RHEL boxes, and a bill that doubled the month after someone “turned on monitoring everywhere.” If you came up on the old Log Analytics agent (the MMA/OMS agent, the one with a workspace ID and a key baked into a config file), the new world feels backwards. There is no agent config to edit. The machine collects exactly what a separate object — a Data Collection Rule — tells it to, and that object lives somewhere else entirely, attached by a third object you have probably never heard of. Telemetry does not flow because an agent is installed; it flows because an agent, a rule, and an association all line up.
This article is the mental model for that pipeline. We follow a single performance counter from the moment the Azure Monitor Agent (AMA) samples it on a VM, through the Data Collection Rule (DCR) that decides it is worth collecting, optionally through a Data Collection Endpoint (DCE) and an ingestion-time transform, into a table in a Log Analytics workspace where a KQL query finally returns it. Every hop is a place the data can stop, each configured by a distinct Azure resource with its own RBAC, cost lever, and failure mode. The design is declarative and reusable on purpose: one DCR can target a thousand machines, one machine can be “multi-homed” to several DCRs, and the same rule renders identically in the portal, az, and Bicep because it is just an ARM resource.
By the end you will look at any VM that is “not sending data” and name the exact missing link — agent not provisioned, no DCR associated, the counter not in the rule’s data sources, the workspace not in its destinations, a DCE the private path requires but nobody created, or a transform that quietly dropped the row. And you will understand why this model — more moving parts than the agent it replaces — is the one Microsoft is standing behind, with the legacy agents retired and AMA the only path forward for new collection.
What problem this solves
The old Log Analytics agent had one fatal property: collection configuration was global to the workspace. You set “collect these performance counters” and “collect Syslog facility auth at level warning” once, at the workspace level, and every agent reporting to that workspace got the same instructions. Want the database VMs to collect SQL counters and slow-query logs, but the web tier to collect only CPU and IIS logs? You could not, cleanly. Want one machine to send security events to a Sentinel workspace and performance data to a cheaper ops workspace? Not without running two agents. The configuration had no scope smaller than the workspace, so you over-collected everywhere to satisfy the noisiest tenant, and you paid for it on every machine.
Data Collection Rules invert that. A DCR is a standalone, reusable definition of what to collect and where to send it, completely decoupled from both the machine and the workspace. You attach a DCR to a machine with an association, a thin link object. One rule, many machines. One machine, many rules. The web tier gets a lightweight CPU-and-IIS DCR; the database tier gets a heavy SQL DCR; the security team’s DCR targets only the events they care about and routes to their workspace. Nothing over-collects to satisfy a neighbour, because scope is now per-association, not per-workspace. This is the single biggest reason the platform moved, and it is why “just install the agent” no longer collects anything by itself.
What breaks without this: teams install AMA at scale and see nothing, because installing the agent and telling it what to collect are now two separate acts. Or they migrate from the legacy agent, leave it running “just in case,” and pay twice while both ingest the same Syslog into the same table — duplicate rows in every query. Or they build one giant DCR for the whole estate, lose the per-tier cost control that was the entire point, and are back to over-collection with extra steps. Who hits this: anyone monitoring IaaS VMs or Azure Arc-enabled servers, anyone running Microsoft Sentinel (which collects through DCRs now), and anyone inheriting an MMA-era setup who must move before the legacy agent’s retirement leaves them blind.
Here is the field in one frame — every object in the pipeline, what it is, and what it owns:
| Object | What it is | Scope | What it decides | You create it… |
|---|---|---|---|---|
| Azure Monitor Agent (AMA) | A VM extension that samples and ships telemetry | Per machine | How data leaves the box | Once per VM (extension/Policy/insights) |
| Data Collection Rule (DCR) | A reusable definition of sources + destinations | Standalone resource | What to collect and where to send | Once per collection profile |
| DCR Association (DCRA) | A link binding a DCR to a machine | Per machine ↔ DCR | Which machines get which rules | Once per machine-to-rule pairing |
| Data Collection Endpoint (DCE) | A regional ingestion/config endpoint | Regional resource | The network path for config + data | When private link / custom logs need it |
Transform (transformKql) |
A KQL snippet inside the DCR | Per data-flow in a DCR | Filtering/shaping at ingest time | Inline, when you need to drop or reshape |
| Log Analytics workspace | The store telemetry lands in | Regional resource | Retention, cost, query, RBAC of data | Per workspace topology decision |
Learning objectives
By the end of this article you can:
- Trace a single performance counter from AMA on the VM, through the DCR, DCE and transform, into a Log Analytics table, and name what each hop decides.
- Explain why installing AMA collects nothing on its own, and create the DCR + association that actually starts the flow.
- Choose between multi-homing (many DCRs on one VM) and a single consolidated DCR, and articulate the cost and blast-radius trade-off.
- Author DCR data sources for performance counters, Syslog, Windows Event Logs and custom text logs using the correct stream names and
xPathQueries/facility syntax. - Decide when you actually need a Data Collection Endpoint (private link, custom text/JSON logs, Logs Ingestion API) and when AMA works without one.
- Write an ingestion-time transform that drops noise or projects columns before billing, and explain where in the pipeline it runs.
- Diagnose the canonical “no data” failures — missing agent, missing association, counter not in the rule, wrong destination, DCE network gap, transform dropped the row — each with the exact
az/KQL confirmation. - Plan a migration off the Log Analytics/MMA agent without double-ingesting, and pick the right workspace and DCR topology for cost.
Prerequisites & where this fits
You should be comfortable with Azure Monitor basics: that it has two primary data types — metrics (numeric, near-real-time, cheap, in a time-series store) and logs (schema’d rows in Log Analytics, queried with KQL) — living in different places. If that split is fuzzy, read The Azure Monitor Data Platform Explained: Metrics, Logs, Traces and Where Each Lives first. You should know what a Log Analytics workspace is; How to Create a Log Analytics Workspace: Region, Access Modes and Resource-Context RBAC covers the topology and RBAC this builds on. Basic az (Cloud Shell, JSON output) and a little KQL are assumed; KQL That Earns Its Keep: summarize, join, make-series and Time-Bucketing Azure Logs is the companion for querying what lands.
Where this sits: DCRs and AMA are the collection layer for VM and server telemetry, fed by the workspace design and the metrics-vs-logs model upstream. Adjacent is diagnostic settings — the other collection mechanism, for PaaS resource logs (a SQL database, a storage account) rather than guest-OS telemetry; see How to Wire Diagnostic Settings: Routing Resource Logs to Workspace, Storage and Event Hub. Downstream is what you do with the data: alerting via How to Create Your First Metric Alert and Action Group for Email, SMS and Push, and full-stack correlation via Azure Monitor and Application Insights: Full-Stack Observability. The boundary worth memorising: AMA + DCR collects from inside the guest OS; diagnostic settings collects from the Azure control plane of a resource. Two pipelines, often confused.
A quick map of who owns each layer of the collection pipeline, so you escalate to the right team mid-incident:
| Layer | What lives here | Usually owned by | Failure it can cause |
|---|---|---|---|
| VM guest OS | The AMA extension, the agent process | Platform / VM team | No data if agent unhealthy / not installed |
| DCR + association | What-to-collect, machine↔rule links | Monitoring / platform team | Data flows but the wrong data, or none |
| DCE + networking | Private link, NSG/firewall egress | Network team | Agent can’t reach config or ingestion |
| Workspace | Tables, retention, RBAC, cost | Monitoring / FinOps | Data lands but is unqueryable or over-retained |
| Transform | The transformKql in the DCR |
Monitoring team | Rows silently dropped or mis-shaped |
Core concepts
Five mental models make every later decision obvious.
Collection is declarative and lives outside the machine. With the legacy agent you edited workspace-level config and the agent obeyed. With AMA there is nothing to configure on the box. The agent is a dumb-but-fast pump; its instructions are a Data Collection Rule, an Azure resource that lives independently in a resource group. The agent fetches its effective config (the union of all DCRs associated to it) and collects exactly that; change the DCR and every associated machine picks up the change within minutes — no redeploy, no per-machine edit. The corollary that trips everyone: an agent with no associated DCR collects nothing. It is installed, healthy, idle, and silent.
The association is the load-bearing link. A DCR does not “know” its machines and a machine does not “know” its DCRs. A separate object — a Data Collection Rule Association (DCRA) — binds one DCR to one machine (or to other targets like a DCE). Think of the DCR as a playlist and the association as the act of adding that playlist to a specific device. The same playlist on many devices, many playlists on one device. This indirection is why the model is reusable, and it is the first thing to check when data is missing: not “is the agent installed?” but “is a DCR associated to this machine, and does that DCR collect what I expect?”
Streams are the contract between source and destination. Inside a DCR, a data source (a Syslog facility set, a performance counter list) is tagged with a stream name — a typed schema like Microsoft-Perf, Microsoft-Syslog, Microsoft-Event, or a custom Custom-MyTable_CL. A data flow then maps streams to destinations. Built-in streams land in known tables (Perf, Syslog, Event); custom streams land in a custom table you defined. The stream name is the glue: if your data source emits Microsoft-Perf but your data flow forgets to route that stream to your workspace, the data is sampled and then dropped on the floor inside the DCR.
The pipeline is a series of valves, each able to stop the flow. Sample on the VM (AMA) → match a data source in an associated DCR → reach the destination over the network (direct, or via a DCE) → pass any ingestion-time transform → write to the table. A failure at any valve produces the identical symptom — “no data” — which is why blind retries waste hours. Diagnosis is about localising to one valve. The transform valve is the sneaky one: a transformKql that ends in | where Computer != "noisy-host" will silently and correctly drop exactly the rows you are searching for.
Two data types still split here. AMA collects logs (Perf, Syslog, Event, custom tables — schema’d rows in Log Analytics) via DCRs, and can also send guest-OS metrics to the metrics store via an “Azure Monitor Metrics” destination. Same agent, two destinations, two cost models, two query surfaces. This article focuses on the logs path where DCRs do their richest work, but a single data flow can fork a counter to both a workspace (as Perf) and the metrics store at once.
The vocabulary in one table
Pin down every moving part before the deep sections. The glossary at the end repeats these for lookup; this is the mental model side by side:
| Concept | One-line definition | Where it lives | Why it matters |
|---|---|---|---|
| AMA | The agent extension that samples + ships | On the VM/Arc machine | No agent → no collection at all |
| DCR | Reusable what-to-collect definition | Standalone ARM resource | The brain; the agent is just the muscle |
| DCRA (association) | Binds a DCR to a machine/DCE | Per pairing | Missing it → agent collects nothing |
| DCE | Regional ingest/config endpoint | Regional resource | Needed for private link + custom logs |
| Data source | One source type + its settings | Inside a DCR | Defines what (counters, facilities) |
| Stream | Typed schema name on a source | Inside a DCR | The contract source→destination |
| Data flow | Maps streams → destinations (+ transform) | Inside a DCR | Routes the data; can drop it |
| Transform | transformKql shaping rows at ingest |
Inside a data flow | Filters/reshapes before billing |
| Destination | A workspace or the metrics store | Referenced in a DCR | Where data lands |
| Multi-homing | One machine associated to many DCRs | Across DCRAs | Per-tier collection without one mega-rule |
How the pieces wire together (the association model)
Start with the smallest working unit and build out. To get a single counter from a single VM into Log Analytics, exactly four things must be present and aligned — drop any one and the flow stops with no error surfaced to the agent. Each is a separate resource with its own lifecycle, which is why this feels like more ceremony than the old agent:
| # | Must exist | Lifecycle | Created via | If missing |
|---|---|---|---|---|
| 1 | AMA extension on the VM | Once per machine | Extension / Policy / VM insights | Nothing samples |
| 2 | DCR with the counter in sources and your workspace in destinations | Once per collection profile | az/Bicep, reused fleet-wide |
No instructions / nowhere to land |
| 3 | Association binding that DCR to that VM | Once per machine↔rule pair | az/Bicep, or Policy at scale |
Agent collects nothing |
| 4 | The Log Analytics workspace | Once per topology decision | Created up front, reused for years | No store for the rows |
In practice you create the workspace once, author a handful of DCRs (one per “collection profile” — web tier, DB tier, security), and let Azure Policy fan out both the agent installs and the associations across the fleet, so the per-machine count of objects you hand-manage stays near zero.
Installing AMA (and why that’s only step one)
The Azure Monitor Agent is a VM extension (AzureMonitorWindowsAgent / AzureMonitorLinuxAgent). It needs a managed identity to authenticate to Azure Monitor — a system-assigned identity is simplest, a user-assigned identity is the right call at fleet scale because you assign one identity to many VMs and manage RBAC once. (For the broader trade-off see System-Assigned vs User-Assigned Managed Identity: Patterns and Pitfalls.)
Install on a single VM with the CLI:
# Linux: install the Azure Monitor Agent extension (uses the VM's managed identity)
az vm extension set \
  --resource-group rg-observability \
  --vm-name vm-web-01 \
  --name AzureMonitorLinuxAgent \
  --publisher Microsoft.Azure.Monitor \
  --enable-auto-upgrade true
// AMA as a VM extension — keep --enable-auto-upgrade so minor versions self-patch
resource ama 'Microsoft.Compute/virtualMachines/extensions@2023-09-01' = {
  parent: vmWeb01
  name: 'AzureMonitorLinuxAgent'
  location: location
  properties: {
    publisher: 'Microsoft.Azure.Monitor'
    type: 'AzureMonitorLinuxAgent'
    typeHandlerVersion: '1.0'
    autoUpgradeMinorVersion: true
    enableAutomaticUpgrade: true
  }
}
At this point the agent is running and collecting nothing. Confirm it is healthy but idle:
# Extension provisioning state should be "Succeeded"; if it isn't, fix the install first
az vm extension show -g rg-observability --vm-name vm-web-01 \
  --name AzureMonitorLinuxAgent \
  --query "{state:provisioningState, version:typeHandlerVersion}" -o table
If the extension itself fails to provision, that is a separate class of problem — agent install, not collection config — covered in VM Extension Provisioning Failed: Diagnosing the CSE and Agent Errors. Assume here it succeeded.
The DCR: data sources, destinations, data flows
A DCR has three internal parts that you must keep mentally distinct, because each is a separate failure point:
| DCR part | What it holds | Example | Failure if wrong |
|---|---|---|---|
dataSources |
What to collect + the stream it emits | Perf counters → Microsoft-Perf |
Counter absent → never sampled |
destinations |
Named targets (workspaces, metrics) | A Log Analytics workspace by ID | Workspace absent → nowhere to land |
dataFlows |
Maps streams → destinations (+ transform) |
Microsoft-Perf → that workspace |
Mapping absent → sampled then dropped |
Create a minimal performance-counter DCR with the CLI by passing a rule file:
# Author the rule body once, then create the DCR from it
az monitor data-collection rule create \
  --resource-group rg-observability \
  --name dcr-linux-perf \
  --location eastus \
  --rule-file dcr-linux-perf.json
The Bicep form makes the three parts explicit and is the version you should keep in source control:
resource dcr 'Microsoft.Insights/dataCollectionRules@2023-03-11' = {
  name: 'dcr-linux-perf'
  location: location
  properties: {
    dataSources: {
      performanceCounters: [
        {
          name: 'cpuMemDisk'
          streams: [ 'Microsoft-Perf' ]
          samplingFrequencyInSeconds: 60
          counterSpecifiers: [
            'Processor(*)\\% Processor Time'
            'Memory(*)\\% Used Memory'
            'Logical Disk(*)\\% Used Space'
          ]
        }
      ]
    }
    destinations: {
      logAnalytics: [
        { name: 'laOps', workspaceResourceId: workspace.id }
      ]
    }
    dataFlows: [
      {
        streams: [ 'Microsoft-Perf' ]
        destinations: [ 'laOps' ]   // the name must match a destination above
      }
    ]
  }
}
The three-part split is the whole game. counterSpecifiers decides what the agent samples. destinations.logAnalytics declares where it can land. dataFlows is the wire that connects the stream to the destination — and it is the part people forget, producing the maddening case where the counter is in the rule, the workspace is in the rule, and still no data, because no data flow joins them.
The association: binding the DCR to the machine
Now create the link. Without this, the two perfectly-good objects above never meet:
# Associate the DCR to the VM (this is what actually starts collection)
az monitor data-collection rule association create \
  --name dcra-vm-web-01-perf \
  --rule-id $(az monitor data-collection rule show -g rg-observability -n dcr-linux-perf --query id -o tsv) \
  --resource $(az vm show -g rg-observability -n vm-web-01 --query id -o tsv)
// The association is a child resource of the *target* (the VM), pointing at the DCR
resource dcra 'Microsoft.Insights/dataCollectionRuleAssociations@2023-03-11' = {
  name: 'dcra-vm-web-01-perf'
  scope: vmWeb01                       // associated to the VM…
  properties: {
    dataCollectionRuleId: dcr.id       // …and pointing at the DCR
  }
}
Within a few minutes, Perf | where Computer == "vm-web-01" | take 10 returns rows. The flow is live. Note the symmetry that makes scale work: to add a hundred more machines, you create a hundred associations to the same DCR — or, far better, let a single Azure Policy assignment create them for you across a scope.
Multi-homing: one machine, many DCRs
A single machine can be associated to multiple DCRs at once, and its effective configuration is the union of them all. This is multi-homing, and it is the feature that replaces the old per-workspace over-collection. You build small, single-purpose DCRs and compose them per machine:
| DCR | Collects | Routes to | Attach to |
|---|---|---|---|
dcr-base-perf |
CPU/mem/disk counters | Ops workspace | Every VM |
dcr-linux-syslog |
Syslog auth,daemon warn+ |
Ops workspace | Linux VMs |
dcr-win-security |
Security event channel | Sentinel workspace | Domain-joined VMs |
dcr-sql-deep |
SQL counters + slow logs | Ops workspace | DB tier only |
A database VM might be associated to dcr-base-perf + dcr-linux-syslog + dcr-sql-deep (three associations, three DCRs, one machine). A web VM gets only the first two. The security team owns dcr-win-security and routes to their workspace without touching anyone else’s rules. The trade-off table for the core design choice:
| Approach | Pros | Cons | Use when |
|---|---|---|---|
| One mega-DCR per estate | One object to manage; simple | Over-collects for some tiers; one change risks everything; one workspace only | Tiny, uniform fleets |
| Multi-homed small DCRs | Per-tier cost control; small blast radius; multi-workspace | More objects; must track which machine has which | Most real estates |
| Per-machine bespoke DCR | Total control | Unmanageable at scale; defeats reuse | Almost never |
Practical limits to respect (they are real and you will hit them on a big estate): a machine can be associated to a bounded number of DCRs, and a single DCR can target a large but finite number of resources. Treat “a handful of composable DCRs per machine” as the design target rather than dozens.
Data sources: collecting counters, Syslog, events and custom logs
The dataSources block declares what to collect; each source type has its own schema, stream, and selector syntax. Get the stream name and the selector right and the rest of the pipeline just carries it. Memorise the stream column below — it is what your data flow must route:
Source type (dataSources.*) |
Collects | Stream | Lands in table | OS |
|---|---|---|---|---|
performanceCounters |
Perf counter samples | Microsoft-Perf |
Perf |
Win + Linux |
syslog |
Linux Syslog by facility/level | Microsoft-Syslog |
Syslog |
Linux |
windowsEventLogs |
Windows Event channels via XPath | Microsoft-Event |
Event |
Windows |
logFiles (text) |
Custom text log files | Custom-<table>_CL |
Your *_CL table |
Win + Linux |
iisLogs |
IIS W3C logs | Microsoft-W3CIISLog |
W3CIISLog |
Windows |
extensions (VM insights) |
Map + perf via Dependency agent | Microsoft-InsightsMetrics etc. |
InsightsMetrics, VMConnection |
Win + Linux |
prometheusForwarder |
Prometheus metrics (AKS/VM) | Microsoft-PrometheusMetrics |
Managed Prometheus | Linux/AKS |
Performance counters
Counters use the classic Object(Instance)\Counter specifier syntax — identical wording to Windows PerfMon, and AMA maps the Linux equivalents. Use (*) for all instances. Sampling frequency is per data source, in seconds; do not sample CPU every second across a thousand machines unless you enjoy the bill.
performanceCounters: [
  {
    name: 'hotCounters'
    streams: [ 'Microsoft-Perf' ]
    samplingFrequencyInSeconds: 60          // 60s is a sane default; 10s is expensive at scale
    counterSpecifiers: [
      'Processor(_Total)\\% Processor Time'
      'Memory(*)\\Available MBytes'
      'LogicalDisk(_Total)\\Disk Reads/sec'
      'Network Interface(*)\\Bytes Total/sec'
    ]
  }
]
Sampling-frequency guidance, because it is the quietest cost lever in the whole pipeline:
| Sampling frequency | Rows/counter/day | Use for | Cost note |
|---|---|---|---|
| 10 s | ~8,640 | Short-lived perf investigations only | 6× the 60 s volume |
| 60 s | ~1,440 | The default for ongoing collection | Baseline |
| 300 s | ~288 | Capacity trending, stable hosts | 5× cheaper than 60 s |
| 600 s+ | ~144 | Long-term trend on cheap tiers | Cheapest; too coarse to alert on |
Syslog (Linux)
Syslog is collected by facility and minimum log level. AMA reconfigures the host’s rsyslog/syslog-ng to forward to it, so you pick facilities (auth, daemon, cron, kern, local0–local7, …) and a level threshold (Info, Warning, Error, …). Collect auth at Info and a busy box floods the table; at Warning+ you keep the signal.
syslog: [
  {
    name: 'authAndDaemon'
    streams: [ 'Microsoft-Syslog' ]
    facilityNames: [ 'auth', 'authpriv', 'daemon' ]
    logLevels: [ 'Warning', 'Error', 'Critical', 'Alert', 'Emergency' ]
  }
]
The Syslog level/facility decision table — the levels are cumulative from your chosen minimum upward:
| Facility | Typical content | Recommended min level | Why |
|---|---|---|---|
auth / authpriv |
sudo, ssh, PAM | Info (security) / Warning (ops) |
Security wants sign-in detail; ops doesn’t |
daemon |
service daemons | Warning |
Info is chatty and low-value |
cron |
scheduled jobs | Warning |
Only care when a job errors |
kern |
kernel | Warning |
Info floods on busy hosts |
local0–local7 |
app-defined | depends on app | Whatever your apps log there |
Windows Event Logs
Windows events use XPath queries (xPathQueries) — the exact filter syntax from Event Viewer’s “filter current log → XML.” This lets you collect, say, only Error and Warning from the System and Application channels, not the whole firehose:
windowsEventLogs: [
  {
    name: 'sysAndApp'
    streams: [ 'Microsoft-Event' ]
    xPathQueries: [
      'System!*[System[(Level=1 or Level=2 or Level=3)]]'        // Critical, Error, Warning
      'Application!*[System[(Level=1 or Level=2 or Level=3)]]'
      'Security!*[System[(EventID=4624 or EventID=4625)]]'        // logon success/failure only
    ]
  }
]
The token before the ! names the channel; the bracketed expression filters. Collecting Security!* unfiltered is among the most common accidental cost blowups on Windows — scope it with event IDs or route it to a Sentinel DCR with a transform.
Custom text logs (and why they force a DCE)
To collect an app’s own text log (/var/log/myapp/app.log, C:\logs\app.log), you use a logFiles data source, define a custom table (MyApp_CL) with an explicit schema, emit a custom stream (Custom-MyApp_CL), and — crucially — custom text/JSON collection requires a Data Collection Endpoint. This is the most common reason a DCE becomes mandatory in an otherwise DCE-free setup.
logFiles: [
  {
    name: 'myAppLog'
    streams: [ 'Custom-MyApp_CL' ]      // custom stream → custom *_CL table
    filePatterns: [ '/var/log/myapp/app*.log' ]
    format: 'text'
    settings: { text: { recordStartTimestampFormat: 'ISO 8601' } }
  }
]
The custom-log table itself is created separately (via the workspace’s table API / Bicep Microsoft.OperationalInsights/workspaces/tables), and the DCR’s data flow routes Custom-MyApp_CL to it, optionally through a transform that parses the raw line into typed columns. We come back to that transform shortly.
When you need a Data Collection Endpoint (and when you don’t)
A Data Collection Endpoint (DCE) is a regional resource exposing two things: a configuration access endpoint (where the agent fetches its effective DCR config) and a logs ingestion endpoint (where data is posted). For the common cases — performance counters, Syslog, Windows events going to a workspace over the public path — AMA does not need a DCE you create; it uses built-in regional endpoints. Create one only when a specific feature demands it.
The decision table — this is the part people get wrong in both directions:
| Scenario | DCE required? | Why |
|---|---|---|
| Perf / Syslog / Event → workspace, public network | No | AMA uses built-in regional endpoints |
Custom text or JSON logs (logFiles) |
Yes | The custom-log pipeline requires a DCE |
| Logs Ingestion API (your own app posting logs) | Yes | The API posts to a DCE’s ingestion endpoint |
| Private Link (no public ingestion path) | Yes | The DCE is what you put in the AMPLS scope |
| Windows events / Linux Syslog over private link | Yes | Any private-network collection needs a DCE |
| Sentinel data connectors using DCRs | Depends | Some connectors provision a DCE for you |
So the rule of thumb: standard guest-OS counters and logs over the public path need no DCE; custom logs, the ingestion API, and any private-link path all do. When you do need one, it is a small resource:
# Create a regional DCE (only when a feature above requires it)
az monitor data-collection endpoint create \
  --resource-group rg-observability \
  --name dce-eastus \
  --location eastus \
  --public-network-access Enabled    # set Disabled when fronting it with Private Link
resource dce 'Microsoft.Insights/dataCollectionEndpoints@2023-03-11' = {
  name: 'dce-eastus'
  location: location
  properties: {
    networkAcls: { publicNetworkAccess: 'Disabled' }   // private-link posture
  }
}
Two links matter when a DCE is in play: the DCR references the DCE (so the agent knows where to post), and for private link the DCE is added to an Azure Monitor Private Link Scope (AMPLS). Region rule: the DCE must be in the same region as the DCRs and machines that use it — you cannot post East US logs through a West Europe DCE. At multi-region scale, one DCE per region.
For the private-network design itself — AMPLS, private DNS, and the egress path — the mechanics are the same family as any PaaS private-link setup; see Private Endpoint vs Service Endpoint: Which One and Why and Private Link & Private DNS for Azure PaaS for the patterns this reuses.
Transforms: shaping and dropping data at ingest
A transform is a KQL snippet (transformKql) attached to a data flow inside a DCR. It runs in the ingestion pipeline after the agent ships the data but before it is written and billed. This placement is the entire value: a transform can drop rows you do not want to pay to store, redact or mask sensitive columns, parse a raw text line into typed columns, or project away noise columns — and because it runs pre-ingestion, dropped rows never hit your retention bill.
Where it sits in the pipeline, exactly:
| Stage | What runs | Billed? |
|---|---|---|
| 1. Sample on VM | AMA collects per the data source | No |
| 2. Ship | Agent posts to ingestion endpoint | No |
| 3. Transform | transformKql filters/reshapes the stream |
Decides what gets billed |
| 4. Write | Rows land in the destination table | Billed here |
| 5. Query | KQL reads the stored rows | Query-time only |
The transform’s input is a stream named source; you write KQL that reads from it and returns the shaped rows. A drop-noise example — keep only warning-and-above Syslog even if the data source over-collected, and throw away a chatty host:
source
| where SeverityLevel != "info"
| where ProcessName != "audisp-syslog"
| project-away EventTime          // drop a column you'll never query
A common transform-archetype reference — what each is for and the cost effect:
| Transform goal | KQL shape | Effect |
|---|---|---|
| Drop noise rows | source | where <keep-condition> |
Lower ingest + retention bill |
| Mask a field | ... | extend Email = "***" |
PII redacted before storage |
| Parse text → columns | source | parse RawData with ... |
Custom log becomes queryable typed rows |
| Project columns | ... | project Computer, Msg, TimeGenerated |
Smaller rows, less storage |
| Route to a different table | (per-flow transforms + multiple flows) | Split a stream across tables |
Wire a transform into the Bicep data flow with one extra property:
dataFlows: [
  {
    streams: [ 'Microsoft-Syslog' ]
    destinations: [ 'laOps' ]
    transformKql: 'source | where SeverityLevel != "info" | project-away EventTime'
  }
]
Hard caveats that bite: a transform must preserve TimeGenerated (drop it and ingestion fails), it operates per-row on the stream (it is not a cross-row aggregation engine), and an overly clever transform that silently filters everything is exactly the “no data” trap — when debugging missing rows, temporarily simplify the transform to source and see if the data returns. The transform is the most powerful and the most dangerous valve in the pipeline.
Architecture at a glance
Follow one performance counter left to right. On the far left the Azure Monitor Agent, installed as a VM extension on vm-web-01, samples Processor(_Total)\% Processor Time every 60 seconds, authenticating with the VM’s managed identity. It does not decide what to sample on its own — at startup and periodically it fetches its effective configuration from the control plane: the union of every Data Collection Rule bound to this machine through an association. Here one association links vm-web-01 to dcr-linux-perf, whose dataSources.performanceCounters is what told the agent to sample CPU at all. This is the loop the diagram makes concrete — the machine’s behaviour is dictated by an object that lives outside it.
The sampled row, tagged with the stream Microsoft-Perf, is shipped to the ingestion pipeline — directly over built-in regional endpoints for standard counters, or via a Data Collection Endpoint for a private-link path or a custom log. Inside the pipeline the DCR’s data flow maps Microsoft-Perf to the named destination (the workspace laOps), and any transform on that flow runs here, dropping or reshaping the row before it is written and billed. Only then does it land in the Perf table, where Perf | where ObjectName == "Processor" finally returns it. The numbered badges mark the places the flow most often dies — agent unhealthy, no association, stream not routed, or a transform that dropped the row — and the legend maps each to its symptom, confirmation command, and fix.
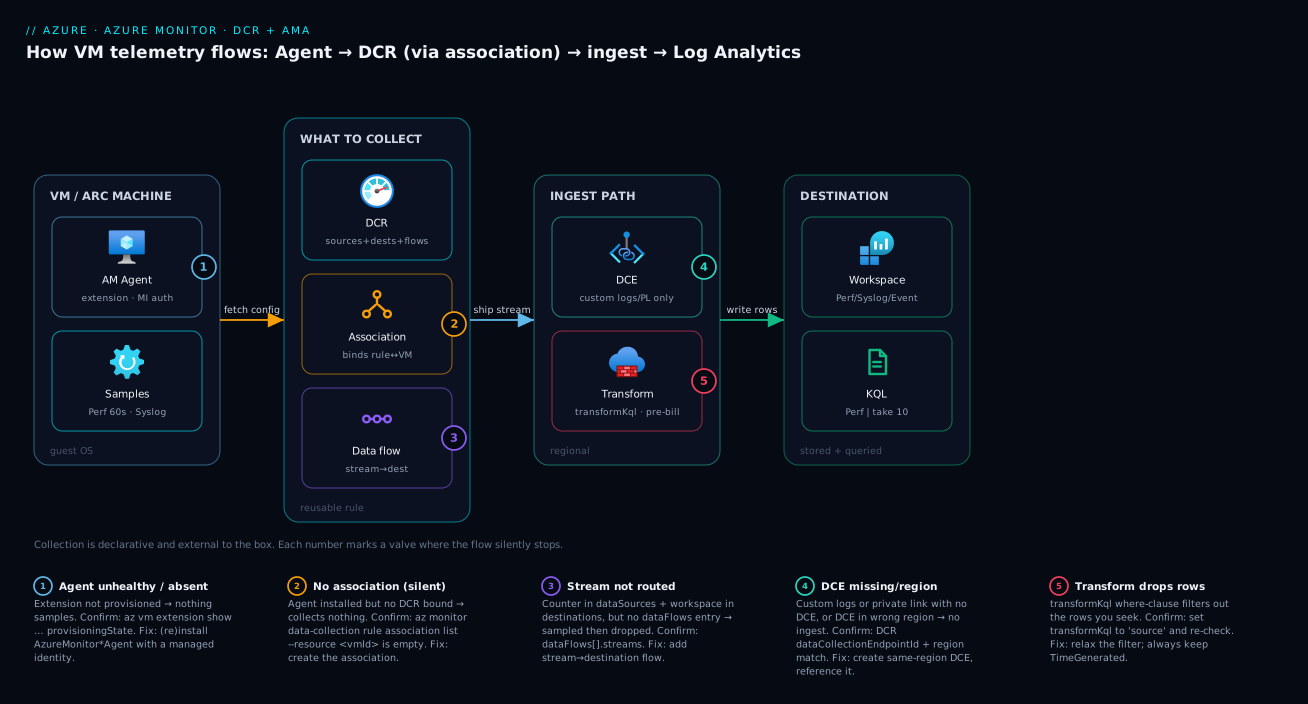
The shape to carry away: machine → rule (via association) → pipeline (via optional DCE) → destination, with a transform valve sitting just before the bill. Four objects, three of them outside the machine, every one a place to look when data is missing.
Real-world scenario
Northwind Retail ran a 60-VM Azure estate — a web tier, an app tier, and a SQL-on-IaaS tier — all monitored the old way: the Log Analytics agent on every box, workspace-level collection set to “all performance counters” and “Syslog auth + daemon at Info,” everything landing in one workspace. The monthly Log Analytics bill had crept to roughly ₹3.1 lakh (~US$3,700), and nobody could explain which tier drove it because every machine collected the same firehose. When Microsoft announced the legacy agent’s retirement, the platform team had to migrate to AMA anyway, and they used the move to fix the cost.
They found the cost driver by querying the workspace’s own usage table:
Usage
| where TimeGenerated > ago(30d)
| summarize GB = sum(Quantity) / 1000 by DataType
| order by GB desc
Syslog was 58% of ingestion. The auth facility at Info on the SQL boxes — which ran a chatty audit daemon — logged tens of thousands of info rows per host per day that no one ever queried. The web tier’s “all performance counters” was second: dozens of counters at 10-second sampling, a default someone had copied years earlier.
They rebuilt collection as four multi-homed DCRs: dcr-base-perf (six counters at 60 s, every VM); dcr-linux-syslog (auth/daemon at Warning+, plus a transform dropping the audit daemon, on Linux boxes); dcr-win-events (Windows scoped to Error/Warning plus specific logon event IDs); and dcr-sql-deep (SQL counters at 60 s, only the three DB VMs). Azure Policy created the base-perf and syslog associations across the estate automatically, so the team maintained four rules and a couple of Policy assignments rather than 60 bespoke configs.
The transform on the Syslog flow did the heaviest lifting:
source
| where SeverityLevel != "info"
| where not(ProcessName == "audisp-syslog" and SeverityLevel == "warning")
That single where — dropping info everywhere and the audit daemon’s warning-level chatter specifically — cut Syslog ingestion by 71% because it ran before billing. Perf volume fell by roughly two-thirds once 10-second sampling became 60-second and the counter list shrank from “all” to six. The migration also surfaced a classic double-bill: for two weeks the old MMA agent ran alongside AMA “to be safe,” and Syslog showed duplicate rows (the same message from two SourceSystem values) until they confirmed AMA parity per tier and removed the legacy agent. The new monthly bill landed at about ₹1.05 lakh (~US$1,250) — a two-thirds cut — with better signal, since the security team’s events now flowed to their own Sentinel DCR instead of drowning in info noise. The lesson: the cost lever was never the workspace, it was what each tier was told to collect — and DCRs are where you say it.
Advantages and disadvantages
The DCR + AMA model is strictly more capable than the legacy agent, but the extra power is extra moving parts. The honest trade-off:
| Advantages | Disadvantages |
|---|---|
| Per-tier, per-machine collection scope (no workspace-wide over-collection) | More objects to manage (agent + DCR + association + maybe DCE) |
| Reusable rules — one DCR → thousands of machines | “Install the agent” no longer collects anything by itself |
| Multi-homing — one machine → many rules → many workspaces | Association indirection is a new failure surface |
| Ingestion-time transforms cut cost before billing | A bad transform silently drops the data you want |
| Declarative, source-controllable ARM resources (Bicep/Policy) | DCE rules for custom logs/private link add networking work |
| Single agent for Windows + Linux, IaaS + Arc | Migration off legacy agent risks double-ingestion if rushed |
| Managed-identity auth (no workspace key in a file) | Effective config is a union — surprises when DCRs overlap |
Where each matters: per-tier scope and transforms matter most to cost-sensitive estates — the difference between a flat firehose and a tuned pipeline. Multi-homing matters most to orgs with separate security and ops workspaces, where one machine feeds both without two agents. The disadvantages bite hardest during migration (double-ingestion) and on first setup (the silent “agent installed but no DCR” trap). For greenfield the model is simply better; the friction is real only when moving an MMA-era setup and unlearning workspace-global config.
Hands-on lab
This walk-through stands up the full pipeline on one Linux VM and proves a counter flows, then tears it down. It is free-tier-friendly if you stop the VM after — the ongoing cost is the VM and a few KB of ingestion (Log Analytics includes a small free ingestion allowance).
1. Set variables and create a resource group + workspace.
RG=rg-dcr-lab; LOC=eastus
az group create -n $RG -l $LOC
WS_ID=$(az monitor log-analytics workspace create -g $RG -n law-dcr-lab \
  --query id -o tsv)
2. Create a tiny Linux VM and install AMA.
az vm create -g $RG -n vm-dcr-lab --image Ubuntu2204 \
  --size Standard_B1s --admin-username azureuser --generate-ssh-keys

az vm extension set -g $RG --vm-name vm-dcr-lab \
  --name AzureMonitorLinuxAgent --publisher Microsoft.Azure.Monitor \
  --enable-auto-upgrade true
3. Author the DCR rule file (dcr-lab.json) collecting CPU + memory and Syslog daemon at Warning+, routing to the workspace. Replace <WS_ID> with the value of $WS_ID:
{
  "location": "eastus",
  "properties": {
    "dataSources": {
      "performanceCounters": [
        { "name": "perf", "streams": ["Microsoft-Perf"], "samplingFrequencyInSeconds": 60,
          "counterSpecifiers": ["Processor(_Total)\\% Processor Time", "Memory(*)\\% Used Memory"] }
      ],
      "syslog": [
        { "name": "sys", "streams": ["Microsoft-Syslog"], "facilityNames": ["daemon"],
          "logLevels": ["Warning","Error","Critical","Alert","Emergency"] }
      ]
    },
    "destinations": {
      "logAnalytics": [ { "name": "la", "workspaceResourceId": "<WS_ID>" } ]
    },
    "dataFlows": [
      { "streams": ["Microsoft-Perf","Microsoft-Syslog"], "destinations": ["la"] }
    ]
  }
}
4. Create the DCR and associate it to the VM.
az monitor data-collection rule create -g $RG -n dcr-lab \
  --location $LOC --rule-file dcr-lab.json

DCR_ID=$(az monitor data-collection rule show -g $RG -n dcr-lab --query id -o tsv)
VM_ID=$(az vm show -g $RG -n vm-dcr-lab --query id -o tsv)

az monitor data-collection rule association create \
  --name dcra-lab --rule-id "$DCR_ID" --resource "$VM_ID"
5. Generate a little load and wait ~10 minutes, then query. Expected output: rows in Perf.
# SSH in and spin the CPU briefly so the counter has something to show
az vm run-command invoke -g $RG -n vm-dcr-lab --command-id RunShellScript \
  --scripts "timeout 30 yes > /dev/null"
// In the Log Analytics query pane (law-dcr-lab):
Perf
| where Computer == "vm-dcr-lab" and ObjectName == "Processor"
| summarize avg(CounterValue) by bin(TimeGenerated, 1m)
| order by TimeGenerated desc
6. Confirm the association from the CLI (the fast “is it even wired?” check):
az monitor data-collection rule association list --resource "$VM_ID" \
  --query "[].{name:name, dcr:dataCollectionRuleId}" -o table
7. Tear down to stop all charges:
az group delete -n $RG --yes --no-wait
If step 5 returns nothing after 15 minutes, jump to the troubleshooting section — the most likely cause is a forgotten step-4 association or a workspace ID pasted wrong in the rule file.
Common mistakes & troubleshooting
Every “no data” symptom looks identical; the skill is localising it to one valve. Work this table top to bottom — it is ordered by how often each cause is the real one:
| # | Symptom | Root cause | Confirm (exact command / path) | Fix |
|---|---|---|---|---|
| 1 | Agent installed, zero data | No DCR associated | az monitor data-collection rule association list --resource <vmId> returns empty |
Create the association |
| 2 | Some counters/logs missing | Source not in any DCR | Inspect dataSources of associated DCRs |
Add the counter/facility/XPath |
| 3 | Source in rule, still nothing | No data flow routes the stream | Check dataFlows[].streams includes it |
Add stream→destination flow |
| 4 | Data flow exists, still nothing | Wrong/missing destination | Confirm destinations has the right workspace ID |
Fix the workspace resource ID |
| 5 | Rows dropped unpredictably | Transform filters them out | Temporarily set transformKql to source |
Correct the where/projection |
| 6 | Custom text log never arrives | No DCE (custom logs require one) | DCR has no dataCollectionEndpointId |
Create DCE, reference it in DCR |
| 7 | Private-link VMs send nothing | DCE not in AMPLS / DNS broken | AMPLS scope + private DNS for the DCE | Add DCE to AMPLS; fix private DNS |
| 8 | Extension won’t provision | Agent install failure, not config | provisioningState != Succeeded |
See VM-extension troubleshooting |
| 9 | Duplicate Syslog rows | Both MMA and AMA running | Syslog | distinct SourceSystem shows two |
Remove the legacy agent |
| 10 | Agent healthy, config stale | Effective config not refreshed | Restart agent / re-check associations | Wait for refresh; reapply DCR |
| 11 | Linux Syslog empty | rsyslog not forwarding to AMA |
systemctl status rsyslog; AMA logs |
Restart rsyslog; reinstall AMA |
| 12 | Wrong region, no ingest | DCE/DCR/VM region mismatch | Compare location of each |
Co-locate DCE with DCR + VMs |
The single most common failure: agent without a rule
If you take one thing from this section: an installed agent with no associated DCR is silent and looks broken but isn’t. Confirmation is one command — list associations on the VM; empty means the agent has no instructions. This accounts for the majority of “AMA doesn’t work” reports, because the legacy-agent muscle-memory says “install = collect,” and that is no longer true.
# The first command to run for ANY "no data from this VM" report
az monitor data-collection rule association list \
  --resource $(az vm show -g rg-observability -n vm-web-01 --query id -o tsv) \
  -o table
When the data flow is the missing link
The subtler failure: counter present, workspace present, no rows. Almost always a missing dataFlows entry — the stream is collected and the destination exists, but nothing wires them. Dump the rule and read all three parts together:
az monitor data-collection rule show -g rg-observability -n dcr-linux-perf \
  --query "{sources:properties.dataSources, dests:properties.destinations, flows:properties.dataFlows}" -o jsonc
If flows[].streams does not contain the stream emitted by the source (Microsoft-Perf), or flows[].destinations does not name a destination, the data is sampled and discarded inside the DCR. Add the flow.
Confirming the transform is the culprit
When rows arrive intermittently or a subset is missing, suspect the transform first. Set transformKql to the identity (source) on that flow, wait for the next ingestion, and see if the missing rows return; if they do, your where was too aggressive. The agent’s own logs (/var/log/azure/Microsoft.Azure.Monitor.AzureMonitorLinuxAgent/ on Linux) and the workspace’s Operation table also report transform and ingestion errors — but the identity transform is the fastest test.
For the broader “data isn’t arriving” investigation spanning ingestion latency, capping, and table mismatches beyond the DCR, No Logs Showing Up? Troubleshooting Empty Log Analytics Tables and Ingestion Gaps is the companion playbook.
Best practices
- Author small, single-purpose DCRs and multi-home them. One base-perf rule for everyone, one Syslog rule for Linux, one events rule for Windows, one deep rule per workload. Compose per machine via associations. Never build one estate-wide mega-DCR.
- Drive associations with Azure Policy at scale.
Configure machines to be associated with a Data Collection Rule(built-in policy) and the AMA-install policies fan out agents and links across a scope automatically — you maintain a few rules, not thousands of links. - Set sampling frequency deliberately. 60 s is the default; reserve 10 s for short live investigations and use 300 s for trend-only counters. Sampling frequency is the quietest, biggest cost lever.
- Scope Windows Security and Linux
authcollection tightly. Filter by event ID / level / facility, or route them through a transform. Unfiltered Security events are the classic Windows cost blowout. - Use transforms to drop noise before it is billed. A
whereintransformKqlis cheaper than retention. Mask PII at ingest too — it never lands in storage. - Always preserve
TimeGeneratedin transforms and test new transforms against a single VM before fleet-wide rollout. A bad transform is a silent data-loss bug. - Use a user-assigned managed identity for AMA at fleet scale. One identity, RBAC granted once, attached to every VM — far cleaner than per-VM system identities.
- Co-locate DCE, DCR and machines in one region. Cross-region ingestion paths fail or add latency; create one DCE per region when private link or custom logs require it.
- Only create a DCE when a feature demands it (custom logs, ingestion API, private link). Do not provision DCEs reflexively.
- During migration, run parity-then-cutover, never long overlap. Confirm AMA collects what MMA did per tier, then remove the legacy agent the same day to avoid double-ingestion.
- Keep DCRs in source control as Bicep and deploy via pipeline. They are ARM resources; treat them like any other infra and review changes — a one-line
counterSpecifiersedit changes collection on every associated machine. - Watch the
Usagetable monthly and attribute ingestion toDataTypeand tier so cost regressions surface before the invoice does.
Security notes
The pipeline touches identity, network and data — secure all three. Identity: AMA authenticates with a managed identity, not a workspace key in a file as the legacy agent did — a genuine win, because there is no shared secret to leak. Restrict who can author DCRs and associations: the Monitoring Contributor role can create rules and links, so it can redirect what is collected and where it lands — treat it as sensitive, especially when a DCR can route to a security/Sentinel workspace.
Network: for sensitive estates, force collection over Private Link so guest-OS telemetry never traverses the public internet — create a DCE, put it in an Azure Monitor Private Link Scope (AMPLS), configure private DNS, and set the DCE’s publicNetworkAccess to Disabled. The egress controls that gate the agent’s outbound calls are ordinary Network Security Groups: Rules, Priorities, and the Default Deny Explained and firewall rules — if you lock down egress, allow the Azure Monitor / DCE endpoints or the agent goes silent.
Data: the most under-appreciated control here is the transform. Because it runs before storage, a transformKql that masks a column (extend Email = "REDACTED") or drops a sensitive field means the PII never lands in Log Analytics — a far stronger guarantee than masking at query time. Route security-relevant collection (sign-ins, Security events) to the security team’s workspace via a dedicated DCR, so that data is governed by their workspace RBAC.
Cost & sizing
Log Analytics bills primarily on data ingested (per GB) and secondarily on retention beyond the free period; metrics sent to the metrics store are far cheaper (platform metrics effectively free). So in the DCR world, what you tell each machine to collect is your bill — the agent is free, the VM compute is separate, and every lever that matters lives inside the DCR.
What drives the bill, ranked, with the lever:
| Cost driver | Why it dominates | The lever (in the DCR) | Typical saving |
|---|---|---|---|
| Over-broad Syslog / Events | Info-level firehose, unfiltered Security |
Raise min level; filter XPath; transform | 50–80% of that stream |
| High-frequency perf sampling | 10 s × many counters × many VMs | 60 s default; 300 s for trend | Up to 6× on perf |
| Collecting unused counters | “All counters” copied from old config | Curate counterSpecifiers |
Often 50%+ on perf |
| Long retention on chatty tables | Default retention applied to noise | Per-table retention; Basic/Aux table plans | Big on high-volume tables |
| Double-ingestion in migration | MMA + AMA both running | Cut over fast; remove legacy agent | The whole duplicate |
Rough INR/USD figures to anchor sizing (Azure list pricing varies by region and commitment tier; treat these as order-of-magnitude): pay-as-you-go Log Analytics ingestion sits around ₹250–290 (~US$3) per GB in the pay-as-you-go tier, dropping with commitment tiers (e.g. 100 GB/day) that can roughly halve the per-GB rate. A single VM collecting six counters at 60 s plus warning-level Syslog ingests on the order of tens of MB/day, so a handful of VMs stay inside or near the free ingestion allowance (a few GB/month is included per workspace). The blowups are always volume × fleet: 60 VMs at “all counters, 10 s, Info Syslog” can be 100× that, which is exactly how Northwind reached ₹3.1 lakh/month. Right-sizing is curation, not a cheaper SKU — and the transform lets you delete cost before it is incurred, which no retention setting can do after the fact. For the broader cost picture across Azure Monitor surfaces, Metrics vs Log Analytics: Choosing the Right Store for Speed, Cost and Retention covers when to keep data as a cheap metric instead of an expensive log row.
Interview & exam questions
These map to AZ-104 (monitoring VMs) and AZ-700/AZ-305 (observability design); the DCR/AMA model is current exam material now that the legacy agents are retired.
1. Why does installing the Azure Monitor Agent on a VM collect no data by itself? Because collection is declarative and external to the machine. AMA fetches its configuration from the Data Collection Rules associated to it; with no association, it has no instructions and stays idle. Installing the agent and telling it what to collect are two separate acts.
2. What is the relationship between a DCR, a machine, and an association? A DCR defines what to collect and where to send it; a machine runs the agent; a DCR association (DCRA) is the link object that binds a specific DCR to a specific machine. One DCR → many machines, one machine → many DCRs, all through associations.
3. What is multi-homing and why does it matter? Associating a single machine to multiple DCRs so its effective config is the union of them. It replaces legacy per-workspace over-collection with per-tier, per-purpose rules — e.g. a base-perf rule plus a security-events rule routing to a different workspace — without running multiple agents.
4. When do you need a Data Collection Endpoint? For custom text/JSON logs, the Logs Ingestion API, and any Private Link collection path. Standard performance counters, Syslog and Windows events going to a workspace over the public path do not need a DCE you create.
5. Where does a DCR transform run, and why does that placement matter? In the ingestion pipeline, after the agent ships but before the row is written and billed. So a transform that drops or masks rows reduces the storage/retention bill and removes PII before it ever lands — something no query-time or retention setting can do retroactively.
6. A counter is in the DCR’s data sources and the workspace is in its destinations, but no data arrives. What’s the likely cause?
A missing data flow. The dataFlows block must map the source’s stream (e.g. Microsoft-Perf) to a named destination; without that mapping the data is sampled and discarded inside the DCR.
7. How do AMA/DCR collection and diagnostic settings differ? AMA + DCR collect guest-OS telemetry (Perf, Syslog, Event, custom logs) from inside a machine. Diagnostic settings collect resource logs/metrics from the Azure control plane of a PaaS resource (SQL DB, storage account). Two different pipelines for two different sources.
8. You migrated from the Log Analytics agent to AMA and now see duplicate Syslog rows. Why?
Both agents are running and collecting the same facility into the same table; Syslog shows two SourceSystem/source values. The fix is to confirm AMA parity and remove the legacy agent — overlapping them doubles the bill.
9. What’s the cheapest way to cut ingestion cost from a noisy Syslog stream?
Filter at collection: raise the minimum log level (e.g. Warning+), narrow facilities, and add a transform (source | where …) to drop residual noise before billing. This is cheaper than any retention change because dropped rows are never ingested.
10. What authenticates AMA to Azure Monitor, and why is it more secure than the old agent? A managed identity (system- or user-assigned). Unlike the legacy agent, there is no workspace ID + shared key stored in a config file, so there is no static secret to leak or rotate.
11. How do you roll out AMA and DCR associations across hundreds of machines without per-VM work? Azure Policy — built-in policies install the agent and create the DCR association across a management-group/subscription scope, with remediation tasks for existing machines. You maintain a few DCRs and Policy assignments, not thousands of links.
12. What property must every transform preserve, and what’s the safest way to debug a transform you suspect is dropping data?
It must preserve TimeGenerated (omitting it fails ingestion). To debug, temporarily set transformKql to the identity source, wait for the next ingestion, and check whether the missing rows reappear.
Quick check
- You install AMA on a VM and see no data after 20 minutes. What is the very first command to run?
- A DCR has the counter in
dataSourcesand the workspace indestinations, but nothing arrives. What’s missing? - Name two scenarios that require a Data Collection Endpoint.
- Where in the pipeline does a
transformKqlrun, relative to billing? - What is “multi-homing” in the context of DCRs?
Answers
- List the DCR associations on the VM:
az monitor data-collection rule association list --resource <vmId>. An empty result means no rule is attached and the agent has no instructions — the single most common cause. - A data flow (
dataFlows) mapping the source’s stream (e.g.Microsoft-Perf) to the named destination. Without it the data is sampled and discarded inside the DCR. - Any two of: custom text/JSON log collection, the Logs Ingestion API, or any Private Link collection path.
- After the agent ships the data but before it is written and billed — so a transform that drops rows reduces the bill and removes data before storage.
- Associating a single machine to multiple DCRs so its effective configuration is the union of all of them — enabling per-tier collection and routing to multiple workspaces without multiple agents.
Glossary
- Azure Monitor Agent (AMA): The VM/Arc extension that samples guest-OS telemetry and ships it; configured externally by DCRs, authenticated by a managed identity.
- Data Collection Rule (DCR): A standalone ARM resource defining what to collect (data sources) and where to send it (destinations), wired by data flows.
- DCR Association (DCRA): The link object binding a specific DCR to a specific machine (or DCE); the thing that actually starts collection.
- Data Collection Endpoint (DCE): A regional resource exposing config-access and logs-ingestion endpoints; required for custom logs, the ingestion API, and private link.
- Data source: A configured collector inside a DCR (performance counters, Syslog, Windows events, custom log files) tagged with a stream.
- Stream: The typed schema name on a data source (e.g.
Microsoft-Perf,Microsoft-Syslog,Custom-MyTable_CL); the contract that data flows route. - Data flow: The mapping inside a DCR from streams to destinations, optionally carrying a transform.
- Transform (
transformKql): A KQL snippet on a data flow that filters/reshapes rows at ingest, before they are written and billed. - Destination: A target referenced by a DCR — a Log Analytics workspace or the Azure Monitor metrics store.
- Multi-homing: Associating one machine to multiple DCRs so its effective config is their union.
- Effective configuration: The merged set of all DCRs associated to a machine, which is what the agent actually collects.
- Log Analytics workspace: The regional store where log telemetry lands, queried with KQL, with its own retention, cost and RBAC.
- Log Analytics / MMA / OMS agent: The retired legacy agent with workspace-global config and a workspace key; replaced by AMA + DCRs.
- AMPLS (Azure Monitor Private Link Scope): The object that brings DCEs and workspaces onto a private-link network path.
- Azure Arc-enabled server: A non-Azure machine projected into Azure; AMA + DCRs collect from it identically to an Azure VM.
Next steps
- The Azure Monitor Data Platform Explained: Metrics, Logs, Traces and Where Each Lives — the metrics-vs-logs foundation this collection layer feeds.
- How to Wire Diagnostic Settings: Routing Resource Logs to Workspace, Storage and Event Hub — the other collection pipeline, for PaaS resource logs.
- No Logs Showing Up? Troubleshooting Empty Log Analytics Tables and Ingestion Gaps — the deeper “no data” playbook beyond the DCR itself.
- KQL That Earns Its Keep: summarize, join, make-series and Time-Bucketing Azure Logs — query the
Perf,SyslogandEventtables this pipeline fills. - How to Create Your First Metric Alert and Action Group for Email, SMS and Push — turn the telemetry you now collect into alerts.