A resource in Azure does not log to Log Analytics by default. This trips up almost everyone the first time: you stand up a Key Vault, an NSG, an Application Gateway or a SQL database, you open Log Analytics expecting to see who accessed which secret or which rule dropped which packet — and there is nothing. No error, no warning, just an empty table. The platform is emitting those logs internally; it simply has nowhere to send them until you tell it where. The thing that tells it where is a diagnostic setting — a small per-resource configuration that taps the resource’s resource logs and platform metrics and routes them to one or more destinations: a Log Analytics workspace, a Storage account, an Event Hub, or a partner/Marketplace solution. Until that setting exists, the data is generated and discarded.
This article is the implementation guide. We treat diagnostic settings not as a checkbox but as the plumbing layer of your entire observability and audit story — the one configuration that decides whether, six months from now, you can answer “who deleted that VM”, “which NSG rule dropped that connection”, “what query ran against that SQL DB”, or “is this Key Vault being probed”. You will learn exactly what a diagnostic setting captures (and what it deliberately does not), the difference between the three first-party destinations and when each is the right call, the meaning of log categories and category groups (allLogs, audit), and the per-resource limit that bites teams who try to fan out to too many places. Then you will do it end to end — in the portal, in az CLI, and in Bicep — on a real resource, validate that data actually lands, and tear it down. We finish with the at-scale story (Azure Policy DeployIfNotExists so every new resource gets a setting automatically) and the troubleshooting playbook for the number-one failure: “I configured it and still see no logs.”
By the end you will stop being surprised by empty tables. You will know that metrics and resource logs are different pipelines with different defaults, that the destination you pick has real cost and queryability consequences, that there is a hard cap of five diagnostic settings per resource, and that the single most common mistake — selecting categories but pointing at the wrong workspace, or expecting guest-OS logs from a setting that only sees the platform — is entirely avoidable once you understand the model.
What problem this solves
Every regulated, audited or simply well-run Azure estate needs a durable record of what its resources did: control-plane changes, data-plane access, security-relevant events, and the metrics that describe health over time. Azure generates this telemetry, but it is ephemeral by default — platform metrics are retained for a rolling window (around 93 days) and queryable only through the metrics explorer, while resource logs (the rich, per-service event streams like KeyVaultAuditEvent, NetworkSecurityGroupFlowEvent, SQLSecurityAuditEvents) are not persisted anywhere you can reach unless you create a diagnostic setting. No setting, no logs. There is no retroactive recovery: if a secret was exfiltrated last Tuesday and you only turn on Key Vault auditing today, last Tuesday is gone.
What breaks without this: audits fail because there is no evidence trail; incident response stalls because the forensic logs were never captured; cost optimisation is blind because per-resource metrics were never centralised; and SIEM/SOC pipelines (Microsoft Sentinel, a third-party SIEM via Event Hub) have no source data. Teams discover the gap at the worst possible moment — mid-incident, mid-audit — when the data simply is not there and cannot be conjured.
Who hits this: essentially everyone running production Azure, but it bites hardest on security and compliance teams (who assume “Azure logs everything” — it does not), platform teams onboarding hundreds of resources (who need the at-scale Policy story, not click-ops), and data engineers building near-real-time pipelines (who need the Event Hub destination and its partitioning model). The fix is not a product you buy; it is a configuration you apply correctly and consistently — and understanding the model so you apply it once, right.
To frame the field before the deep dive, here is what diagnostic settings touch, the question each answers, and where the data lands:
| Telemetry type | Example data | Captured by default? | Where a diagnostic setting sends it | Why you route it |
|---|---|---|---|---|
| Platform metrics | CPU %, request count, RU/s | Yes (93-day rolling, metrics store) | Workspace (AzureMetrics) / Storage / Event Hub |
Long-term trend, cross-resource KQL, export |
| Resource logs | Key Vault audits, NSG flow, SQL audit | No — discarded until routed | Workspace / Storage / Event Hub | Forensics, audit, security, troubleshooting |
| Activity log | Who created/deleted a resource | Yes (90-day, subscription-level) | Workspace / Storage / Event Hub | Control-plane audit, change tracking |
| Guest-OS metrics/logs | Perf counters, Windows Event Log | No — needs the Azure Monitor Agent | Workspace via DCR, not diagnostic settings | In-VM telemetry (a different pipeline) |
The fourth row is the one that catches people: a diagnostic setting on a VM gives you the platform’s view (host metrics, the VM resource’s own logs), not what is happening inside the guest OS — that is the Azure Monitor Agent (AMA) and a Data Collection Rule (DCR), a separate mechanism this guide flags but does not cover end to end.
Learning objectives
By the end of this article you can:
- Explain precisely what a diagnostic setting captures — resource logs and platform metrics — and what it does not (guest-OS telemetry, Application Insights instrumentation).
- Choose between the three first-party destinations — Log Analytics workspace, Storage account, Event Hub — using cost, queryability, retention and integration as the deciding factors.
- Read and select log categories and category groups (
allLogs,audit) for any resource, and know whenauditis a subset and when it is empty. - Create a diagnostic setting three ways — Azure portal,
az monitor diagnostic-settings create, and Bicep (Microsoft.Insights/diagnosticSettings) — and validate that data actually arrives. - Respect the hard limits: five settings per resource, one workspace/storage/event-hub per setting, and the destination-region rules.
- Deploy diagnostic settings at scale with Azure Policy
DeployIfNotExistsso every new resource of a type is configured automatically, and remediate existing resources. - Diagnose the canonical failures — “no data after configuring”, resource-specific vs resource-context table modes, dedicated vs Azure-diagnostics legacy tables, missing categories, and permission/managed-identity errors on the Policy path.
- Estimate and control the cost of routing logs, choosing the right destination and retention to keep the ingestion bill sane.
Prerequisites & where this fits
You should be comfortable with the Azure resource model (subscriptions, resource groups, the difference between the control plane and data plane), able to run az in Cloud Shell and read JSON output, and have at least one Log Analytics workspace to send data to. Familiarity with KQL helps for the validation queries but is not required to follow the steps. If you have never created a workspace, do that first — the companion guide Create & Design a Log Analytics Workspace with RBAC walks through it, and the workspace is the prerequisite destination for most of this article.
This sits at the base of the Observability & Governance stack. Conceptually it follows the data-platform model in Azure Monitor Data Platform: Metrics, Logs & Traces Explained — diagnostic settings are the ingestion tap for the “logs” pillar of that platform. It is upstream of everything you do with the data afterwards: alerting (Metric Alerts with Action Groups), querying, dashboards, and SIEM. It is distinct from, but often confused with, Application Insights (which instruments application code) and the Azure Monitor Agent (which collects guest-OS telemetry) — this guide is strictly about the resource/platform logs that Azure itself emits.
A quick map of which mechanism owns which telemetry, so you don’t wire the wrong one:
| You want… | Use this mechanism | Not this |
|---|---|---|
| Key Vault access audits, NSG flow, SQL audit | Diagnostic settings (this article) | AMA, App Insights |
| CPU/memory/disk inside a VM | Azure Monitor Agent + DCR | Diagnostic settings |
| Windows Event Log / syslog from a VM | Azure Monitor Agent + DCR | Diagnostic settings |
| App requests, dependencies, traces, exceptions | Application Insights SDK/auto-instr. | Diagnostic settings |
| “Who created/deleted this resource?” | Activity log (export via diagnostic setting at sub scope) | Resource-level setting |
| Host-level VM metrics (the platform’s view) | Diagnostic settings (platform metrics) | AMA |
Core concepts
Five mental models make every later step obvious.
A diagnostic setting is a per-resource tap, not a global switch. It lives on a specific resource (or on the subscription, for the activity log) and says: “take these log categories and these metric categories, and send them to these destinations.” It is identified by a name, and a single resource can carry up to five of them — typically you have one (everything to the workspace), but the limit exists so you can fan the same logs to multiple places (workspace for query, Event Hub for SIEM, Storage for cheap long-term archive) when one setting cannot reach all of them.
Resource logs and platform metrics are two separate pipelines sharing one setting. Inside a diagnostic setting you toggle log categories (the rich event streams, off by default and discarded if unrouted) independently from metrics (the numeric platform metrics, which do exist in the metrics store by default but which you route here to get them into the workspace for cross-resource KQL and long retention). You can route logs only, metrics only, or both. Conflating them is the first source of confusion: enabling “AllMetrics” does not give you the audit logs, and selecting log categories does not automatically include metrics.
Categories and category groups name what flows. Every resource type exposes a fixed set of log categories specific to it — Key Vault has AuditEvent and AzurePolicyEvaluationDetails; an NSG has NetworkSecurityGroupEvent and NetworkSecurityGroupRuleCounter; SQL DB has SQLSecurityAuditEvents, QueryStoreRuntimeStatistics, and more. Rather than list each, Azure offers category groups: allLogs (every category the resource supports, future-proof against new categories being added) and audit (the security/audit-relevant subset). audit is convenient for compliance but is empty for resources that expose no audit-classed category — a trap we cover later.
The destination decides queryability, cost and integration. The three first-party targets are not interchangeable. Log Analytics workspace makes data immediately queryable with KQL, joinable across resources, and alertable — the default for “I want to use this data” — but you pay per-GB ingestion. Storage account is the cheap archive: append blobs in a fixed JSON path layout, ideal for years-long retention to satisfy compliance, but not directly queryable (you read it back later). Event Hub is the streaming bridge: it forwards logs in near-real-time to a SIEM (Microsoft Sentinel via the workspace, or Splunk/Elastic/Datadog via the hub), at the cost of running and partitioning the hub. One setting can target one of each type simultaneously (one workspace + one storage + one event hub), but not two workspaces.
Workspace table mode changes how the data looks. When you send resource logs to a workspace, modern resource types write to a resource-specific (dedicated) table — e.g. Key Vault logs land in AZKVAuditLogs, NSG flow in AZFWNetworkRule-style dedicated tables — with typed columns. Older configurations and some types use the legacy Azure diagnostics mode, which dumps everything into the single AzureDiagnostics table with sparse, string-typed columns and a ResourceProvider/Category filter. Which mode you get affects your KQL, your column names, and your cost (dedicated tables are leaner). This is the single most common “my query returns nothing” cause: you queried the wrong table.
The vocabulary in one table
Pin down every moving part before the deep sections; the glossary at the end repeats these for lookup:
| Concept | One-line definition | Where it lives | Why it matters |
|---|---|---|---|
| Diagnostic setting | Per-resource rule routing logs/metrics to destinations | On the resource | The whole subject; max 5 per resource |
| Resource log | A service-specific event stream (audit, access, errors) | Emitted by the resource | Off + discarded until routed |
| Platform metric | Numeric health metric (CPU, requests, RU/s) | Metrics store (93 days) | Routed here for long-term KQL |
| Log category | A named stream within a resource’s logs | The setting | What you select to capture |
| Category group | allLogs / audit — a bundle of categories |
The setting | Future-proof / compliance subset |
| Workspace destination | Log Analytics target — queryable with KQL | A workspace | Default for using the data |
| Storage destination | A Storage account — cheap blob archive | A storage account | Cheap, long retention, not queryable |
| Event Hub destination | A streaming hub — forwards to SIEM | An Event Hubs namespace | Near-real-time to a SIEM |
| Resource-specific table | Dedicated typed table (e.g. AZKVAuditLogs) |
The workspace | Leaner, easier KQL |
AzureDiagnostics |
Legacy single table for all diagnostic logs | The workspace | String-typed; the “nothing found” trap |
| Activity log | Subscription-level control-plane audit | Subscription | Routed via a sub-scope setting |
What a diagnostic setting actually captures (and what it doesn’t)
The boundary of a diagnostic setting is the single most misunderstood thing in Azure observability. Get it wrong and you wait days for logs that will never arrive because a different mechanism owns them.
In scope: resource logs and platform metrics
A diagnostic setting captures exactly two things from the resource it is attached to:
- Resource logs — the rich, service-defined event streams. These are the audit trails, access logs, rule evaluations, request logs, and error streams the service emits about itself. They are off and discarded until a setting routes them.
- Platform metrics — the numeric time-series the platform already collects (and keeps for ~93 days in the metrics store). Routing them via the setting copies them into your chosen destination for long-term retention and cross-resource KQL.
Out of scope: four things people expect but don’t get
| Telemetry you might expect | Why a diagnostic setting does NOT capture it | What does |
|---|---|---|
| Guest-OS metrics (in-VM CPU, free disk, process list) | The setting sees the host/resource, not inside the OS | Azure Monitor Agent + DCR |
| Guest-OS logs (Windows Event Log, syslog, app log files) | Same — needs an agent inside the OS | Azure Monitor Agent + DCR |
| Application telemetry (requests, dependencies, traces, custom events) | That is code-level instrumentation | Application Insights SDK / auto-instrumentation |
| Activity log at resource scope | The activity log is a subscription-level stream | A diagnostic setting at subscription scope |
The practical rule: if the data describes something the Azure resource did or measured, a diagnostic setting captures it. If the data describes something happening inside a VM you operate, or inside your application code, it does not — a different agent or SDK does. The companion troubleshooting guide No Data in Log Analytics: Ingestion Troubleshooting is the place to go when this boundary confusion has you chasing logs that were never going to land here.
Logs vs metrics — independent toggles
Within one setting, logs and metrics are selected separately. The toggles and their defaults:
| Toggle | What it routes | Default state | Already exists without it? | Common mistake |
|---|---|---|---|---|
| Log categories (individual) | One named log stream each | Off | No — discarded | Expecting metrics from these |
allLogs category group |
Every log category (incl. future ones) | Off | No | Forgetting it auto-includes new categories |
audit category group |
The audit-classed subset | Off | No | It’s empty for non-audit resources |
| AllMetrics | All platform metrics for the resource | Off | Yes, in metrics store (93 d) | Expecting it to bring logs |
The three destinations, compared
Choosing the destination is the most consequential decision in the whole setup because it determines what you can do with the data and what it costs. A setting can write to one of each type at once.
Log Analytics workspace — the queryable default
Send logs here when you want to use them: run KQL, join across resources, build alerts, feed Sentinel, or render dashboards. Data is queryable within minutes, retained per the workspace/table retention policy (default 30 days on the workspace, extendable per table up to years), and billed per GB ingested plus retention beyond the free period. This is the right default for security, operations and troubleshooting.
Storage account — the cheap archive
Send logs here for long-term, low-cost retention you rarely query — multi-year compliance archives, raw immutable copies. Logs land as append blobs under a deterministic path (insights-logs-<category>/resourceId=.../y=/m=/d=/h=/m=/PT1H.json), one JSON-lines blob per hour. It is the cheapest GB and supports lifecycle tiering to cool/cold/archive, but the data is not directly queryable — you retrieve and parse it later. For tiering economics, see Blob Access Tiers: Hot, Cool, Cold & Archive Cost Model.
Event Hub — the streaming bridge to a SIEM
Send logs here to stream them out in near-real-time — to a non-Azure SIEM (Splunk, Elastic, Datadog) or any consumer that reads Event Hubs. Each setting writes to one event hub; throughput is governed by the namespace’s throughput units and the hub’s partition count, so you size it like any streaming pipeline. The hub is a transport, not a store (retention is hours to a few days), so something must consume it. For the partitioning and consumer model, see Event Hubs: Partitions, Consumer Groups & Offsets Explained.
The decision side by side — read your row:
| Dimension | Log Analytics workspace | Storage account | Event Hub |
|---|---|---|---|
| Primary use | Query, alert, dashboard, Sentinel | Long-term cheap archive | Stream to external SIEM |
| Queryable directly? | Yes (KQL, minutes) | No (retrieve + parse later) | No (transport; consumer queries) |
| Retention model | Per-table policy (30 d default → years) | Until you delete / lifecycle-tier | Hours–days (transport buffer) |
| Cost driver | Per-GB ingestion + retention | Per-GB stored (cheapest) + tiering | Throughput units + per-event |
| Latency to availability | Minutes | Minutes (hourly blobs) | Seconds (streaming) |
| Cross-resource correlation | Native (KQL joins) | Manual | At the consumer |
| Typical owner | SecOps / Platform / SRE | Compliance / Audit | Data / SOC integration |
| Can one setting use it with others? | Yes (1 workspace) | Yes (1 storage) | Yes (1 event hub) |
A common production pattern uses all three at once in a single setting: workspace for live query and Sentinel, Storage for the seven-year compliance archive, Event Hub for the existing Splunk pipeline — one setting, three destinations, no duplication of category selection.
Destination rules and limits you must respect
| Rule | The limit | Why it exists | What happens if you ignore it |
|---|---|---|---|
| Settings per resource | 5 maximum | Bounds fan-out | The 6th create fails |
| Workspaces per setting | 1 | One KQL target per rule | Need a 2nd workspace → 2nd setting |
| Storage accounts per setting | 1 | One archive target per rule | Same — add another setting |
| Event hubs per setting | 1 | One stream per rule | Same |
| Destination must exist first | Pre-create the target | The setting only references it | create fails: target not found |
| Workspace region | Can differ from resource (egress applies) | Flexibility | Cross-region data egress cost |
| Storage account type | General-purpose v2 (no premium/classic) | Append-blob support | create rejects the target |
Categories and category groups, decoded
Every resource type publishes its own list of log categories. You never have to memorise them — you list them. But you must understand the two category groups because they change behaviour over time.
allLogs vs audit vs explicit categories
allLogs— selects every log category the resource currently supports and any added in the future. This is the future-proof choice: when Azure adds a new log category to a service next year, anallLogssetting captures it automatically without you editing the setting. The trade-off is you may ingest (and pay for) categories you do not need.audit— selects the subset of categories Microsoft has classified as security/audit-relevant. Ideal for compliance baselines where you want the access/audit trail but not verbose operational logs. The trap: for resource types that expose no audit-classed category, anauditsetting captures nothing — it is valid but empty, and you discover the gap only when you go looking for logs. Always confirm the resource actually has anauditgroup before relying on it.- Explicit categories — pick individual categories by name (e.g. only
AuditEventon a Key Vault). The most cost-controlled choice: you ingest exactly what you need. The downside is it is not future-proof — a new category will not be captured unless you add it.
How to reason about the choice:
| Approach | Captures | Future-proof? | Cost control | Best for |
|---|---|---|---|---|
allLogs |
Every category, now and future | Yes | Lowest (may over-ingest) | “Capture everything”, security baseline |
audit |
Audit-classed subset only | Yes (within audit class) | Good | Compliance audit trails |
| Explicit list | Exactly the named categories | No | Highest | Cost-sensitive, known-need scenarios |
Listing what a resource supports
Never guess the categories — ask the API. For any resource, list its available log and metric categories:
# What can THIS resource emit? (replace with your resource ID)
RID=$(az keyvault show -n kv-obs-demo -g rg-diag-lab --query id -o tsv)

az monitor diagnostic-settings categories list --resource "$RID" \
  --query "value[].{name:name, type:categoryType, group:categoryGroups}" -o table
The categoryType column tells you Logs vs Metrics; the categoryGroups column shows whether a category belongs to allLogs, audit, or both. A representative sample for common resources (always confirm with the command above — categories evolve):
| Resource type | Notable log categories | Has audit group? |
Notable metrics |
|---|---|---|---|
| Key Vault | AuditEvent, AzurePolicyEvaluationDetails |
Yes (AuditEvent) |
ServiceApiHit, ServiceApiLatency |
| Network Security Group | NetworkSecurityGroupEvent, NetworkSecurityGroupRuleCounter |
No (use allLogs) |
(NSG metrics limited) |
| SQL Database | SQLSecurityAuditEvents, QueryStoreRuntimeStatistics, Errors, Deadlocks |
Yes (audit events) | cpu_percent, dtu_consumption_percent |
| Application Gateway | ApplicationGatewayAccessLog, ApplicationGatewayFirewallLog, ApplicationGatewayPerformanceLog |
No | Throughput, UnhealthyHostCount |
| Storage account (blob/sub-resource) | StorageRead, StorageWrite, StorageDelete |
Yes | Transactions, Ingress, Egress |
| App Service | AppServiceHTTPLogs, AppServiceConsoleLogs, AppServiceAuditLogs |
Yes | Http5xx, MemoryWorkingSet |
| Cosmos DB | DataPlaneRequests, QueryRuntimeStatistics, ControlPlaneRequests |
No | TotalRequestUnits, ProvisionedThroughput |
Workspace table modes: resource-specific vs Azure diagnostics
When the destination is a Log Analytics workspace, the shape of the data depends on the collection mode — and this is where most “I see no rows” tickets actually live.
Two modes, very different tables
- Resource-specific (dedicated) tables — modern, preferred. Each log category lands in its own typed table with proper columns. Key Vault audits go to
AZKVAuditLogs; Application Gateway access logs toAGWAccessLogs; many newer services default here. KQL is clean (AZKVAuditLogs | where ...), columns are typed, and ingestion is leaner (cheaper) because there is no giant sparse schema. - Azure diagnostics (legacy) mode — everything from every resource piles into the single
AzureDiagnosticstable, with hundreds of mostly-empty string columns and aResourceProvider+Categoryto filter by. Older resources and older settings use this; some resource types only support it.
The mode is chosen when you create the setting (the portal exposes a Destination table: Resource specific / Azure diagnostics radio when the resource supports both). If you query the wrong table, you get nothing even though the data is arriving correctly.
| Aspect | Resource-specific | Azure diagnostics (legacy) |
|---|---|---|
| Table layout | One dedicated table per category | Single AzureDiagnostics table |
| Column typing | Typed, per-service columns | Mostly string, _s/_d suffixes |
| Example query | AZKVAuditLogs | take 10 |
AzureDiagnostics | where ResourceProvider == "MICROSOFT.KEYVAULT" |
| Cost | Leaner (no sparse schema) | Heavier (wide sparse rows) |
| Support | Newer/most services | Older services / legacy settings |
| Recommendation | Prefer this when offered | Only when the resource lacks dedicated tables |
The fastest way to find where your data actually landed is to ask the workspace which tables received rows recently:
// Which tables got data in the last hour? Find your logs even if you didn't expect the table.
search *
| where TimeGenerated > ago(1h)
| summarize Rows = count() by $table
| order by Rows desc
Architecture at a glance
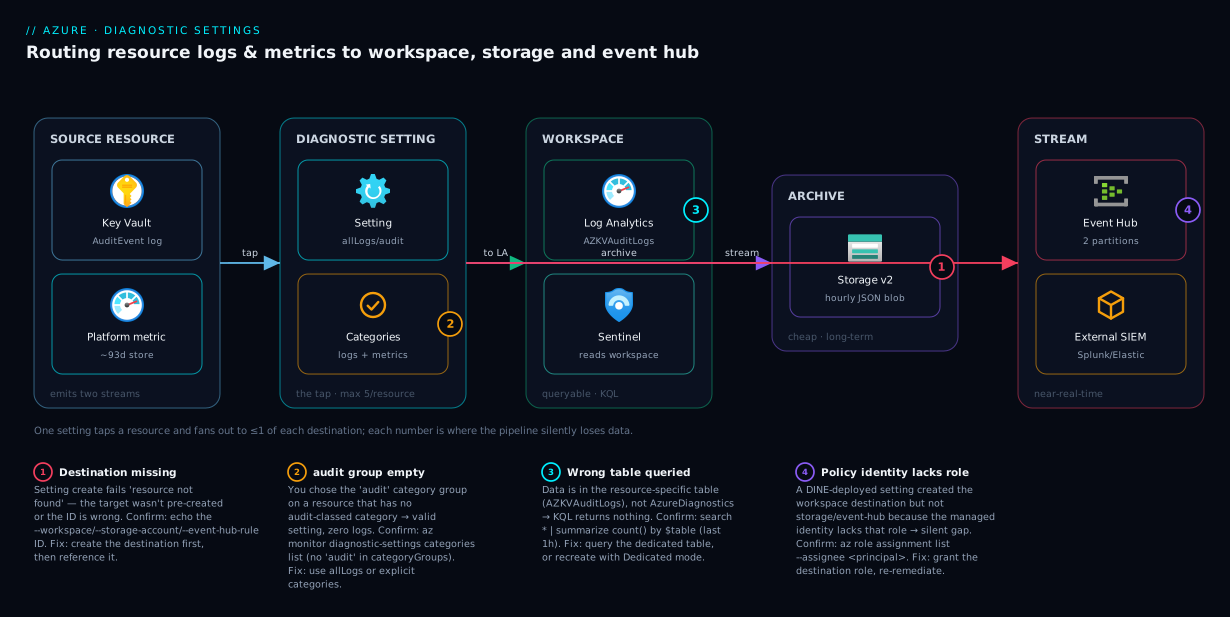
The diagram below traces a single resource’s telemetry from generation to its three possible destinations, and marks the points where the pipeline silently fails. Read it left to right. On the far left, an Azure resource — here a Key Vault, but the model is identical for an NSG, a SQL DB, or an App Gateway — continuously emits two distinct streams: resource logs (the AuditEvent access trail) and platform metrics (ServiceApiLatency and friends). Neither stream goes anywhere on its own. The diagnostic setting in the centre is the tap: it selects which log categories (allLogs / audit / explicit) and whether metrics flow, then fans the selected data out to up to one of each destination type.
From the tap, three paths diverge. The top path lands in a Log Analytics workspace, where modern resources write to a resource-specific table (AZKVAuditLogs) you query with KQL within minutes — this is also the path Microsoft Sentinel reads. The middle path drops hourly JSON blobs into a Storage account for cheap multi-year retention, tierable down to archive. The bottom path streams events through an Event Hub to an external SIEM in near-real-time. The numbered badges mark the four places this commonly breaks: a destination that does not exist yet (the create fails), an audit group that is empty for this resource type (valid setting, zero logs), querying AzureDiagnostics when the data went to a dedicated table (rows exist, wrong table), and a Policy-deployed setting whose managed identity lacks rights on the destination (silent no-op until remediated).
Real-world scenario
Meridian Health Analytics runs a regulated patient-data platform on Azure: a fleet of App Services fronting a set of Azure SQL databases, all secrets in a central Key Vault, all ingress through an Application Gateway with WAF. Their compliance framework requires a seven-year immutable audit trail of every secret access and every database security event, 90 days of hot-queryable logs for the SOC, and a live feed into the corporate Splunk that the parent company’s security team mandates. For the first year of the platform they had none of this — diagnostic settings had never been configured, because the original build script created resources but never tapped their logs.
The gap surfaced during a routine audit: the auditor asked for the access log of a specific Key Vault secret over the prior quarter, and the team discovered there was nothing to show. The platform had been generating AuditEvent logs the entire time; they had simply been discarded. There was no way to reconstruct the past quarter — that data was gone forever. This is the defining property of diagnostic settings that makes them urgent rather than optional: you cannot backfill.
The remediation, led by the platform team, became a textbook diagnostic-settings rollout. They designed one diagnostic setting per resource with three destinations: the SOC’s Log Analytics workspace (resource-specific tables, 90-day retention) for live query and Sentinel; a Storage account with a lifecycle policy tiering blobs to archive after 90 days and an immutability policy for the seven-year hold; and an Event Hub namespace feeding the Splunk forwarder. For Key Vault and SQL they used the audit category group (exactly the security events compliance cared about); for the Application Gateway, which has no audit group, they used allLogs to capture the WAF firewall log and access log. They did not hand-configure 200 resources — they wrote an Azure Policy DeployIfNotExists initiative, one policy per resource type, assigned at the subscription scope, with a user-assigned managed identity granted Log Analytics Contributor on the workspace and Contributor on the storage and event-hub resources, then ran a remediation task to backfill every existing resource.
Two things went wrong, both instructive. First, the initial Policy assignment’s managed identity had rights on the workspace but not on the Event Hub namespace, so the deployed settings silently created without the event-hub destination — the Splunk feed stayed empty for two days until they noticed and granted the role. Second, the SOC’s first KQL queries returned nothing because they queried AzureDiagnostics; the data was in the resource-specific AZKVAuditLogs and SQLSecurityAuditEvents dedicated tables. Once both were fixed, the platform had complete coverage that stayed complete — every new database, vault and gateway thereafter was configured automatically at creation time by Policy. Their monthly ingestion cost settled around ₹28,000 for the workspace plus a few hundred rupees for the cheap archive storage — a fraction of what a single failed audit would have cost. The lesson the team repeats to every new hire: diagnostic settings are not a day-two nicety; they are day-zero plumbing, and the only safe default is “configured, by Policy, before the resource takes traffic.”
Advantages and disadvantages
The honest trade-off of routing every resource’s logs through diagnostic settings:
| Advantages | Disadvantages |
|---|---|
| Durable, centralised audit trail you can query/alert on | You pay per-GB ingestion (workspace) — verbose logs add up fast |
| One mechanism for almost every Azure resource type | Cannot backfill — value only from the moment it’s enabled |
| Three destinations cover query, archive and streaming | Five-setting and one-target-per-type limits force fan-out planning |
Future-proof with allLogs (auto-captures new categories) |
allLogs can over-ingest categories you never query |
| Deployable and enforceable at scale via Azure Policy | Policy path needs a correctly-permissioned managed identity (a common foot-gun) |
| Resource-specific tables give clean, typed, cheaper KQL | Table-mode confusion (AzureDiagnostics vs dedicated) hides data |
| No agent to install for resource/platform logs | Does not cover guest-OS or app telemetry (separate pipelines) |
Where each matters: the per-GB cost dominates for chatty resources (Application Gateway access logs, SQL query-store stats, storage data-plane logs can be enormous) — there, explicit categories and a Storage-only archive beat allLogs to a workspace. The no-backfill property makes coverage the priority over perfection: a basic setting on every resource today is worth far more than a perfect setting on a few. The Policy path’s managed-identity requirement is the single most common operational failure and the reason to test remediation on one resource before assigning at scale.
Hands-on lab
This is the centerpiece. You will create a Key Vault (a resource with a clear, easy-to-trigger audit log), create all three destination types, wire a single diagnostic setting that fans out to all three — first in the portal, then re-create it via az CLI, then as Bicep — trigger an audit event, validate the data lands in the workspace, peek at the storage archive, and tear everything down. It is free-tier-friendly: Key Vault standard, a workspace, a tiny storage account and a Basic Event Hub namespace cost a few rupees for the hour. Run in Cloud Shell (Bash).
Prerequisites for the lab
| Requirement | How to check | If missing |
|---|---|---|
az CLI logged in |
az account show -o table |
az login (or use Cloud Shell) |
| Contributor on a subscription/RG | az role assignment list --assignee <you> -o table |
Ask an owner |
| A region you can deploy in | az account list-locations -o table |
Pick centralindia |
Microsoft.Insights registered |
az provider show -n Microsoft.Insights --query registrationState -o tsv |
az provider register -n Microsoft.Insights |
Step 1 — Variables and resource group
RG=rg-diag-lab
LOC=centralindia
KV=kv-obs-$RANDOM            # globally-unique
WS=law-diag-lab
SA=sadiag$RANDOM            # 3-24 lowercase alnum, globally-unique
EHNS=ehns-diag-$RANDOM      # globally-unique
EH=eh-diag
az group create -n $RG -l $LOC -o table
Expected: a JSON/table row with "provisioningState": "Succeeded".
Step 2 — Create the Log Analytics workspace (destination 1)
az monitor log-analytics workspace create \
  -g $RG -n $WS -l $LOC -o table
WS_ID=$(az monitor log-analytics workspace show -g $RG -n $WS --query id -o tsv)
echo "Workspace: $WS_ID"
Expected: a workspace resource; WS_ID prints a full /subscriptions/.../workspaces/law-diag-lab ID. Provisioning takes ~30–60 s.
Step 3 — Create the Storage account (destination 2)
az storage account create \
  -g $RG -n $SA -l $LOC --sku Standard_LRS --kind StorageV2 -o table
SA_ID=$(az storage account show -g $RG -n $SA --query id -o tsv)
echo "Storage: $SA_ID"
Expected: a StorageV2 account (general-purpose v2 is required — diagnostic settings cannot target premium or classic storage).
Step 4 — Create the Event Hub namespace + hub (destination 3)
az eventhubs namespace create \
  -g $RG -n $EHNS -l $LOC --sku Basic -o table
az eventhubs eventhub create \
  -g $RG --namespace-name $EHNS -n $EH --partition-count 2 -o table
EHNS_ID=$(az eventhubs namespace show -g $RG -n $EHNS --query id -o tsv)
echo "Event Hub namespace: $EHNS_ID"
Expected: a Basic-SKU namespace and a hub with 2 partitions. (A diagnostic setting targets the namespace plus an optional authorization rule, and routes each log into a hub named after the category — or into your specified hub.)
Step 5 — Create the Key Vault (the resource we will tap)
az keyvault create -g $RG -n $KV -l $LOC --enable-rbac-authorization true -o table
KV_ID=$(az keyvault show -g $RG -n $KV --query id -o tsv)
echo "Key Vault: $KV_ID"
Expected: a standard Key Vault; KV_ID prints its resource ID. This is the resource whose AuditEvent log we will route and trigger.
Step 6 — Discover what categories the Key Vault supports
Before configuring, confirm the available categories and groups:
az monitor diagnostic-settings categories list --resource "$KV_ID" \
  --query "value[].{name:name, type:categoryType, groups:categoryGroups}" -o table
Expected: rows including AuditEvent (type Logs, in audit and allLogs groups) and AzurePolicyEvaluationDetails, plus an AllMetrics-style metric category. This proves Key Vault has an audit group — so audit will not be empty.
Step 7 (Portal) — Create the diagnostic setting in the portal
Do this once by hand to see every toggle, then we automate it.
- Azure portal → open the Key Vault
kv-obs-<n>. - Left menu → Monitoring → Diagnostic settings → + Add diagnostic setting.
- Diagnostic setting name:
kv-all-to-three. - Under Logs, tick the
auditcategory group (this selectsAuditEvent). Optionally tickallLogsinstead to future-proof. - Under Metrics, tick AllMetrics.
- Under Destination details, tick all three:
- Send to Log Analytics workspace → select
law-diag-lab. When the Destination table radio appears, choose Resource specific (lands inAZKVAuditLogs). - Archive to a storage account → select
sadiag<n>. - Stream to an event hub → namespace
ehns-diag-<n>, hubeh-diag, default policy.
- Send to Log Analytics workspace → select
- Save.
Expected: the setting appears in the list within a few seconds. The portal confirms with a toast. You have now tapped the vault to all three destinations in one setting.
Step 8 (CLI) — Re-create the same setting with az
Delete the portal one (so we don’t hit the 5-setting limit needlessly) and build it in CLI — this is the form you put in pipelines:
# Remove the portal-created setting first
az monitor diagnostic-settings delete --name kv-all-to-three --resource "$KV_ID"

# Create it via CLI: logs (audit group) + metrics, to all three destinations
az monitor diagnostic-settings create \
  --name kv-all-to-three \
  --resource "$KV_ID" \
  --workspace "$WS_ID" \
  --storage-account "$SA_ID" \
  --event-hub-rule "$EHNS_ID/authorizationrules/RootManageSharedAccessKey" \
  --logs    '[{"categoryGroup":"audit","enabled":true}]' \
  --metrics '[{"category":"AllMetrics","enabled":true}]' \
  -o table
Expected: a JSON/table object echoing the setting with workspaceId, storageAccountId, eventHubAuthorizationRuleId, and the enabled log group + metric category. If any destination ID is wrong or the target doesn’t exist, the command fails here with a clear “resource not found” — that is the create-time validation working for you.
Confirm it stuck:
az monitor diagnostic-settings list --resource "$KV_ID" \
  --query "[].{name:name, ws:workspaceId, sa:storageAccountId, eh:eventHubAuthorizationRuleId}" -o table
Step 9 — Trigger an audit event
Make the vault do something auditable. Set a secret and read it back:
# Grant yourself data-plane rights (RBAC vault), then exercise it
ME=$(az ad signed-in-user show --query id -o tsv)
az role assignment create --assignee "$ME" \
  --role "Key Vault Secrets Officer" --scope "$KV_ID"

az keyvault secret set    --vault-name $KV -n demo-secret --value "hello-diag" -o none
az keyvault secret show   --vault-name $KV -n demo-secret --query value -o tsv
Expected: the secret is created and hello-diag prints back. Each of those data-plane calls generates an AuditEvent the diagnostic setting will route. (RBAC assignment can take a minute to propagate; if you get a 403, wait and retry.)
Step 10 — Validate the data landed in the workspace
Logs take 5–15 minutes to first appear (the very first write to a brand-new table is the slowest). Then query the resource-specific table:
# Query the dedicated Key Vault audit table for our SetSecret/GetSecret operations
az monitor log-analytics query \
  --workspace "$(az monitor log-analytics workspace show -g $RG -n $WS --query customerId -o tsv)" \
  --analytics-query 'AZKVAuditLogs | where TimeGenerated > ago(30m) | project TimeGenerated, OperationName, ResultType, CallerIPAddress | take 20' \
  -o table
Expected (after the delay): rows with OperationName like SecretSet/SecretGet. If empty, first confirm timing, then run the “which tables got data” search from the table-modes section — if rows are in AzureDiagnostics instead, your setting used legacy mode (recreate choosing resource-specific).
Step 11 — Peek at the storage archive
Confirm the blob path layout exists (blobs appear within ~hour granularity, so this may be empty immediately after the lab — the structure is the point):
az storage container list --account-name $SA --auth-mode login \
  --query "[].name" -o tsv
# Look for a container like: insights-logs-auditevent
Expected: once an hour’s worth of logs flush, a container named insights-logs-auditevent holds blobs under resourceId=.../y=YYYY/m=MM/d=DD/h=HH/m=00/PT1H.json.
Step 12 (Bicep) — The same setting as code
This is the form you commit. A diagnostic setting is an extension resource scoped to the target via the scope property:
@description('Resource ID of the Key Vault to tap')
param keyVaultName string

@description('Destination IDs (pre-created)')
param workspaceId string
param storageAccountId string
param eventHubAuthRuleId string

resource kv 'Microsoft.KeyVault/vaults@2023-07-01' existing = {
  name: keyVaultName
}

resource diag 'Microsoft.Insights/diagnosticSettings@2021-05-01-preview' = {
  name: 'kv-all-to-three'
  scope: kv                       // attaches the setting to the Key Vault
  properties: {
    workspaceId: workspaceId
    storageAccountId: storageAccountId
    eventHubAuthorizationRuleId: eventHubAuthRuleId
    logAnalyticsDestinationType: 'Dedicated'   // resource-specific tables
    logs: [
      {
        categoryGroup: 'audit'    // or 'allLogs' to future-proof
        enabled: true
      }
    ]
    metrics: [
      {
        category: 'AllMetrics'
        enabled: true
      }
    ]
  }
}
Deploy and validate:
az deployment group create -g $RG \
  --template-file diag.bicep \
  --parameters keyVaultName=$KV workspaceId="$WS_ID" \
               storageAccountId="$SA_ID" \
               eventHubAuthRuleId="$EHNS_ID/authorizationrules/RootManageSharedAccessKey" \
  -o table
Expected: provisioningState: Succeeded; az monitor diagnostic-settings list --resource "$KV_ID" shows the setting. Note logAnalyticsDestinationType: 'Dedicated' is the Bicep equivalent of the portal’s “Resource specific” radio — omit it (or set 'AzureDiagnostics') and you get the legacy table.
Step 13 — Teardown
az group delete -n $RG --yes --no-wait
Expected: deletion starts in the background, stopping all charges. (Key Vault may be soft-deleted; purge it if you reuse the name: az keyvault purge -n $KV.)
Validation checklist. You created three destination types, tapped a Key Vault with a single setting fanning out to all three (portal, then CLI, then Bicep), triggered real audit events, and confirmed they land in the dedicated AZKVAuditLogs table — and you saw the create-time validation reject bad destinations and learned why the resource-specific table mode matters. What each step proved:
| Step | What you did | What it proves |
|---|---|---|
| 6 | Listed categories | The categories/groups are discoverable, not guessable |
| 7–8 | Portal then CLI setting | The same fan-out, click-ops vs automatable |
| 9–10 | Trigger + KQL validate | Logs are real, land in the dedicated table, after a delay |
| 11 | Storage container | The archive path layout is deterministic |
| 12 | Bicep with Dedicated |
Table mode is a deliberate, code-controlled choice |
Deploying diagnostic settings at scale with Azure Policy
Clicking settings onto resources does not survive a growing estate — new resources arrive without logging, and you find out during an incident. The durable answer is Azure Policy with the DeployIfNotExists (DINE) effect: a policy that detects any resource of a given type lacking a diagnostic setting and deploys one automatically, plus a remediation task to backfill existing resources.
Why DINE, and what it needs
A DINE policy runs a small deployment when its condition is met (the setting is missing), so it needs an identity to deploy as — a managed identity (system- or user-assigned on the assignment) that must hold the rights to (a) create the diagnostic setting on the resource and (b) write to the destinations. This identity-and-permissions step is the number-one reason DINE policies silently no-op. The mechanics of remediation identities are covered in depth in Policy Remediation Tasks with Managed Identity, and the effect itself in Azure Policy Effects: Deny, Audit, Modify & DeployIfNotExists.
| DINE requirement | What to grant | Granted where | If missing |
|---|---|---|---|
| Create the diagnostic setting | Monitoring Contributor (or Contributor) |
At the assignment scope | Setting never deploys |
| Write to Log Analytics | Log Analytics Contributor |
On the workspace | Workspace destination dropped |
| Write to Storage | Contributor (or storage role) |
On the storage account | Storage destination dropped |
| Write to Event Hub | Contributor (or Azure Event Hubs Data Owner) |
On the namespace | Event-hub feed silently empty |
The pattern in practice
Azure ships built-in policies named like “Configure diagnostic settings for <resource type> to Log Analytics workspace” — assign the one for each resource type you care about (Key Vault, NSG, SQL, App Gateway, …), or group them into a policy initiative. Each takes the destination as a parameter. Assign at the subscription or management-group scope so coverage is automatic for everything beneath it.
# Assign a built-in "configure diagnostic settings to Log Analytics" policy
# (definition IDs differ per resource type — list them first)
az policy definition list \
  --query "[?contains(displayName,'diagnostic settings') && contains(displayName,'Log Analytics')].{name:displayName, id:name}" \
  -o table

# Assign one (example: a Key Vault diag-settings policy) with a system-assigned identity
az policy assignment create \
  --name diag-kv-to-law \
  --scope "/subscriptions/<sub-id>" \
  --policy "<policy-definition-id>" \
  --mi-system-assigned --location $LOC \
  --params '{ "logAnalytics": { "value": "'$WS_ID'" } }'
After assignment, grant the identity its roles (the CLI prints the principal ID), then create a remediation task to apply the setting to resources that already exist:
PRINCIPAL=$(az policy assignment show --name diag-kv-to-law --scope "/subscriptions/<sub-id>" --query identity.principalId -o tsv)
az role assignment create --assignee "$PRINCIPAL" --role "Log Analytics Contributor" --scope "$WS_ID"
az role assignment create --assignee "$PRINCIPAL" --role "Monitoring Contributor" --scope "/subscriptions/<sub-id>"

# Backfill existing resources
az policy remediation create --name remediate-diag-kv \
  --policy-assignment diag-kv-to-law --resource-group $RG
| Step | Click-ops outcome | Policy DINE outcome |
|---|---|---|
| New resource created | No logging until someone remembers | Setting auto-deployed within minutes |
| Existing resources | Hand-configure each | One remediation task backfills all |
| Drift (setting deleted) | Silent gap | Policy re-deploys on next evaluation |
| Audit “are we covered?” | Manual inventory | Policy compliance view shows it |
Common mistakes & troubleshooting
The failure modes, as a scannable table first, then the detail for the ones that bite hardest. The overwhelming majority of tickets are “I configured it and see no logs” — and the cause is almost always one of the first four.
| # | Symptom | Root cause | Confirm (exact cmd / portal path) | Fix |
|---|---|---|---|---|
| 1 | Setting saved, KQL returns nothing | Querying AzureDiagnostics, data is in a dedicated table |
search * | summarize count() by $table (last 1h) |
Query the resource-specific table; or recreate with Dedicated |
| 2 | audit group selected, zero logs ever |
This resource has no audit-classed category | az monitor diagnostic-settings categories list — no audit group |
Use allLogs or pick explicit categories |
| 3 | Expecting in-VM CPU/disk/event-log, nothing | Guest-OS telemetry isn’t captured by diag settings | You enabled a setting on the VM, not AMA/DCR | Deploy Azure Monitor Agent + DCR |
| 4 | No data, but it’s only been a few minutes | First write to a new table lags 5–15 min | Re-run the KQL after 15 min | Wait; confirm table via search * |
| 5 | create fails “resource not found” |
Destination doesn’t exist or wrong ID | Echo the --workspace/--storage-account IDs |
Pre-create the destination; fix the ID |
| 6 | The 6th setting won’t save | 5-setting-per-resource cap reached | az monitor diagnostic-settings list --resource $RID |
Consolidate destinations into one setting |
| 7 | Policy shows compliant, no setting deployed | DINE identity lacks rights on destination | az role assignment list --assignee <principal> |
Grant Log Analytics Contributor etc.; re-remediate |
| 8 | Event-hub feed empty, workspace fine | Identity missing Event Hub role | Setting lists eventHubAuthorizationRuleId but no events |
Grant Azure Event Hubs Data Owner on the namespace |
| 9 | Storage container never appears | Wrong storage kind, or no events yet (hourly) | az storage account show --query kind (must be StorageV2) |
Use general-purpose v2; wait an hour for the blob |
| 10 | Ingestion bill spiked after enabling allLogs |
A chatty category (App GW access, SQL query-store) | Workspace → Usage; Usage | summarize by DataType |
Switch to explicit categories; archive to Storage instead |
| 11 | Activity log not in the workspace | You set it on a resource, not the subscription | No AzureActivity table rows |
Create the setting at subscription scope |
| 12 | Logs stopped after a resource move/rename | Setting is tied to the resource ID; move broke it | diagnostic-settings list on the new ID is empty |
Re-create the setting on the moved resource |
The expanded reasoning for the four that consume the most time:
1. Setting saved, KQL returns nothing — you’re querying the wrong table.
Root cause: Modern resources write to resource-specific tables (AZKVAuditLogs, SQLSecurityAuditEvents, AGWFirewallLogs), not AzureDiagnostics. If you learned KQL on the legacy table, you query an empty AzureDiagnostics.
Confirm: search * | where TimeGenerated > ago(1h) | summarize count() by $table | order by count_ desc shows exactly which table received your rows.
Fix: Query the dedicated table. If you want the legacy table for a tool that expects it, recreate the setting with Azure diagnostics mode (logAnalyticsDestinationType: 'AzureDiagnostics'); otherwise prefer Dedicated.
2. The audit group is selected but no logs ever arrive.
Root cause: Not every resource exposes an audit-classed category. For a resource type with none (e.g. an NSG), an audit setting is valid but captures nothing — you created a tap on an empty pipe.
Confirm: az monitor diagnostic-settings categories list --resource "$RID" — if no category shows audit in its categoryGroups, the group is empty for this type.
Fix: Use allLogs (captures everything, including future categories) or select the explicit categories you need.
3. You enabled a setting on the VM and still can’t see what’s happening inside it.
Root cause: A diagnostic setting on a VM captures the platform’s view (host metrics, the VM resource’s own logs), not the guest OS. In-guest CPU/memory/disk, Windows Event Log and syslog need an agent inside the OS.
Confirm: You’re looking for tables like Perf, Event, Syslog — these come from the Azure Monitor Agent, not diagnostic settings.
Fix: Deploy the Azure Monitor Agent (AMA) and a Data Collection Rule (DCR). This is a different pipeline; see the data-platform overview for where each fits.
4. No data — but you’ve only waited a few minutes.
Root cause: End-to-end latency for the first write to a brand-new dedicated table is the slowest (table creation + ingestion). 5–15 minutes is normal; sometimes longer for the first event.
Confirm: Re-run the query after 15 minutes; use search * to see any arriving table, which tells you the pipe is flowing even if your specific table is empty.
Fix: Patience first, then troubleshoot only if it’s been >20 minutes and search * shows nothing from the resource at all.
Best practices
- Configure diagnostic settings on day zero, by Policy. The no-backfill rule makes coverage urgent. Assign DINE policies (or an initiative) at the management-group/subscription scope so every new resource is tapped at birth — never rely on someone remembering.
- Prefer
allLogsfor security/audit coverage, explicit categories for cost control. UseallLogswhere completeness matters and the volume is modest; switch to named categories for chatty resources (App Gateway access logs, SQL query-store, storage data-plane) whereallLogswould balloon the bill. - Choose the destination by intent. Workspace to use the data, Storage to retain it cheaply, Event Hub to stream it out. Use all three in one setting when you genuinely need all three — don’t create duplicate settings.
- Default to resource-specific (Dedicated) tables. Cleaner KQL, typed columns, lower cost. Only fall back to
AzureDiagnosticswhen a tool or query explicitly needs it or the resource lacks dedicated tables. - Verify
auditis non-empty before relying on it. List the categories first; for resources with no audit class,auditsilently captures nothing — useallLogsthere. - Export the activity log too. Create a subscription-scope diagnostic setting routing the activity log to the same workspace for a complete control-plane audit (
AzureActivitytable). - Pre-create destinations and reference by ID. The setting only references the target; create-time validation fails fast if the ID is wrong — treat that as a feature, not a bug.
- Grant the Policy identity all destination roles. Workspace, storage and event hub — the missing event-hub role is the classic silent gap. Test remediation on one resource before assigning at scale.
- Track coverage via Policy compliance. The compliance dashboard answers “is everything tapped?” far better than a manual inventory.
- Right-size retention per table. Keep hot, queryable retention short in the workspace (cost) and push long-term compliance copies to Storage with lifecycle tiering to archive.
- Set up the destinations’ own monitoring. A workspace daily-cap or an Event Hub at capacity will drop data; alert on workspace ingestion and hub throttling.
- Keep settings in source control as Bicep. A reviewed
Microsoft.Insights/diagnosticSettingsresource per service is auditable and reproducible; click-ops drifts.
Security notes
- Least privilege on the Policy identity. The DINE managed identity needs only the roles to create settings and write to destinations —
Monitoring Contributor+Log Analytics Contributor+ the storage/event-hub data roles, scoped tightly. Do not hand it Owner. The patterns are in Managed Identity: System vs User-Assigned. - Protect the logs as you protect the resource. Audit logs contain sensitive operational detail (caller IPs, secret names, query text). Lock down the workspace and storage with RBAC; restrict who can read
AZKVAuditLogsand the archive container. - Immutability for compliance archives. For regulatory holds, enable an immutability (WORM) policy on the Storage container so the audit archive cannot be altered or deleted before its retention expires — the audit trail is only as trustworthy as its tamper-resistance.
- Network-isolate destinations where required. Workspaces, storage and event hubs can sit behind private endpoints/firewalls; ensure the diagnostic-settings data path (a platform-internal flow) and your queriers still reach them.
- Secure the Event Hub bridge. The hub forwards potentially sensitive logs off-platform; use a scoped authorization rule (not
RootManageSharedAccessKeyin production), and secure the downstream SIEM ingestion. - Feed Sentinel for security analytics. Routing the right resource logs (Key Vault audit, NSG flow, sign-in-adjacent logs) into the workspace makes them available to Microsoft Sentinel and to Defender for Cloud — see Enable Defender for Cloud CSPM in Your First Week for the security-posture side.
- Don’t over-collect PII. Some logs contain personal data; route only what you need, and apply retention/deletion policies consistent with your data-protection obligations.
Cost & sizing
The bill comes from where the data lands, and it can surprise you:
- Log Analytics ingestion dominates. You pay per GB ingested (roughly ₹250–300/GB on pay-as-you-go in INR terms; commitment tiers cut it materially at volume), plus retention beyond the included period (typically 31 days free, then per-GB-month). A chatty Application Gateway or storage data-plane log can ingest gigabytes per day — this is where
allLogsto a workspace becomes expensive and explicit categories + a Storage archive win. - Storage is the cheap floor. Block-blob storage is a few rupees per GB-month and far less in cool/cold/archive tiers — the right home for multi-year compliance copies you rarely read. Lifecycle policies tier it down automatically.
- Event Hub is throughput-priced. You pay for throughput units (Basic/Standard) plus ingress events. Size partitions and TUs to peak log volume; an under-provisioned namespace throttles and drops.
- The free/low-cost path for learning: a workspace’s first 31 days of retention are free, the lab’s volumes are negligible, and deleting the resource group stops everything. There is no charge for the diagnostic setting itself — only for the data it moves and stores.
A rough monthly picture for a mid-size estate (≈150 resources, security-relevant logs to a workspace + archive):
| Cost driver | What you pay for | Rough INR / month | How to control it |
|---|---|---|---|
| Workspace ingestion | Per-GB resource logs (audit-scoped) | ~₹20,000–40,000 | Explicit categories; commitment tier |
| Workspace retention | Beyond 31 days, per-GB-month | ~₹2,000–6,000 | Short hot retention; archive the rest |
| Storage archive | Cheap blobs (cool/archive) | ~₹300–1,500 | Lifecycle tiering to archive |
| Event Hub namespace | TUs + ingress (if used) | ~₹2,000–6,000 | Right-size TUs; Basic if low volume |
| Diagnostic setting | Nothing | ₹0 | — (only the data costs) |
The cost lever that matters most: collect by intent, not by reflex. allLogs to a workspace for everything is the default that quietly produces a five-figure surprise; the disciplined pattern is audit-scoped categories to the workspace for what you query, and a Storage archive for the bulk you must keep but rarely read. For analysing where the spend goes, Cost Management Exports to Storage & Power BI and the workspace Usage table are your friends.
Interview & exam questions
1. A teammate says “Azure logs everything automatically.” Where are they wrong? Platform metrics and the activity log are retained by default (rolling windows), but resource logs — the rich per-service audit/access/error streams — are discarded until a diagnostic setting routes them. No setting, no resource logs, and you cannot backfill. Diagnostic settings are the explicit tap that turns those streams on.
2. What are the three first-party destinations for a diagnostic setting and when do you pick each? Log Analytics workspace (queryable with KQL, alertable, feeds Sentinel — pick it to use the data), Storage account (cheap blob archive, not directly queryable — pick it for long-term/compliance retention), and Event Hub (near-real-time streaming — pick it to forward to an external SIEM). One setting can write to one of each simultaneously.
3. What’s the difference between the allLogs and audit category groups? allLogs selects every log category the resource supports, including ones Azure adds in the future (future-proof). audit selects only the security/audit-classed subset. The catch: for a resource type with no audit-classed category, an audit setting captures nothing — confirm the resource has an audit group before relying on it.
4. You enabled a diagnostic setting and your KQL returns nothing. What’s the most likely cause? You’re querying the wrong table. Modern resources write to resource-specific (dedicated) tables (e.g. AZKVAuditLogs), not the legacy AzureDiagnostics. Run search * | summarize count() by $table over the last hour to find where the rows actually landed, then query that table.
5. Does a diagnostic setting on a VM capture in-guest CPU, disk and the Windows Event Log? No. A diagnostic setting captures the platform/resource view (host metrics, the VM resource’s own logs). Guest-OS metrics and logs require the Azure Monitor Agent (AMA) plus a Data Collection Rule (DCR) — a separate pipeline. Confusing the two is a classic “where are my logs” mistake.
6. How many diagnostic settings can a single resource have, and why would you need more than one? A maximum of five. You add more than one when a single setting can’t reach all the destinations you need — though note one setting already supports one workspace + one storage + one event hub, so you mostly need extra settings only to reach a second workspace or a second account of the same type.
7. How do you ensure every new resource of a type gets a diagnostic setting without manual effort? Use Azure Policy with the DeployIfNotExists effect (built-in “Configure diagnostic settings…” policies, ideally grouped in an initiative) assigned at subscription/management-group scope, plus a remediation task to backfill existing resources. The policy’s managed identity must hold rights on every destination, or settings deploy without them.
8. A Policy-deployed setting shows compliant but the Event Hub feed is empty while the workspace works. Why? The DINE policy’s managed identity lacks the role on the Event Hub namespace (it has the workspace role but not the event-hub one), so the deployment created the setting with the workspace destination but couldn’t attach the event hub. Grant the identity an Event Hubs data role on the namespace and re-remediate.
9. What is the difference between resource-specific and Azure-diagnostics table modes, and which should you choose? Resource-specific (Dedicated) writes each category to its own typed table — cleaner KQL, typed columns, lower cost. Azure diagnostics (legacy) dumps everything into the single, sparse, string-typed AzureDiagnostics table. Choose Dedicated unless a tool requires the legacy table or the resource only supports legacy.
10. Where do you configure the export of the activity log, and which table does it land in? Not on a resource — at the subscription scope (Monitor → Activity log → Export, or a diagnostic setting on the subscription). Routed to a workspace it lands in the AzureActivity table, giving you a queryable control-plane audit of who created/changed/deleted resources.
11. Why is “collect everything with allLogs to a workspace” a cost risk, and what’s the disciplined alternative? Some categories (App Gateway access logs, SQL query-store stats, storage data-plane) ingest gigabytes per day at per-GB workspace pricing, producing a five-figure surprise. The disciplined pattern: audit-scoped/explicit categories to the workspace for what you actively query, and a Storage archive for the bulk you must keep but rarely read.
12. Can you recover resource logs from before you enabled the diagnostic setting? No — and this is the defining property. Resource logs are generated and discarded until a setting routes them; there is no retroactive capture. This is why coverage must be configured before an incident, ideally by Policy at resource-creation time.
These map to AZ-104 (Administrator) — monitor and maintain Azure resources, configure diagnostic settings and Log Analytics — and AZ-500 (Security Engineer) — configure and manage security monitoring, route logs for Defender/Sentinel. The Policy-at-scale angle touches AZ-305 governance design. A compact cert map:
| Question theme | Primary cert | Objective area |
|---|---|---|
| Diagnostic settings, destinations, table modes | AZ-104 | Monitor & maintain Azure resources |
| Routing logs for security analytics / Sentinel | AZ-500 | Configure & manage security monitoring |
| DINE policy + remediation for diag settings | AZ-104 / AZ-305 | Governance; design monitoring |
| Activity log export, control-plane audit | AZ-104 | Configure monitoring |
| Cost-aware log collection | AZ-104 / AZ-305 | Optimise & govern monitoring |
Quick check
- You stand up a new NSG and expect to see flow events in Log Analytics, but the table is empty. What single thing did you most likely forget, and can you recover the events from before you fix it?
- Name the three first-party diagnostic-setting destinations and, in one phrase each, what you’d use them for.
- You select the
auditcategory group on a resource and never see a single log. Give the two-step way to find out whether that’s expected. - Your KQL
AzureDiagnostics | where ResourceProvider == "MICROSOFT.KEYVAULT"returns nothing, but you’re sure the setting is working. What’s wrong and how do you confirm where the data is? - A
DeployIfNotExistspolicy reports the resource as compliant, yet the storage archive destination is missing from the deployed setting. What’s the most likely cause?
Answers
- You forgot to create a diagnostic setting on the NSG — resource logs (here
NetworkSecurityGroupEvent/flow) are discarded until routed. And no, you cannot recover events from before the setting existed; there is no backfill. - Log Analytics workspace — to query/alert on the data with KQL (and feed Sentinel); Storage account — cheap long-term/compliance archive; Event Hub — near-real-time streaming to an external SIEM.
- Run
az monitor diagnostic-settings categories list --resource "$RID"and check whether any category listsauditin itscategoryGroups. If none does, the resource has no audit-classed category, so anauditsetting is correctly empty — switch toallLogsor explicit categories. - The data is in a resource-specific (dedicated) table (
AZKVAuditLogs), not the legacyAzureDiagnostics. Confirm withsearch * | where TimeGenerated > ago(1h) | summarize count() by $table | order by count_ descto see exactly which table received rows, then query that one. - The policy’s managed identity lacks the role on the storage account (it could create the setting and write to the workspace, but not attach the storage destination). Grant the identity a
Contributor/storage role on the account and re-run the remediation task.
Glossary
- Diagnostic setting — a per-resource (or per-subscription, for the activity log) configuration that routes resource logs and platform metrics to one or more destinations; max 5 per resource.
- Resource log — a service-specific event stream (audit, access, error, request) emitted by a resource; off and discarded until a diagnostic setting routes it.
- Platform metric — a numeric time-series the platform collects by default (retained ~93 days in the metrics store); routed via a setting for long-term retention and cross-resource KQL.
- Log category — a named stream within a resource’s logs (e.g.
AuditEvent,NetworkSecurityGroupEvent). - Category group — a bundle of categories:
allLogs(all current and future categories) oraudit(the security/audit-classed subset). - Log Analytics workspace — the queryable destination; data is available to KQL, alerts, dashboards and Sentinel; billed per-GB ingested.
- Storage account destination — a general-purpose v2 account receiving hourly JSON blobs; cheap long-term archive, not directly queryable.
- Event Hub destination — an Event Hubs namespace receiving a near-real-time stream; the bridge to external SIEMs.
- Resource-specific (Dedicated) table — a typed, per-category workspace table (e.g.
AZKVAuditLogs); the preferred mode (cleaner KQL, lower cost). AzureDiagnostics— the legacy single table that holds all diagnostic logs with sparse string columns; the “nothing found” trap when you query it instead of the dedicated table.- Activity log — the subscription-level control-plane audit (who created/changed/deleted resources); exported via a subscription-scope setting to the
AzureActivitytable. - Azure Monitor Agent (AMA) / Data Collection Rule (DCR) — the separate pipeline that collects guest-OS telemetry from inside a VM; not captured by diagnostic settings.
DeployIfNotExists(DINE) — an Azure Policy effect that auto-deploys a diagnostic setting where one is missing; needs a correctly-permissioned managed identity.- Remediation task — the Policy operation that applies a DINE policy to existing resources (backfill).
logAnalyticsDestinationType— the property/setting choosingDedicated(resource-specific tables) vsAzureDiagnostics(legacy table) when both are supported.
Next steps
You can now route any resource’s logs and metrics to the right destination, validate they land, and enforce it at scale. Build outward:
- Next: Azure Monitor Data Platform: Metrics, Logs & Traces Explained — the full model your diagnostic-settings data flows into.
- Prerequisite/companion: Create & Design a Log Analytics Workspace with RBAC — the destination you route most logs to, done right.
- When logs don’t show up: No Data in Log Analytics: Ingestion Troubleshooting — the deeper playbook beyond this article’s table.
- At scale: Azure Policy Effects: Deny, Audit, Modify & DeployIfNotExists and Policy Remediation Tasks with Managed Identity — make every resource self-configure.
- Act on the data: Metric Alerts with Action Groups: Email & SMS — turn routed telemetry into notifications.
- Stream it out: Event Hubs: Partitions, Consumer Groups & Offsets Explained — size the SIEM bridge correctly.