At 13:02 on the first day of a sale, the checkout API starts throwing ERROR 1040 (HY000): Too many connections on MySQL — or FATAL: sorry, too many clients already on PostgreSQL. The database CPU sits at 22%. Memory is fine. IOPS are nowhere near the cap. Nothing about the server looks unhealthy, yet every new request to open a connection is refused, and the on-call instinct — scale up the SKU — does nothing, because compute was never the constraint. This is a connection storm: your application layer opened more concurrent connections than the engine is allowed to accept, and the ceiling it hit is max_connections — a number that, on Azure Database for MySQL Flexible Server and Azure Database for PostgreSQL Flexible Server, is derived from the memory of the SKU you chose, not from how busy the box is.
This is the diagnostic playbook for that failure. We treat “too many connections” not as one bug but as a family of root causes — a serverless front end that fans out to hundreds of instances, a driver pool multiplied by instance count, idle connections that never get returned, and on PostgreSQL the choice to connect on the raw engine port instead of through the built-in PgBouncer pooler. Each has a precise way to confirm it (an exact az command, a SHOW PROCESSLIST / pg_stat_activity query, an Azure metric) and a precise fix. Because PostgreSQL forks a heavyweight backend process per connection while MySQL spins a thread per connection, the mechanism differs between the two engines and the right fix differs with it — which is why this article keeps both side by side and tells you which lever pulls on which engine.
By the end you will stop guessing. When the pager goes off you will know whether you face a max_connections ceiling set by a too-small SKU, an application pool that multiplies out of control, idle-in-transaction connections holding slots hostage, a pooler you forgot to turn on, or genuine load — and you will know which of those a bigger SKU actually fixes (one) and which it merely hides (the rest). Knowing which within ninety seconds is what separates a five-minute incident from a two-hour one.
What problem this solves
A managed database hands you a connection string and the comfortable illusion of an infinite endpoint. That illusion holds until concurrency climbs, and then the endpoint reveals a hard ceiling unrelated to query throughput. Both Flexible Server engines run on a single VM you sized, and each accepted connection costs real RAM on it — a PostgreSQL backend is a forked process of several MB; a MySQL connection is a thread plus its buffers. To stop a storm from eating all the memory and crashing the engine, the platform caps simultaneous connections at max_connections, a cap that scales with the SKU’s memory. Hit it and the engine does the safe thing: it refuses new connections rather than dying. From the application side that refusal looks like a total outage even though the database is healthy.
What breaks without this knowledge is predictable and expensive. The on-call engineer scales the SKU up one notch, the storm pauses for an hour while the slightly higher max_connections absorbs it, then it returns worse at the next peak — and now the bill is higher for no structural gain. Or someone raises max_connections by hand past what the RAM can support, the engine starts OOM-killing backends, and a clean “connection refused” becomes random query failures and a far harder incident. Or, on PostgreSQL, the team never enables the built-in PgBouncer and connects thousands of short-lived serverless connections straight to port 5432, exhausting the engine while a pooler that ships in the box sits unused.
Who hits this: any team with a high-fan-out front end on a relational database. It bites hardest on serverless and event-driven workloads — Azure Functions and Container Apps that scale to hundreds of instances, each opening its own pool — on microservices where every service holds a pool to the same database, and on apps with a misconfigured pool (too large, never released, leaked through unclosed connections). The fix is almost never “scale up.” It is “pool connections correctly, put a transaction pooler in front, and size the pool to the backends the SKU can actually afford.”
To frame the whole field before the deep dive, here is the difference that drives every later decision — how each engine spends a connection, and therefore why the same symptom needs a different fix:
| Engine | One connection costs | Default pooler | Engine port | Pooler port | Error when exhausted |
|---|---|---|---|---|---|
| MySQL Flexible Server | A thread + per-thread buffers (lighter, but still capped) | None built in (use driver pool / external proxy) | 3306 | n/a (no in-box pooler) | ERROR 1040 (HY000): Too many connections |
| PostgreSQL Flexible Server | A forked backend process (several MB each, heavier) | Built-in PgBouncer (transaction mode) | 5432 | 6432 | FATAL: sorry, too many clients already |
Learning objectives
By the end of this article you can:
- Explain why
max_connectionson both Flexible Server engines is derived from the SKU’s memory, and find the effective value for any tier with one query. - Diagnose a connection storm as one of: a too-small SKU ceiling, an oversized or leaked application pool, idle/idle-in-transaction connections, a missing pooler, fan-out from serverless instances, or genuine load — and confirm which with exact commands.
- Stand up the built-in PgBouncer on PostgreSQL Flexible Server in transaction mode on port 6432, size the pool, and avoid the session-state bugs (prepared statements,
LISTEN/NOTIFY, temp tables) that transaction pooling breaks. - Size a driver-side connection pool correctly for MySQL and PostgreSQL, accounting for instance count, replicas, and the reserved superuser slots the engine holds back.
- Read
SHOW PROCESSLIST/pg_stat_activity(andSHOW POOLSon PgBouncer) to see exactly who is holding connections and why. - Mitigate the outbound side of the storm — SNAT-style connection fan-out from App Service — using a NAT Gateway or Private Endpoints, and explain when each helps.
- Pick the right tier and pool size for a target concurrency, and explain which fix a bigger SKU actually solves versus merely hides.
Prerequisites & where this fits
You should already be comfortable standing up a Flexible Server — choosing a tier (Burstable / General Purpose / Business Critical), a SKU, and a networking model — and making a first connection. If that is fuzzy, work through Deploy Azure Database for MySQL Flexible Server: Networking, Backups and First Connection first; the create-time decisions there (especially the permanent public-vs-private networking choice) are upstream of everything here. You should know how to run az in Cloud Shell, read JSON output, and connect with the mysql or psql client. Familiarity with TCP connections, the idea of a connection pool, and basic SQL is assumed; you do not need to be a DBA.
This sits in the Databases / Troubleshooting track. It is the connection-management companion to the broader relational-troubleshooting playbook in Troubleshooting Azure SQL: Connectivity, Timeouts, Throttling and Blocking — Azure SQL Database handles connection limits differently (per-database/pool caps tied to vCores/DTUs), but the diagnostic discipline is identical. The observability you need to watch active connections lives in Azure Monitor and Application Insights for Observability. And because the outbound half of a storm often originates in your App Service tier, Azure NAT Gateway: Setup and Outbound Connectivity and Private Endpoint vs Service Endpoint are the network levers you will reach for.
A quick map of who confirms what during a connection-storm incident, so you call the right person fast:
| Layer | What lives here | Who usually owns it | How it causes a storm |
|---|---|---|---|
| Application / driver | The connection pool, pool size, leak handling | App / dev team | Oversized pool, unclosed connections, pool-per-instance fan-out |
| Front-end scale unit | Functions/Container Apps instance count | App + platform | Each instance opens its own pool → connections × instances |
| Pooler (PgBouncer) | Transaction pooling on 6432 (Postgres only) | Platform + DBA | Not enabled, or pool sized too large (re-creates the storm) |
| Engine (primary) | max_connections, reserved slots, backends |
DBA | Ceiling derived from SKU memory; exhaustion → refuse |
| Read replicas | Each has its own max_connections |
DBA | Pools split across replicas multiply total connections |
| Outbound (SNAT / NAT GW) | App Service egress to the DB | Platform + network | Source-port exhaustion looks like a DB connection failure |
Core concepts
Five mental models make every later diagnosis obvious.
A connection is a server-side resource with a memory cost, and the cap protects the box. PostgreSQL forks a separate backend process per connection; MySQL spawns a thread per connection. Either way the server holds per-connection state — buffers, work memory, a slot in an internal table — that consumes RAM whether or not a query is running. To keep a flood from exhausting memory and crashing the engine, both Flexible Server engines enforce max_connections, the hard ceiling on simultaneous connections, and refuse the next one past it. That refusal is a feature — the engine choosing to stay alive — which is exactly why it correlates with concurrency, not CPU.
max_connections is derived from the SKU’s memory, not chosen freely. On both engines the default and maximum allowed values scale with the memory of the compute SKU — a 2 GB Burstable server is allowed far fewer connections than a 32 GB General Purpose one, because the formula reserves RAM per connection. You can nudge the parameter but cannot set it higher than memory supports, and pushing it toward the ceiling trades connection headroom for the memory your queries need. The honest fixes are fewer connections (pooling) or more memory (a bigger SKU), in that order.
Idle connections still cost a slot. A connection that opened, ran one query, and now sits idle still occupies a slot and its memory. PostgreSQL has a dangerous variant — idle in transaction — where a connection opened a transaction and never committed; it holds its slot and blocks vacuum and locks rows. A pool of 200 connections that are 95% idle is indistinguishable, to max_connections, from 200 busy ones: the ceiling counts open sockets, not active queries. That is why an oversized-but-idle pool exhausts the engine as effectively as real load.
Pooling moves the bottleneck from the engine to a cheap multiplexer. A connection pool keeps a small set of warm connections and lends them to requests, so a thousand requests share, say, fifty database connections. There are two places to pool: the driver (each app process keeps its own pool) and a server-side pooler (one shared pool in front of the engine). Driver pooling alone breaks under fan-out — a hundred instances each holding a fifty-connection pool is five thousand connections. The robust answer is a transaction-mode pooler in front of the engine; on PostgreSQL Flexible Server that pooler, PgBouncer, is built in on port 6432. MySQL Flexible Server has no in-box pooler, so you pool correctly in the driver and, for heavy fan-out, front it with an external proxy.
Transaction pooling is cheap but breaks session state. A transaction-mode pooler returns the server connection to the pool at the end of every transaction, so a few backends serve many clients. The trade: anything assuming a stable server connection across transactions breaks — server-side prepared statements, session variables, LISTEN/NOTIFY, temp tables, advisory locks. You either avoid those features or configure the driver not to rely on a persistent session. This is why enabling PgBouncer occasionally produces “prepared statement does not exist” errors and how to fix them without abandoning pooling.
The vocabulary in one table
Before the deep sections, pin down every moving part. The glossary at the end repeats these for lookup; this table is the mental model side by side:
| Concept | One-line definition | Where it lives | Why it matters to a storm |
|---|---|---|---|
max_connections |
Hard ceiling on simultaneous connections | Server parameter (derived from SKU memory) | The wall you hit; exhaustion → refuse |
| Backend / thread | The server-side process (PG) or thread (MySQL) per connection | On the server VM | Each one costs RAM and a slot |
| Connection pool (driver) | Warm connections reused inside one app process | The app | Right-sized → few connections; oversized → storm |
| PgBouncer | Built-in transaction pooler (PostgreSQL only) | On the server VM, port 6432 | Multiplexes many clients onto few backends |
| Transaction pooling | Return connection to pool at end of each transaction | PgBouncer pool_mode |
Huge multiplexing; breaks session state |
| Idle in transaction | Open transaction, no commit, holding a slot (PG) | A backend’s state | Holds slot + blocks vacuum/locks |
| Reserved connections | Slots the engine holds back for superuser/admin | Inside max_connections |
Your apps get fewer than the raw number |
| SNAT port | Outbound source-port mapping from App Service | Per App Service instance | Exhaustion mimics a DB connection failure |
| Read replica | An async copy with its own max_connections |
A separate server | Pools split across replicas multiply totals |
How max_connections is derived from the SKU
The single most important fact in this article: on both Flexible Server engines, max_connections is a function of the SKU’s memory. You do not invent the number; the platform sets a default (and a ceiling) proportional to RAM, because each connection reserves memory. Bigger SKU → more memory → more allowed connections. This is why “the database is at 20% CPU but refusing connections” is not a contradiction: the limiting resource is the connection-slot budget, paid for in RAM, not CPU.
The practical consequences fall out immediately:
- A Burstable dev SKU (1–2 GB) supports only a low connection count — fine for one app, hopeless behind a serverless fan-out.
- General Purpose and Business Critical SKUs scale
max_connectionsup with their larger memory, but even a large SKU is finite and a storm can exhaust it. - Raising
max_connectionsby hand is bounded by the SKU and not free — every slot you reserve is memory your buffer pool / shared buffers and queries no longer have. Push it too high and you trade “connection refused” for OOM.
So the first move in any storm is to read the effective max_connections for the running SKU, not to assume a number — from the live server on either engine.
For MySQL, query the engine directly or read the server parameter:
# Read the effective max_connections the server is enforcing (MySQL)
mysql -h mysql-shop-prod.mysql.database.azure.com -u dbadmin -p \
  -e "SHOW VARIABLES LIKE 'max_connections';"
# Same value via the management plane (server parameter)
az mysql flexible-server parameter show \
  --resource-group rg-shop-prod --server-name mysql-shop-prod \
  --name max_connections \
  --query "{name:name, value:value, default:defaultValue, isConfigurable:isConfigPendingRestart}" -o table
For PostgreSQL, the same two paths:
# Effective max_connections (PostgreSQL) — note PG reserves some for superusers
psql "host=pg-shop-prod.postgres.database.azure.com port=5432 dbname=postgres user=pgadmin sslmode=require" \
  -c "SHOW max_connections;"
az postgres flexible-server parameter show \
  --resource-group rg-shop-prod --server-name pg-shop-prod \
  --name max_connections \
  --query "{name:name, value:value, default:defaultValue}" -o table
The reserved-slots subtlety bites people who size pools to the raw number. PostgreSQL holds back a small number of connections (superuser_reserved_connections, plus on Flexible Server the platform’s own monitoring/management connections) so an admin can always log in to fix a storm. Your application therefore gets fewer usable slots than max_connections prints. Always size your total app pool below the effective ceiling, leaving headroom.
How to reason about the ceiling per tier — the pattern, not invented exact numbers (read the live value; it scales with memory):
| Compute tier | Typical memory range | max_connections posture |
Right use | Connection risk |
|---|---|---|---|---|
| Burstable (B-series) | 0.5–16 GB | Low default, low ceiling (memory-bound) | Dev/test, one low-traffic app | Exhausts almost instantly behind fan-out |
| General Purpose | 4–256 GB | Moderate–high, scales with memory | Production default | Finite; a storm can still exhaust it |
| Business Critical (Memory Optimized) | High memory per vCore | Highest ceilings | Connection-heavy / memory-heavy prod | Pool correctly even here — finite |
Two rules that follow:
| Rule | Why | Anti-pattern it prevents |
|---|---|---|
Read the effective max_connections live before sizing pools |
It is SKU-derived, not a constant | Sizing to a number from an old tier or a blog |
| Leave headroom below the ceiling (reserved + admin + replicas) | Superuser/monitoring slots are carved out of the total | Maxing app pools to the printed number, locking yourself out |
Anatomy of a connection storm: the six root causes
A “too many connections” error has six distinct origins. Scan the matrix, then read the detail for whichever row matches your evidence:
| # | Root cause | Tell-tale signal | Confirm with | Real fix | Band-aid that masks it |
|---|---|---|---|---|---|
| 1 | SKU max_connections ceiling too low |
Even modest concurrency hits the wall | SHOW max_connections vs active count |
Scale SKU and/or pool | Restart (storm returns at peak) |
| 2 | Application pool oversized or leaked | Connections grow and never fall | SHOW PROCESSLIST / pg_stat_activity |
Right-size pool; fix leaks | Scale SKU (hides the leak) |
| 3 | Idle / idle-in-transaction holding slots | Many Sleep / idle in transaction rows |
pg_stat_activity.state |
Lower idle timeout; commit promptly | Bigger SKU (still leaks slots) |
| 4 | No pooler under high fan-out | Connections ≈ instances × pool size | Count distinct client IPs / app instances | PgBouncer (PG) / proxy + small pools (MySQL) | Scale out (multiplies connections) |
| 5 | Pools split across read replicas | Total > any single server’s max_connections |
Sum active across primary + replicas | Pool per role; route reads deliberately | Raise per-server cap |
| 6 | Genuine load exceeds capacity | All connections busy with real queries | Active (not idle) ≈ ceiling | Scale SKU; add replicas; cache | Pooling alone (real demand remains) |
This is the core of the playbook. Note which cause a bigger SKU actually fixes: only #1 (genuinely too-small ceiling) and #6 (genuine load) respond to scaling up. The other four are application or architecture bugs that a bigger SKU only postpones — and that distinction is the whole game.
Cause 1 — The SKU’s max_connections ceiling is simply too low
You deployed a Burstable SKU (often Standard_B1ms, 1 vCore / 2 GB) because it was cheap, then put a real workload behind it. The memory-derived max_connections on that tier is small, and even moderate concurrency walks straight into it. The database is healthy; the ceiling is just low for what you are asking of it.
Confirm. Read the effective ceiling and the current active count, and compare:
# PostgreSQL: ceiling vs current open connections
psql "host=pg-shop-prod.postgres.database.azure.com port=5432 dbname=postgres user=pgadmin sslmode=require" -c "
SELECT (SELECT setting::int FROM pg_settings WHERE name='max_connections') AS max_conn,
       count(*) AS current_conn
FROM pg_stat_activity;"
# MySQL: ceiling vs currently used + the historical high-water mark
mysql -h mysql-shop-prod.mysql.database.azure.com -u dbadmin -p -e "
SHOW VARIABLES LIKE 'max_connections';
SHOW STATUS LIKE 'Threads_connected';
SHOW STATUS LIKE 'Max_used_connections';"
If Max_used_connections (MySQL) is pinned at or near max_connections, or the PostgreSQL current count is bumping the ceiling, the wall is real. Confirm the metric in Azure Monitor too — both engines expose an active-connections metric you should alert on:
# Active-connections metric (works for both engines; metric name shown for MySQL Flexible Server)
az monitor metrics list \
  --resource $(az mysql flexible-server show -g rg-shop-prod -n mysql-shop-prod --query id -o tsv) \
  --metric active_connections --interval PT1M --aggregation Maximum -o table
Fix. If you are genuinely on a too-small tier and already pool well, scale the SKU up — more memory means a higher max_connections:
# Scale MySQL compute (brief restart) — moves to a SKU with more memory and a higher ceiling
az mysql flexible-server update --resource-group rg-shop-prod --name mysql-shop-prod \
  --sku-name Standard_D2ds_v4
resource mysql 'Microsoft.DBforMySQL/flexibleServers@2023-12-30' = {
  name: 'mysql-shop-prod'
  location: location
  sku: { name: 'Standard_D2ds_v4', tier: 'GeneralPurpose' }  // more RAM → higher max_connections
  properties: {
    version: '8.0.21'
    administratorLogin: 'dbadmin'
  }
}
But before reaching for the slider, confirm the ceiling is the real problem and not cover for an oversized pool (Cause 2). A small SKU exhausted at 95% idle connections does not need more memory — it needs fewer connections.
Cause 2 — The application pool is oversized or leaking connections
The most common real cause. The pool’s maximum size is far higher than you need, or connections are leaked — opened and never returned because of an unclosed handle, an exception path that skips Dispose/close, or an untuned framework default. Either way the open-connection count climbs and never falls, exhausting the ceiling with connections that are mostly doing nothing.
Confirm. Look at who is holding connections and what state they are in. On MySQL, SHOW PROCESSLIST (or the fuller information_schema.PROCESSLIST):
-- MySQL: how many connections, grouped by state — a sea of 'Sleep' means idle/leaked
SELECT COMMAND, COUNT(*) AS n, AVG(TIME) AS avg_secs
FROM information_schema.PROCESSLIST
GROUP BY COMMAND
ORDER BY n DESC;
On PostgreSQL, pg_stat_activity is the equivalent and is more informative:
-- PostgreSQL: connections by state and by client app — find the pool that won't let go
SELECT state, application_name, count(*) AS n,
       max(now() - state_change) AS longest_in_state
FROM pg_stat_activity
WHERE backend_type = 'client backend'
GROUP BY state, application_name
ORDER BY n DESC;
A large idle count that never shrinks, concentrated under one application_name, is a leaked or oversized pool. If the count equals (instances × pool max), it is a sizing problem (see Cause 4); if it grows unbounded over time, it is a leak.
Fix. First, cap the pool in the driver to a sane number (see the sizing section below) — a pool of 200 per process is almost never right. Second, fix the leak: ensure every connection is closed on every path. The pattern differs by stack but the principle is identical — acquire, use, release deterministically:
// .NET (Npgsql / MySqlConnector): 'using' guarantees the connection returns to the pool
await using var conn = new NpgsqlConnection(connectionString);   // pooled by default
await conn.OpenAsync();
await using var cmd = new NpgsqlCommand("SELECT 1", conn);
await cmd.ExecuteScalarAsync();
// conn is returned to the pool here, even on exception
Then set explicit pool bounds in the connection string rather than trusting defaults:
| Stack | Pool-size knob | Sensible starting value | Notes |
|---|---|---|---|
| .NET Npgsql (PostgreSQL) | Maximum Pool Size / Minimum Pool Size |
20–50 max per process | Default max is 100 — usually too high under fan-out |
| .NET MySqlConnector | MaximumPoolSize / MinimumPoolSize |
20–50 max per process | Pool per process; multiply by instance count |
| Java HikariCP | maximumPoolSize |
cores × 2 to start, then measure |
Hikari’s own guidance: small pools beat big ones |
Node pg / mysql2 |
max (pool size) |
10–20 per instance | Each Lambda/Function instance has its own pool |
| Python SQLAlchemy | pool_size + max_overflow |
pool_size=10, max_overflow=5 |
max_overflow adds temporary connections — count them in |
The rule that prevents the storm: total connections = pool max × app instances, and that product must stay comfortably under the effective max_connections. A pool correct for one instance becomes a storm at forty.
Cause 3 — Idle and idle-in-transaction connections hold slots hostage
A connection can be open, occupying a max_connections slot, and doing absolutely nothing. On MySQL these show as Sleep; on PostgreSQL as idle. Worse, on PostgreSQL a connection can be idle in transaction — it ran BEGIN, did some work, and then the application stalled (a slow downstream call, a bug, a debugger breakpoint) without COMMIT/ROLLBACK. That connection holds its slot, holds any locks it took, and blocks autovacuum from cleaning up — a slow-motion outage on top of the connection-count one.
Confirm. On PostgreSQL, find idle-in-transaction backends and how long they have been stuck:
-- PostgreSQL: idle-in-transaction backends, oldest first — these are the dangerous ones
SELECT pid, usename, application_name, state,
       now() - xact_start AS txn_age, now() - state_change AS idle_age,
       left(query, 60) AS last_query
FROM pg_stat_activity
WHERE state = 'idle in transaction'
ORDER BY xact_start;
On MySQL, long-lived Sleep connections:
-- MySQL: connections asleep for a long time — candidates for a lower wait_timeout
SELECT ID, USER, HOST, TIME AS idle_secs, STATE
FROM information_schema.PROCESSLIST
WHERE COMMAND = 'Sleep' AND TIME > 600
ORDER BY TIME DESC;
Fix. Two levers, server-side and app-side. Server-side, lower the idle timeouts so the engine reclaims slots automatically. On PostgreSQL set idle_in_transaction_session_timeout (kills a backend stuck in an open transaction) and consider idle_session_timeout:
# PostgreSQL: auto-terminate backends idle inside a transaction for > 60s (60000 ms)
az postgres flexible-server parameter set \
  --resource-group rg-shop-prod --server-name pg-shop-prod \
  --name idle_in_transaction_session_timeout --value 60000
On MySQL lower wait_timeout/interactive_timeout so abandoned Sleep connections close:
# MySQL: close non-interactive connections idle for > 300s (helps reclaim leaked Sleep slots)
az mysql flexible-server parameter set \
  --resource-group rg-shop-prod --server-name mysql-shop-prod \
  --name wait_timeout --value 300
App-side is the durable fix: keep transactions short — never hold one open across a third-party network call — and make sure the pool’s idle timeout returns connections promptly. Lowering server timeouts reclaims slots, but a well-behaved app never leaves a transaction idle in the first place.
The idle-state cheat sheet:
| State you see | Engine | Means | Danger | Lever |
|---|---|---|---|---|
Sleep |
MySQL | Open, no query running | Holds a slot | wait_timeout / pool idle timeout |
idle |
PostgreSQL | Open, between queries | Holds a slot | idle_session_timeout / pool idle timeout |
idle in transaction |
PostgreSQL | Open transaction, no commit | Holds slot + locks + blocks vacuum | idle_in_transaction_session_timeout; fix app |
active |
both | Actually running a query | Real work (not a leak) | Capacity / query tuning, not timeouts |
Cause 4 — High fan-out with no pooler (the serverless multiplier)
The storm that ambushes serverless and microservice architectures. Each front-end instance opens its own pool. A pool of 20 is harmless for one instance — but Azure Functions on Consumption or Flex can scale to hundreds of instances, and 200 instances × a 20-connection pool is 4,000 connections at a server whose ceiling might be a few hundred. The database falls over not because any client misbehaved but because the platform multiplied a reasonable per-instance pool by an unreasonable instance count.
Confirm. Count the distinct clients holding connections. On PostgreSQL, group by client address / application:
-- PostgreSQL: how many distinct front-end instances are connected, and how many each holds
SELECT client_addr, count(*) AS conns
FROM pg_stat_activity
WHERE backend_type = 'client backend'
GROUP BY client_addr
ORDER BY conns DESC;
If you see dozens of distinct client addresses each holding a handful of connections and the sum is near the ceiling, this is fan-out, not a leak.
Fix — PostgreSQL: turn on the built-in PgBouncer. This is the headline advantage of PostgreSQL Flexible Server for this exact problem: a transaction-mode pooler ships in the box, no sidecar to run or patch. Enable it and point the application at port 6432 instead of 5432. Now hundreds of client connections multiplex onto a small set of real backends:
# Enable the built-in PgBouncer and put it in transaction mode
az postgres flexible-server parameter set -g rg-shop-prod -s pg-shop-prod \
  --name pgbouncer.enabled --value true
az postgres flexible-server parameter set -g rg-shop-prod -s pg-shop-prod \
  --name pgbouncer.pool_mode --value transaction
az postgres flexible-server parameter set -g rg-shop-prod -s pg-shop-prod \
  --name pgbouncer.default_pool_size --value 50
# Application now connects on 6432 (PgBouncer), not 5432 (engine)
psql "host=pg-shop-prod.postgres.database.azure.com port=6432 dbname=appdb user=appuser sslmode=require"
// Bicep: PgBouncer is configured via server parameters (configurations)
resource pgbouncerEnabled 'Microsoft.DBforPostgreSQL/flexibleServers/configurations@2023-12-01-preview' = {
  name: '${pg.name}/pgbouncer.enabled'
  properties: { value: 'true', source: 'user-override' }
}
resource pgbouncerMode 'Microsoft.DBforPostgreSQL/flexibleServers/configurations@2023-12-01-preview' = {
  name: '${pg.name}/pgbouncer.pool_mode'
  properties: { value: 'transaction', source: 'user-override' }
}
The PgBouncer parameters you actually tune:
| Parameter | What it does | Sensible default | When to change | Gotcha |
|---|---|---|---|---|
pgbouncer.enabled |
Turns the pooler on | false |
Always, for serverless / high fan-out | App must connect on 6432 |
pgbouncer.pool_mode |
session / transaction / statement |
transaction |
Keep transaction for the multiplexing win | session defeats the purpose |
pgbouncer.default_pool_size |
Server-side backends per user/db pair | 50 | Size to backends the SKU affords | Too high re-creates the storm |
pgbouncer.min_pool_size |
Warm backends kept open | 0 | Raise to cut cold-connect latency | Holds backends even when idle |
pgbouncer.max_client_conn |
Client connections PgBouncer accepts | high | Cap to protect memory | Hitting it rejects clients |
pgbouncer.query_wait_timeout |
Max wait for a free backend | 120 s | Lower to fail fast under saturation | Too low errors legit queries |
Fix — MySQL: there is no in-box pooler, so pool small and front it. Your options, in order: (1) cap the per-instance driver pool aggressively so instances × pool stays under the ceiling; (2) for genuine high fan-out, run an external proxy — a ProxySQL instance — to multiplex connections the way PgBouncer does for Postgres; (3) reduce the instance count or batch work so fewer pools exist. There is no az flag for a built-in MySQL pooler because the feature does not exist — do not go looking for one.
The decision is stark and worth a table:
| Situation | PostgreSQL Flexible Server | MySQL Flexible Server |
|---|---|---|
| One app, modest concurrency | Driver pool is enough | Driver pool is enough |
| High fan-out (serverless / many instances) | Enable built-in PgBouncer (6432) | Cap pools small + external ProxySQL |
| Need transaction pooling without app changes | PgBouncer transaction mode | ProxySQL (you operate it) |
| Want zero pooler to run/patch | PgBouncer is managed in-box | No managed option — you run the proxy |
Cause 5 — Connection pools split across read replicas
You added one or more read replicas to offload reporting or read traffic. Each replica is a separate server with its own max_connections, and — crucially — your application now holds pools to each endpoint. If you sized each pool to the primary’s ceiling, the aggregate across primary + replicas can exceed what you intended, and a misrouted write or an analytics job hammering a replica can exhaust that replica independently while the primary looks fine.
Confirm. Check each endpoint separately; a replica can be exhausted while the primary is healthy:
-- Run on EACH endpoint (primary and each replica) — PostgreSQL
SELECT (SELECT setting::int FROM pg_settings WHERE name='max_connections') AS max_conn,
       count(*) AS current
FROM pg_stat_activity;
# List replicas so you know every endpoint to check (PostgreSQL example)
az postgres flexible-server replica list \
  --resource-group rg-shop-prod --server-name pg-shop-prod -o table
Fix. Pool per role, deliberately: a small write pool to the primary, a separate read pool to the replica set, each sized so the sum hitting any one server stays under that server’s ceiling. Route reads to replicas explicitly in code rather than letting an ORM open ad-hoc connections. And remember replicas are asynchronous — they can lag — so do not route read-after-write paths to them; that is a correctness bug, not just a connection one.
| Topology | Connection sizing rule | Failure if ignored |
|---|---|---|
| Primary only | Total app pools < primary ceiling | Standard storm |
| Primary + 1 read replica | Write pool + read pool, each < its server’s ceiling | Replica exhausted by analytics while primary idle |
| Primary + N replicas | Sum to any one replica < that replica’s ceiling | One hot replica storms while others sit empty |
Cause 6 — It is genuinely real load
Sometimes there is no bug. Every connection is active, running a real query, and you simply have more concurrent work than the current SKU can serve. This is the one case where the on-call instinct to scale is correct — after you have ruled out the other five, because they are far more common.
Confirm. The signature is the inverse of a leak: most connections are active, not idle:
-- PostgreSQL: ratio of active to idle — mostly 'active' near the ceiling = real load
SELECT state, count(*) FROM pg_stat_activity
WHERE backend_type = 'client backend' GROUP BY state;
-- MySQL: connections actually executing (not Sleep) — high and sustained = real load
SELECT COMMAND, COUNT(*) FROM information_schema.PROCESSLIST
WHERE COMMAND <> 'Sleep' GROUP BY COMMAND;
If active connections track CPU and throughput upward together, the database is doing genuine work at its limit. Fix. Scale the SKU up (more memory and vCores), add read replicas to offload reads, and cache hot reads in Azure Cache for Redis so fewer requests reach the database at all. Pooling still helps — it keeps the connection count efficient — but it cannot manufacture capacity that the workload genuinely needs.
The error-code and message reference
Mid-incident you scan this first: every connection-related error you realistically see from either engine, what it means on Flexible Server, the likely cause, how to confirm, and the first fix. The traps are telling a pure connection-count error apart from an authentication/firewall error that looks similar, and recognising the PgBouncer-specific errors that only appear once you turn pooling on.
| Error / message | Engine | Meaning | Likely cause | How to confirm | First fix |
|---|---|---|---|---|---|
ERROR 1040 (HY000): Too many connections |
MySQL | Ceiling reached | Pool too big / fan-out / leak | Threads_connected vs max_connections |
Pool smaller; then scale SKU |
ERROR 1203: User already has more than 'max_user_connections' |
MySQL | Per-user cap hit | A max_user_connections set below max_connections |
SHOW VARIABLES LIKE 'max_user_connections' |
Raise per-user cap or pool down |
FATAL: sorry, too many clients already |
PostgreSQL | Ceiling reached | Pool too big / fan-out / leak | count(*) in pg_stat_activity vs max_connections |
Enable PgBouncer; pool smaller |
FATAL: remaining connection slots are reserved for ... superusers |
PostgreSQL | Only reserved slots left | App used all non-reserved slots | Active count near ceiling | Free idle slots; pool down; scale |
remaining connection slots are reserved for roles with the SUPERUSER |
PostgreSQL | Variant of the above | Same | Same | Same |
prepared statement "S_1" does not exist |
PostgreSQL (via PgBouncer) | Server-side prepared stmt lost between transactions | Transaction pooling + server-side prepares | Errors appear only after PgBouncer enabled | Disable server-side prepares in driver |
server closed the connection unexpectedly |
PostgreSQL | Backend died / idle-timeout killed it | OOM, idle-timeout, failover | Server logs; metrics; idle_*_timeout |
Reconnect logic; investigate OOM/timeout |
Lost connection to MySQL server during query / error 2013 |
MySQL | Connection dropped mid-query | Timeout, wait_timeout, restart, network |
Server logs; wait_timeout value |
Retry; raise timeout if legitimately long |
MySQL server has gone away / error 2006 |
MySQL | Connection idle-closed or packet too big | wait_timeout reaped it; or max_allowed_packet |
wait_timeout; query size |
Reconnect; tune timeout / packet size |
ERROR 1226: User has exceeded the 'max_connections_per_hour' resource |
MySQL | Per-user hourly resource cap | A user-level resource limit set | SHOW GRANTS / resource options |
Raise/clear the per-user resource limit |
Connection times out / SocketException from App Service |
both | Outbound failure before the DB | SNAT port exhaustion at App Service | SNAT detector; NAT Gateway absent | NAT Gateway / Private Endpoint; reuse conns |
Three reading notes that save the most time:
| Distinction | The trap | How to tell them apart |
|---|---|---|
| Connection-count error vs auth/firewall error | Both look like “can’t connect” | A count error fires only under load and clears as connections free; an auth/firewall error fails 100% regardless of load (see Troubleshooting Azure SQL: Login Failed, Firewall and Entra Auth for the auth side) |
| Engine ceiling vs PgBouncer ceiling | After enabling PgBouncer you can hit its max_client_conn |
FATAL: too many clients from the engine vs PgBouncer rejecting at the pooler — check SHOW POOLS on 6432 |
| DB connection failure vs App Service SNAT exhaustion | The DB is blamed for an App Service egress problem | If the SNAT detector shows failed SNAT connections and the DB’s own active-connections metric is low, the failure is outbound, not the database |
Reading who holds connections: the live forensics
When the storm is active, two queries tell you everything — keep them in a snippet file. On PostgreSQL, pg_stat_activity is your single source of truth (state, age, query, client):
-- The one query to run during a PostgreSQL connection storm
SELECT state,
       count(*)                              AS conns,
       count(*) FILTER (WHERE state='idle in transaction') AS idle_in_txn,
       max(now() - state_change)             AS longest_idle,
       array_agg(DISTINCT application_name)  AS apps
FROM pg_stat_activity
WHERE backend_type = 'client backend'
GROUP BY state
ORDER BY conns DESC;
If you must shed load right now to recover, you can terminate the worst offenders (use surgically — this kills the backend and its transaction):
-- Last resort: terminate backends idle-in-transaction for > 5 minutes
SELECT pg_terminate_backend(pid)
FROM pg_stat_activity
WHERE state = 'idle in transaction' AND (now() - state_change) > interval '5 minutes';
On MySQL, SHOW PROCESSLIST / information_schema.PROCESSLIST is the equivalent, and KILL is the manual recovery:
-- MySQL: the storm-time view, plus the kill template
SELECT COMMAND, COUNT(*) n, AVG(TIME) avg_secs, MAX(TIME) max_secs
FROM information_schema.PROCESSLIST GROUP BY COMMAND ORDER BY n DESC;
-- KILL <ID>;  -- terminate a specific runaway connection by its process ID
When PgBouncer is enabled, there is a third place to look — the special pgbouncer admin database on port 6432 — which shows the multiplexing in action (many client connections, few server connections):
# Connect to the PgBouncer admin DB and read the pools
psql "host=pg-shop-prod.postgres.database.azure.com port=6432 dbname=pgbouncer user=pgadmin sslmode=require" \
  -c "SHOW POOLS;"
# cl_active = client conns busy, sv_active = server backends in use — sv should be << cl
What each forensic source tells you, at a glance:
| Source | Engine | Shows | Best for |
|---|---|---|---|
pg_stat_activity |
PostgreSQL | Per-backend state, age, query, client | Finding leaks, idle-in-txn, fan-out |
information_schema.PROCESSLIST |
MySQL | Per-thread command, state, time, user | Finding Sleep leaks, runaway queries |
SHOW POOLS (port 6432) |
PostgreSQL + PgBouncer | Client vs server connection counts | Proving the pooler is multiplexing |
active_connections metric |
both | Time-series of open connections | Alerting and trend, not per-connection detail |
Architecture at a glance
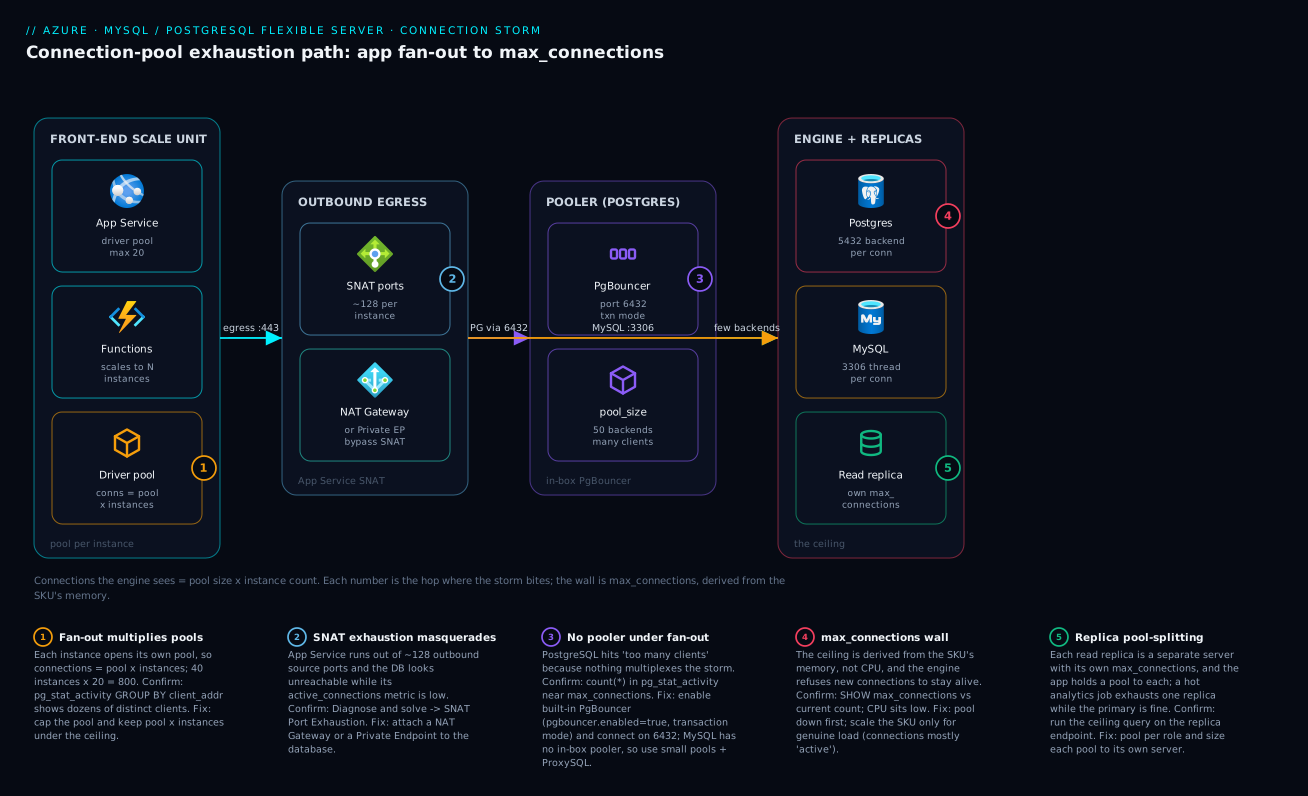
Follow the connection from the application to the engine and the storm becomes visual. Requests arrive at a front-end scale unit — App Service, or a serverless plane of Azure Functions / Container Apps that the platform multiplies to many instances under load. Each instance holds its own driver pool, so the connection count the database sees is pool size × instance count, not pool size. That product is the storm’s fuel. On the way out, App Service maps each outbound TCP connection through a finite SNAT port budget; if the app opens connections wastefully, it can exhaust source ports and fail before the packet ever reaches the database — a failure that masquerades as a database problem (badge 1).
At the database tier the two engines diverge. On PostgreSQL Flexible Server, you route through the built-in PgBouncer on port 6432 (badge 2): the pooler accepts hundreds of client connections and multiplexes them onto a small set of backends, so the engine on 5432 only ever sees default_pool_size connections. On MySQL Flexible Server there is no in-box pooler, so the driver pools (or an external ProxySQL you operate) must keep the count down before it reaches port 3306. Either way the connections land on the engine, where max_connections — derived from the SKU’s memory and partly reserved for the platform’s monitoring/admin slots — is the wall (badge 3). Add read replicas (badge 4) and the app holds pools to multiple endpoints, each with its own ceiling, multiplying the totals again. The diagram maps each numbered failure onto the hop where it bites, and the legend narrates every number as symptom · how to confirm · fix.
Real-world scenario
Saffron Cart, a mid-size Indian e-commerce store, moved its order pipeline to Azure Functions (Flex Consumption) reading and writing PostgreSQL Flexible Server — a General Purpose D2ds_v4 (2 vCores, 8 GB) in Central India. In normal traffic it was flawless: the functions held a small Npgsql pool (Maximum Pool Size = 20), the database sat at single-digit CPU, and the team congratulated themselves on a clean serverless design.
The first festival flash sale broke it at 13:02. Order-placement requests began failing with FATAL: sorry, too many clients already — at 19% CPU. The on-call engineer, reasoning that a sale means “more load,” scaled the SKU to D4ds_v4, doubling compute. The storm paused for eleven minutes (the bigger SKU’s higher memory-derived max_connections absorbed it) and returned, identical, now at 11% CPU. Scaling bought a brief reprieve and a higher bill, and fixed nothing.
The real diagnosis took one query. SELECT client_addr, count(*) FROM pg_stat_activity GROUP BY client_addr showed forty-three distinct client addresses, each holding 18–20 connections — roughly 820 connections, almost all in state idle, against a ceiling in the low hundreds. The platform had scaled Functions to forty-three instances, and each had faithfully opened its own twenty-connection pool. No single pool was wrong; the product was. Textbook Cause 4 — high fan-out with no pooler — treated by a bigger SKU as Cause 6.
The fix was three parameters and a port change. They enabled the built-in PgBouncer (pgbouncer.enabled=true, pool_mode=transaction, default_pool_size=50) and repointed the connection string from 5432 to 6432. Immediately SHOW POOLS told the story: ~800 client connections multiplexed onto ~50 server backends, and the engine never saw more than the pool size however far Functions scaled. They reverted the SKU to D2ds_v4 — never the problem — and alerted on active_connections at 70% of the ceiling so the next storm would page before refusing a customer.
The follow-up surfaced one transaction-pooling gotcha: a reporting query used a server-side prepared statement and threw prepared statement does not exist under PgBouncer. The fix was disabling server-side prepares (Max Auto Prepare=0) for that workload only. Monthly cost went down, the next sale ran clean, and the lesson on the wall read: “A connection storm is an application-fan-out problem wearing a database costume. Count the clients before you touch the SKU.”
Advantages and disadvantages
The two engines’ approaches to this problem trade off cleanly, and choosing well at design time saves you the 13:02 incident:
| Approach | Advantages | Disadvantages |
|---|---|---|
| PostgreSQL Flexible Server + built-in PgBouncer | Managed pooler in the box — nothing to run/patch; transaction pooling gives huge multiplexing; survives failover on the same FQDN:6432 | Transaction pooling breaks session state (prepared statements, LISTEN/NOTIFY, temp tables); the pool is local to the primary, not a tier you scale independently |
| MySQL Flexible Server + driver pooling only | Simple; no extra hop; fine for one app at modest concurrency | No in-box pooler; high fan-out forces you to operate an external ProxySQL; easy to storm if pools aren’t capped |
| Scaling the SKU up | The right fix for a genuinely small ceiling or genuine load; immediate | Hides leaks and fan-out; recurring cost; the storm returns at the next peak if the cause was application-side |
| Driver pooling without a server pooler | Zero extra infrastructure; lowest latency per query | Breaks under fan-out — connections = pool × instances; a pool correct for 1 instance storms at 40 |
When each matters: reach for PgBouncer transaction mode the moment a PostgreSQL database sits behind anything serverless or many-instance — the highest-leverage fix, and free. Accept its session-state limit by keeping the app stateless at the connection level. On MySQL, lean on small, correctly-sized driver pools first, and stand up an external proxy only when fan-out genuinely demands it — that proxy is real operational weight you now own. Reserve scaling the SKU for the two causes it actually fixes: a ceiling genuinely too low for a well-pooled app, and genuine sustained load.
Hands-on lab
This lab reproduces a connection storm on a cheap PostgreSQL Flexible Server, observes the ceiling, then fixes it with the built-in PgBouncer — end to end, teardown included. A Burstable SKU keeps it inexpensive; stop the server when you pause to avoid compute charges.
1. Create a small server (Burstable, public access for the lab).
RG=rg-poollab; LOC=centralindia; PG=pg-poollab-$RANDOM
az group create -n $RG -l $LOC
az postgres flexible-server create \
  --resource-group $RG --name $PG --location $LOC \
  --tier Burstable --sku-name Standard_B1ms \
  --storage-size 32 --version 16 \
  --admin-user pgadmin --admin-password 'Lab-Passw0rd!2026' \
  --public-access 0.0.0.0   # adds a firewall rule for Azure services; tighten for real use
2. Read the effective ceiling — this is the wall you will hit.
FQDN=$(az postgres flexible-server show -g $RG -n $PG --query fullyQualifiedDomainName -o tsv)
psql "host=$FQDN port=5432 dbname=postgres user=pgadmin sslmode=require" -c "SHOW max_connections;"
# Note the number — it is small on B1ms because max_connections scales with memory.
3. Storm it. Open more connections than the ceiling with a tiny loop (each psql stays open via a sleep). Expect FATAL: sorry, too many clients already once you pass the ceiling:
# Open N background psql sessions that each hold a connection idle for 60s
for i in $(seq 1 80); do
  psql "host=$FQDN port=5432 dbname=postgres user=pgadmin sslmode=require" \
    -c "SELECT pg_sleep(60);" >/dev/null 2>&1 &
done
# In another shell, watch the count climb toward the ceiling and then refuse:
psql "host=$FQDN port=5432 dbname=postgres user=pgadmin sslmode=require" \
  -c "SELECT count(*) AS open_conns FROM pg_stat_activity;"
4. See who is holding slots (the forensic query you would run in production):
psql "host=$FQDN port=5432 dbname=postgres user=pgadmin sslmode=require" -c "
SELECT state, count(*) FROM pg_stat_activity
WHERE backend_type='client backend' GROUP BY state;"
# A pile of 'active' (running pg_sleep) — in a real leak these would be 'idle'.
5. Fix it with the built-in PgBouncer. Enable the pooler, set transaction mode, then connect on 6432:
az postgres flexible-server parameter set -g $RG -s $PG --name pgbouncer.enabled --value true
az postgres flexible-server parameter set -g $RG -s $PG --name pgbouncer.pool_mode --value transaction
az postgres flexible-server parameter set -g $RG -s $PG --name pgbouncer.default_pool_size --value 20
# Connect through the pooler (6432). Many clients now multiplex onto ~20 backends.
psql "host=$FQDN port=6432 dbname=postgres user=pgadmin sslmode=require" -c "SHOW max_connections;"
6. Prove the multiplexing via the PgBouncer admin database:
psql "host=$FQDN port=6432 dbname=pgbouncer user=pgadmin sslmode=require" -c "SHOW POOLS;"
# cl_active (clients) >> sv_active (server backends) — the pooler is doing its job.
7. Teardown. Delete the resource group so nothing lingers on the bill:
az group delete --name $RG --yes --no-wait
What you should have seen: a small SKU refusing connections at a low ceiling, the ceiling confirmed with one query, and the same workload sailing through once it multiplexed via PgBouncer on 6432 — without changing the SKU at all.
Common mistakes & troubleshooting
The playbook, expanded. Find your symptom, confirm with the exact command, apply the fix. This table spans the basic mistakes (oversized pool, wrong port) and the advanced ones (idle-in-transaction, replica splitting, SNAT exhaustion):
| # | Symptom | Root cause | Confirm (exact command / portal path) | Fix |
|---|---|---|---|---|
| 1 | Too many connections (MySQL) at low CPU |
Pool × instances exceeds ceiling | SHOW STATUS LIKE 'Threads_connected' vs max_connections |
Cap driver pool; for fan-out add ProxySQL |
| 2 | too many clients already (PG) at low CPU |
Same, no pooler | count(*) in pg_stat_activity vs max_connections |
Enable PgBouncer on 6432; size pool |
| 3 | Connections climb and never fall | Leaked connections (unclosed handles) | pg_stat_activity shows growing idle under one app |
Wrap in using/finally; close on every path |
| 4 | Many idle in transaction (PG) |
Open transaction across a slow call / bug | Idle-in-txn query (oldest first) | Set idle_in_transaction_session_timeout; shorten txns |
| 5 | Sea of Sleep connections (MySQL) |
Idle pooled connections never reaped | PROCESSLIST where COMMAND='Sleep' |
Lower wait_timeout; tune pool idle timeout |
| 6 | Storm only under load, fine at rest | Serverless fan-out (instances × pool) | GROUP BY client_addr count of distinct instances |
PgBouncer (PG) / small pools + proxy (MySQL) |
| 7 | Replica refuses while primary is fine | Pools split; replica exhausted independently | Run the ceiling query on the replica endpoint | Pool per role; cap each pool to its server |
| 8 | Scaling SKU “fixes” it for an hour, then returns | Treating fan-out/leak as capacity | Connections mostly idle near ceiling |
Pool down first; SKU is not the cause |
| 9 | prepared statement does not exist after enabling PgBouncer |
Transaction pooling + server-side prepares | Error appears only post-PgBouncer | Disable server-side prepares (Max Auto Prepare=0, JDBC prepareThreshold=0) |
| 10 | remaining connection slots are reserved for superusers (PG) |
App used all non-reserved slots | Active count = ceiling − reserved | Free idle slots; size pool below ceiling − reserved |
| 11 | DB times out from App Service, DB metric is low | SNAT port exhaustion (outbound), not DB | Diagnose and solve → SNAT Port Exhaustion; DB active_connections low |
NAT Gateway / Private Endpoint; reuse connections |
| 12 | MySQL server has gone away (2006) |
Idle connection reaped by wait_timeout; or large packet |
Compare idle time to wait_timeout; check query size |
Reconnect logic; raise wait_timeout/max_allowed_packet if legit |
| 13 | User has exceeded the max_user_connections (1203/1226) |
Per-user cap below max_connections |
SHOW VARIABLES LIKE 'max_user_connections'; SHOW GRANTS |
Raise/clear the per-user resource limit |
| 14 | After raising max_connections, random query failures |
Ceiling pushed past what RAM supports → OOM | Memory metric near 100%; backends killed | Lower max_connections; scale memory instead; pool |
| 15 | Connections fine, but app slow under load | All backends busy — genuine load | pg_stat_activity mostly active; CPU/throughput high |
Scale SKU; add read replicas; cache hot reads |
Per-symptom detail on the three that fool people most
Idle in transaction (row 4) is the silent killer. It holds not just a slot but locks, and it blocks autovacuum — so on top of the connection-count incident you get table bloat and lock waits. The cause is almost always a transaction left open across a network call (a payment gateway, an external API) or a paused debugger. idle_in_transaction_session_timeout is a seatbelt, not a fix: the real repair is to never hold a transaction open across anything slow.
SNAT exhaustion (row 11) is a database problem that is not a database problem. When App Service makes many outbound connections without reuse, it can exhaust its finite SNAT port budget (about 128 pre-allocated per instance). New connections fail, and because the failure reads “can’t connect to the database,” everyone stares at the database — whose active_connections metric is sitting low and innocent. The tell is exactly that contradiction. Confirm in Diagnose and solve problems → SNAT Port Exhaustion, then fix on the network side: a NAT Gateway gives a vastly larger source-port pool, and a Private Endpoint keeps traffic off SNAT entirely.
Scaling that “works” then fails (row 8) is the most expensive mistake. A bigger SKU raises the memory-derived max_connections, so it absorbs an oversized pool or fan-out long enough to look like a fix and teach the wrong lesson. The diagnostic that cuts through it: if the connections near the ceiling are mostly idle, scaling is treating an application bug as a capacity problem. Pool down first; scale only when the connections at the ceiling are genuinely active.
Best practices
- Pool in the driver, always, and cap the maximum. Set an explicit
Maximum Pool Size/maximumPoolSize/max— never trust the default (often 100). Size it small; a pool of 10–50 per process serves enormous throughput when connections are reused. - Compute
pool max × instance countand keep it under the effective ceiling. This single multiplication prevents the serverless storm. A pool that is correct for one instance is a storm at forty. - On PostgreSQL behind anything serverless or many-instance, enable the built-in PgBouncer in transaction mode and connect on 6432. It is free, managed, and the highest-leverage fix for this entire class of problem.
- On MySQL, cap pools aggressively and add an external proxy (ProxySQL) only when fan-out demands it — there is no in-box pooler, so the driver pool is your primary defence.
- Read the effective
max_connectionslive before sizing anything. It is derived from the SKU’s memory, not a constant; do not size to a number from a blog or an old tier. - Leave headroom below the ceiling for reserved superuser/monitoring slots, so an admin can always log in to fix a storm and so a small spike does not refuse customers.
- Keep transactions short; never hold one open across a network call. This is the durable fix for idle-in-transaction and most leaks.
- Set idle timeouts as a backstop —
idle_in_transaction_session_timeouton PostgreSQL,wait_timeouton MySQL — to reclaim abandoned slots automatically. - Alert on the
active_connectionsmetric at ~70% of the ceiling. Page before the engine refuses a connection, not after. - Pool per role across replicas. A separate, sized read pool to replicas and a write pool to the primary; route reads deliberately and never read-after-write from an async replica.
- Prefer scaling memory over raising
max_connectionsby hand. Pushing the parameter toward the SKU’s ceiling trades query memory for slots and risks OOM.
Security notes
Connection management and security overlap more than people expect. Pooling concentrates credentials and traffic, so get the surrounding posture right:
- Use a least-privilege application login, not the admin. The admin account is for break-glass and reserved-slot recovery; the app should connect as a dedicated role/user with only the rights it needs. This also means a runaway app pool cannot exhaust the admin’s reserved slots.
- Prefer Microsoft Entra (Azure AD) authentication over passwords where supported — short-lived tokens beat a static password in every instance’s connection string, and a leaked token expires. Keep any password-based string in Key Vault, referenced at runtime, never in source.
- Enforce TLS. Keep
sslmode=require(PostgreSQL) / TLS enforced (MySQL) so pooled connections are not plaintext on the wire. - Prefer private networking. A Private Endpoint or VNet-integrated (private access) server keeps traffic off the public internet and off the App Service SNAT pool entirely — which, as row 11 shows, removes a whole class of “connection failure” incidents. The public-vs-private model is a create-time decision (you cannot switch a public server to private later), so choose private for production up front — see Deploy Azure Database for MySQL Flexible Server.
- Lock the firewall. If you must use public access, restrict the firewall to known ranges;
0.0.0.0“allow Azure services” is for labs, not production.
Cost & sizing
The connection budget is the cheapest resource to get wrong expensively. The bill is driven by the compute SKU (vCores + memory), storage (size + IOPS), HA (a standby doubles compute), backups beyond your provisioned storage, and any read replicas (each a full compute charge). max_connections itself is free — it rides on the memory you already pay for — which is exactly why “scale the SKU to get more connections” is a tax you pay forever for a problem pooling solves once.
| What drives the bill | Lever | Rough effect | Note |
|---|---|---|---|
| Compute SKU (vCores + RAM) | Tier/SKU | The dominant cost; also sets max_connections |
Scale for real load, not to hide a pool bug |
| Read replicas | Add/remove | A full compute charge per replica | Each carries its own connection ceiling |
| HA (zone-redundant) | Enable/disable | ~Doubles compute (hot standby) | Worth it for prod; not for the connection problem |
| Storage + IOPS | Size / tier | Grows but never shrinks | Auto-grow on; unrelated to connections |
| PgBouncer | Free (in-box) | No extra charge | Solves the storm at zero infra cost |
| External ProxySQL (MySQL) | You operate it | A VM/container you pay + run | Only when fan-out genuinely demands it |
Sizing guidance by need:
| Need | Tier / move | Why |
|---|---|---|
| Dev / learning / one low-traffic app | Burstable B1ms/B2s |
Cheapest real server; stop it overnight to pay storage only |
| Production, modest concurrency, well-pooled | General Purpose D2ds_v4+ |
Enough memory-derived ceiling; pool keeps it efficient |
| High fan-out (serverless / microservices) | GP SKU + PgBouncer (PG) | The pooler — not a bigger SKU — is the fix |
| Genuinely connection/memory-heavy | Business Critical (Memory Optimized) | Highest ceilings; still pool correctly |
The single biggest dev-cost lever remains stop/start: a stopped Flexible Server bills only for storage. For the connection problem specifically, the lever is the realisation that pooling is free and scaling is not — fixing a fan-out storm with PgBouncer can let you scale a SKU back down, as Saffron Cart did.
Rough INR/USD reference (Central India, list, varies): a Burstable B1ms runs ~₹1,000–1,400 / month (~$12–17) of compute; a General Purpose D2ds_v4 ~₹9,000–11,000 / month (~$110–135); HA roughly doubles compute; a read replica adds a full compute charge. PgBouncer adds ₹0.
Interview & exam questions
These map to AZ-204 (developing solutions for Azure, including connection resilience and managed databases) and DP-300 (administering relational databases on Azure).
-
Why does
max_connectionsnot scale with CPU? Each connection costs memory (a forked backend on PostgreSQL, a thread with buffers on MySQL), so the platform derives the ceiling from the SKU’s memory, reserving RAM per slot. A box refuses connections at 20% CPU because the limiting resource is memory-backed slots, not compute. -
A serverless app gets “too many clients” at 15% CPU. What is happening, and the fix? High fan-out: each of N instances holds its own pool, so connections = pool × N. The fix is a transaction-mode pooler — built-in PgBouncer on PostgreSQL (6432) — not a bigger SKU, which only hides the multiplication.
-
What does
idle in transactioncost beyond a slot? It holds the transaction’s locks and blocks autovacuum, causing bloat and lock waits on top of the connection-count problem. Guard withidle_in_transaction_session_timeout; fix by keeping transactions short. -
MySQL has no built-in pooler. How do you handle high fan-out? Cap per-instance driver pools small so pool × instances stays under the ceiling, and for genuine fan-out front the database with an external proxy such as ProxySQL. There is no managed in-box pooler to enable.
-
What is the trade-off of PgBouncer transaction mode? It multiplexes many clients onto few backends but returns the server connection at the end of each transaction, breaking anything assuming a stable session — server-side prepared statements,
LISTEN/NOTIFY, temp tables. Disable server-side prepares in the driver to coexist. -
How do you confirm a failure is the database vs App Service SNAT exhaustion? Compare the SNAT detector (failed SNAT connections) against the database’s
active_connectionsmetric. SNAT failing while the DB count is low means an outbound source-port problem — fixed with NAT Gateway or Private Endpoint, not the database. -
Why can raising
max_connectionsby hand make things worse? It is bounded by the SKU’s memory, and every slot reserves RAM your queries need. Push it past what memory supports and the engine OOM-kills backends, turning “connection refused” into random query failures. -
A read replica refuses connections while the primary is healthy. Why? Each replica is a separate server with its own
max_connections, and the app holds a separate pool to it; an analytics job can exhaust it independently. Pool per role and size each pool to its own server. -
What reserved capacity should you account for on PostgreSQL?
superuser_reserved_connectionsplus the platform’s monitoring/management connections are carved out ofmax_connections, so usable app slots are fewer than the printed number. Size total app pools belowceiling − reservedto keep an admin login available. -
Which storm causes does scaling the SKU actually fix? Only two: a ceiling genuinely too small for a well-pooled app, and genuine sustained load (connections mostly
active). Oversized pools, leaks, idle-in-transaction, missing pooler, and replica-splitting are bugs a bigger SKU only postpones. -
How do you size a driver pool to start? Begin near
cores × 2(HikariCP’s guidance generalises well), cap the maximum explicitly, and verifypool max × instancesstays undermax_connections − reserved. Then measure under load and adjust. -
Where do you look, live, to see who holds connections?
pg_stat_activityon PostgreSQL andinformation_schema.PROCESSLIST/SHOW PROCESSLISTon MySQL. With PgBouncer enabled,SHOW POOLSon thepgbounceradmin database (6432) proves the multiplexing.
Quick check
- On Flexible Server, which resource is
max_connectionsderived from — CPU, memory, or storage? - Which port does the built-in PgBouncer listen on, and which engine has it?
- You see hundreds of
idleconnections near the ceiling. Is a bigger SKU the right first move? Why or why not? - What does PostgreSQL’s
idle in transactionblock beyond holding a connection slot? - The app cannot reach the database, but the database’s
active_connectionsmetric is low. What should you suspect first?
Answers
- Memory. Each connection reserves RAM (a forked backend on PostgreSQL, a thread + buffers on MySQL), so the ceiling scales with the SKU’s memory, not CPU or storage.
- Port 6432, on PostgreSQL Flexible Server (the engine itself is on 5432). MySQL Flexible Server has no built-in pooler.
- No. Mostly-idle connections near the ceiling signal an oversized/leaked pool or fan-out — an application problem. Pool down first; a bigger SKU only raises the ceiling enough to hide the bug for a while.
- It holds any locks the transaction took and blocks autovacuum, causing table bloat and lock waits on top of the connection-count problem.
- App Service SNAT port exhaustion (outbound source-port exhaustion), not the database. Confirm with the SNAT detector; fix with a NAT Gateway or a Private Endpoint to the database.
Glossary
max_connections— The hard ceiling on simultaneous connections an engine accepts; on Flexible Server it is derived from the SKU’s memory.- Backend (PostgreSQL) — The forked server process that serves one connection; costs several MB of RAM each.
- Thread (MySQL) — The server thread that serves one connection; lighter than a PG backend but still capped and memory-costing.
- Connection pool — A set of warm connections reused across requests so many requests share few database connections.
- PgBouncer — The transaction-mode connection pooler built into PostgreSQL Flexible Server, listening on port 6432.
- Transaction pooling — A pooler mode that returns the server connection to the pool at the end of each transaction; maximises multiplexing but breaks session state.
- Idle in transaction — A PostgreSQL connection with an open, uncommitted transaction; holds its slot, holds locks, and blocks autovacuum.
- Reserved connections — Slots (
superuser_reserved_connections+ platform monitoring) carved out ofmax_connectionsso an admin can always connect. - SNAT port — The finite outbound source-port budget App Service uses for egress; exhaustion mimics a database connection failure.
- Read replica — An asynchronous copy of the database on a separate server, each with its own
max_connections. pg_stat_activity— The PostgreSQL view showing every backend’s state, age, query and client — the primary storm-time forensic tool.PROCESSLIST— The MySQL equivalent (SHOW PROCESSLIST/information_schema.PROCESSLIST), showing per-thread command, state and time.- ProxySQL — An external proxy you operate in front of MySQL to multiplex connections, since MySQL has no in-box pooler.
wait_timeout— The MySQL server parameter that closes non-interactive connections after they are idle for the configured seconds.
Next steps
- Stand up the database properly first: Deploy Azure Database for MySQL Flexible Server: Networking, Backups and First Connection.
- Master the broader relational-troubleshooting discipline (timeouts, throttling, blocking) in Troubleshooting Azure SQL: Connectivity, Timeouts, Throttling and Blocking.
- Wire up the metrics and alerts that page you before the ceiling: Azure Monitor and Application Insights for Observability.
- Fix the outbound half of a storm at the network layer: Azure NAT Gateway: Setup and Outbound Connectivity and Private Endpoint vs Service Endpoint.
- Take real load off the database entirely with caching: Azure Cache for Redis 101: Tiers, Cache-Aside Patterns and Connecting Your First App.