The ticket says “the instance is slow.” That is all you get, and it is almost useless — because a “slow” EC2 instance is never just slow. It is one of exactly four physical resources being starved: CPU (or, on a burstable box, the burst credits that stand in for CPU), memory, disk (space, inodes, or EBS throughput), or the network (the ENA driver’s per-instance allowances). The whole skill of diagnosing a struggling instance is a disciplined sweep across those four axes, in order, asking one question at each: is this the bottleneck, and what is the single command or metric that proves it? Do the sweep and you find the cause in minutes. Skip it — reach for the reboot, or bump the instance size on a hunch — and you will “fix” it three times before it comes back.
The trap that swallows most engineers on day one is trusting the wrong vantage point. AWS gives you CloudWatch CPUUtilization for free, it is right there on the console graph, and it is a hypervisor view — a 1-to-5-minute average of the physical core as the Nitro/Xen layer sees it. It cannot see CPU steal, it has no idea how much memory you are using (there is no default memory metric on EC2 at all), it cannot see inode exhaustion or EBS await, and it is blind to ENA packet drops. So the instance can be face-down in the dirt while the one graph everyone looks at reads a calm 30%. The first move in every EC2 performance incident is therefore to reconcile two views: what the hypervisor reports in CloudWatch, and what the guest OS actually reports with top, free, iostat and ethtool. The gap between them is the diagnosis.
This article is a working playbook, not a tour. You will learn to read each of the four axes correctly — load average versus %util, the %st steal column that outs a burstable running on empty, the available memory that everyone confuses with free, the df -i inode counter that fires the same No space left on device as a full disk, the VolumeQueueLength and BurstBalance that expose an EBS bottleneck, and the ethtool -S allowance counters (bw_in_allowance_exceeded, pps_allowance_exceeded, conntrack_allowance_exceeded, linklocal_allowance_exceeded) that almost nobody knows exist. You will get a symptom→resource→confirm→fix table you can keep open during an incident, deep prose on the three nastiest failures (credit-exhaustion steal, the invisible OOM, and ENA conntrack drops), and a copy-pasteable lab that installs the CloudWatch agent, drives load with stress-ng, drains a gp2 BurstBalance, and reads it all back — with aws CLI, SSM, and Terraform — then tears it down so it costs nothing.
What problem this solves
When an instance degrades, the business impact is immediate: the API times out, the queue backs up, the batch job blows its window. But the cause can live in any of four resources, and the symptoms overlap viciously — a high load average can mean a CPU-bound app or a disk stuck in I/O wait; a process dying can mean a crash or the kernel’s OOM killer; intermittent latency can mean a noisy neighbour or your own ENA bandwidth allowance being enforced. Without a method, every incident becomes a random walk: reboot (fixes nothing if it’s a leak that refills in an hour), resize to a bigger instance (a €200/month band-aid over a gp2 volume that needed a €4 change to gp3), or open a support case (fixes nothing if it’s your own inode exhaustion).
The pain is sharpest because of one specific gap: the default EC2 metrics lie by omission. You get CPUUtilization, NetworkIn/Out, disk ops for instance-store, and status checks — and nothing for memory, nothing for guest disk space or inodes, nothing for EBS latency, and nothing for ENA drops. Teams that never installed the CloudWatch agent are flying half-blind: they can see that the box is unhappy but not which resource is starved, and the one metric they can see (CPUUtilization) is exactly the one that hides steal. So the first OOM at 3 a.m. is a genuine mystery — the app “just disappeared” and the graphs show nothing.
Who hits this: anyone who runs EC2 — which, despite the serverless era, is still most production AWS. It is squarely in SOA-C02 (SysOps — the troubleshooting cert, which tests CloudWatch agent, credit metrics, and EBS performance), SAA-C03 (Solutions Architect Associate — burstable vs fixed, EBS volume types, right-sizing), and DVA-C02 (Developer — reading logs and metrics to debug an app on EC2). Master the four-axis sweep and you stop guessing; you diagnose.
Learning objectives
By the end of this article you can:
- Run the four-axis sweep on any struggling instance — CPU/credits, memory/OOM, disk/EBS, network/ENA — and name the one command or metric that confirms each.
- Reconcile the hypervisor view with the guest view: know exactly what CloudWatch
CPUUtilizationcan and cannot see, and why steal, memory, inodes, EBSawaitand ENA drops are all invisible to it. - Diagnose CPU correctly: separate load average from
%util, read theus/sy/wa/st/idbreakdown, catch single-core saturation hidden by the average, and prove burst-credit exhaustion with%stplusCPUCreditBalance. - See the invisible OOM: install the CloudWatch agent for
mem_used_percent, readavailablevsfreecorrectly, and confirm an OOM kill fromdmesg/journalctl. - Split “No space left on device” into full-disk vs inode exhaustion (
df -hvsdf -i), find the space withdu/ncdu/lsof, and grow a volume online. - Prove an EBS bottleneck with
iostatawait/%util,VolumeQueueLength, andBurstBalance, and know when the instance EBS ceiling — not the volume — is the cap. - Read the ENA allowances with
ethtool -S(bw_in/out,pps,conntrack,linklocal) and know that the only lever is instance size plus workload shape. - Instrument, reproduce, and fix all four in a hands-on lab with
awsCLI, SSM,stress-ng, and Terraform.
Prerequisites & where this fits
You should be comfortable launching an EC2 instance, connecting to it (SSH or, better, SSM Session Manager), and reading a CloudWatch graph. You should know roughly what an EBS volume is and that instances come in families (T, M, C, R…). Basic Linux fluency — top, df, grep, reading /proc — is assumed; this article sharpens it into a method.
Where it fits: this is the runtime performance layer of operating EC2. It sits downstream of choosing the instance — if you pick the wrong family or size, no amount of diagnosis saves you, so pair this with Choosing EC2 Instance Types & Families. It sits beside reachability troubleshooting — a box that is slow is a different problem from a box you cannot reach, which is EC2 status checks, boot and recovery and SSH connect/timeout troubleshooting. It depends on access without SSH keys for safe blast-radius-free debugging via SSM Session Manager, Patch & Run Command. And the network axis overlaps VPC-level analysis in VPC Flow Logs network troubleshooting — though, crucially, ENA allowance drops never appear in Flow Logs, only in ethtool.
Core concepts
The four axes and the two views
Every EC2 performance problem reduces to a resource that is saturated (100% busy, work queuing behind it) or exhausted (a countable thing — credits, inodes, memory, connections — hit zero). Utilization tells you how busy; saturation (queue depth, wait time) tells you it has run out of headroom; errors tell you it broke. This is Brendan Gregg’s USE method — Utilization, Saturation, Errors — applied per resource, and it is the backbone of the sweep. A resource at 70% utilization with no queue is fine; the same 70% with a growing queue is your bottleneck.
| Resource | Utilization (how busy) | Saturation (queuing / running out) | Errors |
|---|---|---|---|
| CPU | %us+%sy, CPUUtilization |
run queue r > vCPUs; %st (throttle) |
thermal/throttle events (rare on EC2) |
| Memory | mem_used_percent (agent) |
swap si/so; available→0 |
OOM kills (dmesg) |
| Disk (EBS) | iostat %util; IOPS vs provisioned |
await↑, aqu-sz > 1, VolumeQueueLength > 1 |
I/O errors, EROFS, nvme timeouts (dmesg) |
| Network (ENA) | NetworkIn/Out vs baseline |
driver queue drops | *_allowance_exceeded (ethtool -S) |
The second idea is the two views. AWS runs your guest OS on Nitro hardware; the hypervisor and the guest measure different things, and the console shows you the hypervisor’s version by default.
| Axis | Default EC2 (hypervisor) metric | What the guest actually sees | Can CloudWatch see it without the agent? | Classic failure this hides |
|---|---|---|---|---|
| CPU | CPUUtilization (% of core, 1–5 min avg) |
top per-core %us/%sy/%wa/%st, load average |
Partly — average only, no steal | Steal / burst-credit throttle, single-core saturation |
| Memory | (none at all) | free -m used/available, /proc/meminfo |
No | OOM kill, leak, swap thrash |
| Disk space | (none for EBS/guest FS) | df -h, df -i |
No | Full root, inode exhaustion |
| Disk I/O | EBSReadOps/WriteOps, VolumeQueueLength (EBS metrics) |
iostat await/%util |
Partly — ops/queue, no await |
EBS latency, BurstBalance drain |
| Network throughput | NetworkIn/Out, NetworkPacketsIn/Out |
ss, sar -n DEV, driver counters |
Partly — bytes/packets, no drops | ENA allowance drops |
| Network allowances | (none) | ethtool -S *_allowance_exceeded |
No | bw/pps/conntrack/linklocal shaping |
Read that table as the thesis of the whole article: four of the six rows are invisible to CloudWatch by default. The agent fills memory and disk-space; nothing but ethtool fills the ENA row. That is why the sweep always runs inside the guest, with the console graph beside it for context — never instead of it.
Which command / which metric, per resource — the master reference
Keep this table pinned. It is the “where do I even look” map; every later section expands one row of it.
| Resource | Guest command (authoritative) | What it shows | CloudWatch metric (namespace) | Agent needed? | “It’s the bottleneck” threshold |
|---|---|---|---|---|---|
| CPU total | top / mpstat 1 |
%us %sy %id %wa %st |
CPUUtilization (AWS/EC2) |
No | %id near 0, sustained |
| CPU per-core | mpstat -P ALL 1 |
one core pinned vs spread | — | — | one core 100%, others idle |
| CPU by process | pidstat 1 / top -o %CPU |
which PID burns CPU | — | — | one PID ≈ n×100% |
| Run queue / load | uptime, vmstat 1 (r col) |
threads waiting to run | — | — | load ≫ vCPU count |
| Burst credits | (none in guest) | — | CPUCreditBalance, CPUSurplusCreditBalance (AWS/EC2) |
No | CPUCreditBalance→0 |
| Memory used | free -m, cat /proc/meminfo |
used vs available | mem_used_percent (CWAgent) |
Yes | available near 0 |
| OOM event | dmesg -T, journalctl -k |
“Killed process” lines | (log, not metric) | — | any OOM line |
| Swap | free -m, vmstat 1 (si/so) |
swap in/out rate | swap_used_percent (CWAgent) |
Yes | steady si/so > 0 |
| Disk space | df -h |
% used per mount | disk_used_percent (CWAgent) |
Yes | mount at 100% |
| Inodes | df -i |
IUse% per mount | disk_inodes_free (CWAgent) |
Yes | IUse% at 100% |
| Disk latency | iostat -xz 1 |
await, %util, aqu-sz |
(no await metric) | — | await ≫ single-digit ms |
| EBS queue | iostat aqu-sz |
outstanding I/O | VolumeQueueLength (AWS/EBS) |
No | > 1 sustained |
| EBS burst | (none in guest) | — | BurstBalance (AWS/EBS, gp2/st1/sc1) |
No | →0% |
| Instance EBS cap | (none in guest) | — | EBSIOBalance%, EBSByteBalance% (AWS/EC2) |
No | →0% |
| Net bandwidth | sar -n DEV 1, iftop |
Mbps in/out | NetworkIn/Out (AWS/EC2) |
No | at instance baseline |
| Net allowances | ethtool -S eth0 |
*_allowance_exceeded |
(none) | — | counter rising |
Two things jump out. First, Requires agent is “Yes” for every memory and disk-space row — if you never installed the agent, those rows are dark. Second, the two most feared failures (OOM and ENA drops) have no CloudWatch metric at all — they live only in dmesg and ethtool. That is precisely why they blindside teams.
CPU: the axis everyone reads first (and misreads)
CPU is where everyone starts because it is the one default graph. It is also where the two-views trap bites hardest.
Load average is not CPU utilization
uptime and the top line of top show three load averages (1, 5, 15 minutes). On Linux, load counts threads that are running or runnable plus threads in uninterruptible sleep — and that last part is the gotcha: a process blocked on disk I/O (state D) inflates load without using any CPU. So a load of 16 on a 4-vCPU box can mean “CPU is four-times oversubscribed” or “four threads are wedged waiting on a slow EBS volume.” You cannot tell from load alone; you read the %wa (I/O wait) column next to it.
| Reading | Interpretation | Confirm next |
|---|---|---|
Load ≈ vCPU count, %id low, %wa low |
Healthy full CPU use | pidstat — is it the right process? |
Load ≫ vCPU count, %us+%sy high |
CPU-bound / oversubscribed | mpstat -P ALL — all cores or one? |
Load ≫ vCPU count, %wa high, %us low |
I/O-bound, not CPU | jump to the disk axis (iostat) |
Load high, %st > 0 |
Steal — burstable throttle or noisy neighbour | CPUCreditBalance |
| Load low but app slow | Not CPU — check memory/disk/net | continue the sweep |
The %CPU breakdown — read every column
top (press 1 for per-core) and mpstat 1 break CPU time into states. Each column points at a different cause.
| Column | Name | Means | High value points to |
|---|---|---|---|
%us |
user | app code in user space | your application / runtime is the load |
%sy |
system | kernel on the app’s behalf | syscalls, context switches, network stack |
%ni |
nice | re-niced user processes | low-priority batch work |
%wa |
iowait | idle waiting on disk I/O | EBS/instance-store bottleneck (go to disk axis) |
%hi/%si |
hard/soft IRQ | interrupt handling | very high packet rates, driver work |
%st |
steal | vCPU wanted to run, hypervisor ran someone else | burst-credit throttle or noisy neighbour |
%id |
idle | nothing to do | headroom; if ~0, CPU is saturated |
The single most useful reflex: if %wa is high, stop looking at CPU — the CPU is idle waiting, and your real problem is on the disk axis. And if %st is non-zero on a T-series instance, you are almost certainly out of credits (the next nasty).
The CPU toolbox
| Tool | One-line use | Why reach for it |
|---|---|---|
top / htop |
live overall + per-process | first look; htop shows per-core bars and is easier |
mpstat -P ALL 1 |
per-core utilization | catches single-core saturation the average hides |
pidstat 1 |
per-process CPU over time | names the offending PID without top’s noise |
pidstat -t 1 |
per-thread | finds the one hot thread in a multi-threaded app |
vmstat 1 |
run queue (r), context switches, si/so |
run-queue depth + swap in one view |
sar -u 1 / sar -u (historical) |
CPU now and from sysstat archive |
what happened at 03:00 after the fact |
perf top |
live function-level profile | which function burns the CPU (deep dive) |
Single-core saturation hidden by the average
CloudWatch CPUUtilization and top’s summary line both average across vCPUs. On an 8-vCPU box, one core pinned at 100% and seven idle reads as ~12.5% — and the graph looks calm while a single-threaded process (a legacy app, a Python GIL-bound worker, one hot Nginx worker) is the wall your latency is hitting. mpstat -P ALL 1 is the antidote: it prints each core, and you will see CPU 3 at 0.0 %idle while the rest sit at 100. The fix is architectural — parallelize the work, or move to a higher-clock family (C7i/C7a) rather than more idle cores.
The nasty one: CPU steal = burst-credit exhaustion
This is the failure that costs teams the most hours because the default graph actively misleads. On burstable T-family instances (t2/t3/t3a/t4g), you do not get the full core continuously — you get a baseline fraction, and you earn CPU credits while below baseline that you spend to burst above it. Run hot long enough and the credit bucket empties. What happens next depends on the credit mode:
- Standard mode: once
CPUCreditBalancehits 0, the instance is throttled to baseline. The guest experiences this as steal —%stclimbs, wall-clock throughput collapses, but%uslooks unremarkable because the hypervisor simply isn’t scheduling you. CloudWatchCPUUtilizationmay even drop (you’re being held down), which is the cruel part: the graph goes down as performance gets worse. - Unlimited mode (the default for T3/T3a/T4g; opt-in for T2): the instance keeps bursting past zero credits, borrowing surplus credits. If, over a rolling 24 h, it spends more surplus than it can earn back, AWS bills the surplus at ~US$0.05 per vCPU-hour (Linux). No throttle — but a silent bill, and
CPUSurplusCreditsChargedclimbing.
The confirm is a two-part fingerprint: top shows %st > 0 and CloudWatch CPUCreditBalance is at or near 0 (Standard) or CPUSurplusCreditsCharged > 0 (Unlimited). The burstable credit metrics are the only place this is visible.
| CloudWatch metric (AWS/EC2, burstable only) | Meaning | Alarm on |
|---|---|---|
CPUCreditUsage |
credits spent this interval | — |
CPUCreditBalance |
credits banked (the fuel gauge) | < threshold (e.g. < 20% of max) |
CPUSurplusCreditBalance |
surplus borrowed, not yet paid back | > 0 sustained |
CPUSurplusCreditsCharged |
surplus that got billed | > 0 (you’re paying) |
Baseline and earn rate scale with size — the smaller the box, the faster it starves:
| Size | vCPUs | Baseline % per vCPU | Credits earned / hr | Max banked credits |
|---|---|---|---|---|
| t3.nano | 2 | 5% | 6 | 144 |
| t3.micro | 2 | 10% | 12 | 288 |
| t3.small | 2 | 20% | 24 | 576 |
| t3.medium | 2 | 20% | 24 | 576 |
| t3.large | 2 | 30% | 36 | 864 |
| t3.xlarge | 4 | 40% | 96 | 2304 |
| t3.2xlarge | 8 | 40% | 192 | 4608 |
(t4g Graviton mirrors these baselines; t2 differs and defaults to Standard, not Unlimited.) The decision is simple: spiky workloads (a web tier that idles then bursts) suit T-Unlimited; steady workloads that would sit above baseline all day are cheaper and more predictable on a fixed-performance M or C — because a T3 pinned at 100% in Unlimited quietly out-costs the M it should have been.
| Standard | Unlimited | |
|---|---|---|
| At 0 credits | throttled to baseline (steal) | keeps bursting |
| Extra cost | none | surplus billed ~$0.05/vCPU-hr |
| Default on | T2 | T3 / T3a / T4g |
| Best for | dev/idle, cost-capped | spiky prod that must not throttle |
| Failure signature | %st up, CPUCreditBalance=0 |
bill up, CPUSurplusCreditsCharged>0 |
| Set via CLI | modify-instance-credit-specification |
same, CpuCredits=unlimited |
Memory: the axis with no metric
Here is the fact that surprises every engineer new to AWS: EC2 publishes no memory metric. Not MemoryUtilization, not mem_free — nothing. The hypervisor allocates RAM to your instance but cannot see inside the guest to know how much is used (that would require reading guest page tables it deliberately doesn’t touch). So on the console, memory is a black box until you install the CloudWatch agent, which reads /proc/meminfo from inside and publishes mem_used_percent, mem_available_percent, and friends to the CWAgent namespace. These are the guest-side metrics the agent gives you (and what to alarm on):
Agent metric (CWAgent namespace) |
Category | Means | Alarm on |
|---|---|---|---|
mem_used_percent |
mem | RAM actively used (excl. reclaimable cache) | context / dashboards |
mem_available_percent |
mem | % allocatable without swapping | low (e.g. < 10%) |
swap_used_percent |
swap | swap space in use | > 0 sustained = pressure |
disk_used_percent |
disk | filesystem space used per mount | ≥ 85% |
disk_inodes_free |
disk | free inodes per mount | low / →0 |
diskio_io_time |
diskio | ms per second the device did I/O | high = busy device |
Reading memory correctly: available, not free
free -m is where you look — but its columns trip people constantly.
| Column | Means | Do you care? |
|---|---|---|
total |
RAM the guest sees | context |
used |
actively used (excludes buff/cache in modern free) |
somewhat |
free |
completely unused — usually small and that’s healthy | no — this is the trap |
shared |
tmpfs / shared memory | sometimes |
buff/cache |
kernel page cache + buffers (reclaimable) | it’s good, not used-up |
available |
RAM available for new apps without swapping | YES — this is the number |
Linux uses all spare RAM as page cache, so free is supposed to be near zero on a busy box — that is the OS doing its job, not a leak. The number that matters is available: when available trends toward zero, you are actually out of memory. Alarming on used or free produces false alarms; alarm on mem_available_percent (or available bytes). This “memory looks full but the app is fine” confusion is one of the most common false incidents in the corpus.
| Tool | Shows | Use when |
|---|---|---|
free -m / free -h |
the table above | first look |
cat /proc/meminfo |
every kernel memory field | need Committed_AS, Slab, Dirty |
vmstat 1 |
free, buff, cache, si, so |
watch swap in/out live |
ps aux --sort=-rss |
processes by resident memory | find the memory hog |
top (press M) |
sort by memory | quick hog hunt |
smem -rs rss |
proportional set size (PSS) | shared-memory-heavy apps (avoid double-count) |
pmap -x <pid> |
a process’s memory map | is it heap, mmap, or a file? |
The nasty one: the OOM you cannot see
When available truly hits zero and the kernel cannot reclaim, it invokes the Out-Of-Memory (OOM) killer: it scores every process (oom_score, tunable via oom_score_adj) and kills the one with the worst score-to-free-most-memory, usually your biggest app — the JVM, the Node worker, Postgres. To the application, this is indistinguishable from a crash: the process is simply gone, with no stack trace, no application error. And because there’s no memory metric, CloudWatch shows absolutely nothing at the moment of death. Teams burn hours hunting an “app crash” that is really the kernel doing triage.
The confirm is always the same, and it is the first thing to run when a process vanishes:
# Amazon Linux / RHEL — kernel ring buffer (survives until reboot)
sudo dmesg -T | grep -i -E 'killed process|out of memory|oom-kill'
# systemd journal (survives reboots if persistent)
sudo journalctl -k | grep -i 'out of memory'
# distro log files
sudo grep -i 'killed process' /var/log/messages     # Amazon Linux / RHEL
sudo grep -i 'killed process' /var/log/syslog        # Ubuntu / Debian
You are looking for the smoking-gun line:
Out of memory: Killed process 4821 (java) total-vm:9812340kB, anon-rss:7710028kB, ...
That names the victim (java), the time (with -T), and how much it held. Under cgroup v2 (containers, systemd slices) you may instead see a memory.max-scoped OOM that kills only the cgroup — check systemctl status <unit> for Result: oom-kill and journalctl -u <unit>.
| Evidence source | Command | What it proves |
|---|---|---|
| Kernel ring buffer | dmesg -T | grep -i oom |
global OOM kill + victim + size |
| systemd journal | journalctl -k / -u <unit> |
OOM across reboots / per-service (cgroup) |
| Per-process score | cat /proc/<pid>/oom_score |
who the kernel will kill next |
| Protect a process | echo -1000 > /proc/<pid>/oom_score_adj |
make sshd/agent un-killable |
| Agent metric | mem_used_percent (CWAgent) |
the run-up before the kill |
The fixes, in order of preference: right-size the RAM (move to an R-family or a larger size — measure with the agent first), cap the hog (JVM -Xmx, container --memory, cgroup memory.max) so it fails gracefully instead of taking the box down, and add swap as a shock absorber (below) — but swap masks, it does not cure.
Swap and swappiness
Most EC2 AMIs ship with no swap. Adding a swap file gives the kernel somewhere to page cold memory instead of OOM-killing — useful as a safety margin, dangerous if you actually run in swap (thrashing: constant si/so in vmstat, latency through the floor). vm.swappiness (default 60) tunes eagerness; on a server, 10 keeps swap as a last resort.
| Setting | Default | Meaning | Change when |
|---|---|---|---|
| swap present | none (most AMIs) | no paging device | want an OOM shock absorber |
vm.swappiness |
60 | how eagerly to swap | lower to 1–10 on latency-sensitive servers |
vm.overcommit_memory |
0 (heuristic) | allow malloc past RAM |
2 + ratio to refuse overcommit (fail fast) |
vm.min_free_kbytes |
auto | reserved free floor | raise on bursty allocators |
si/so in vmstat |
~0 healthy | swap-in / swap-out rate | steady non-zero = thrashing, add RAM |
Disk: space, inodes, and EBS throughput
The disk axis hides three completely different failures behind two similar-looking symptoms (“disk full” and “disk slow”). Split them cleanly.
Full root — and the same error from two causes
df -h shows space per mount. A root filesystem at 100% throws ENOSPC — No space left on device — on every write, which cascades into weird secondary failures: databases refuse writes, logs stop, apt/dnf breaks, the app can’t create a temp file and 500s. The usual culprit is unrotated logs, a runaway core dump, or Docker’s /var/lib/docker.
But the exact same No space left on device fires when you are out of inodes, not bytes — and then df -h shows free space, which sends people down a rabbit hole. Always check both.
| Command | Answers | Failure it reveals |
|---|---|---|
df -h |
bytes free per mount | full disk (ENOSPC by space) |
df -i |
inodes free per mount (IUse%) | inode exhaustion (ENOSPC by inode) |
du -xhd1 / |
space by top-level dir (one FS) | where the space went |
ncdu -x / |
interactive space explorer | fast drill-down to the fat directory |
find / -xdev -size +200M |
files over 200 MB | the one huge file |
find / -xdev -type f | wc -l |
file count (inode pressure) | millions of tiny files |
lsof +L1 |
open files with link-count 0 | deleted-but-open space |
Inode exhaustion
Every file consumes one inode, and a filesystem has a fixed number set at creation (mkfs). Workloads that create millions of tiny files — mail spools, session files, a runaway /tmp, npm’s node_modules, unrotated per-request logs — can exhaust inodes while gigabytes of space sit free. df -i shows IUse% at 100%. The fix is to delete the small files (find the directory with the count, not the size) or, if the workload genuinely needs that many, recreate the filesystem with more inodes (mkfs.ext4 -N <count> or -i <bytes-per-inode>) or move that data to a different store (S3, EFS).
The space that du cannot find: deleted-but-open files
The classic head-scratcher: df -h says the disk is full, but du -x / adds up to far less. The space is held by a deleted file that a process still has open — the directory entry is gone (so du can’t see it) but the inode and its blocks aren’t freed until the last file descriptor closes. A daemon logging to a file that was rm-ed by a botched logrotate is the textbook case. Find it with lsof +L1 (or lsof | grep deleted), which lists open files with zero links, and free it by restarting (or truncate-ing via /proc/<pid>/fd/<n>) the holding process.
The other nasty: EBS saturation — slow, not full
A disk that is slow rather than full is an EBS throughput problem, and it masquerades as “the app is slow” with low CPU. The guest tell is iostat -xz 1.
iostat -x field |
Means | Bottleneck signal |
|---|---|---|
%util |
% of time the device had I/O in flight | ~100% = device busy (but see note) |
await |
avg ms per I/O including queue time | tens of ms on EBS = trouble (gp3 ≈ single-digit ms healthy) |
r_await / w_await |
read / write latency split | which direction hurts |
aqu-sz (avgqu-sz) |
avg outstanding I/O (queue depth) | > 1 sustained = queuing |
r/s w/s |
IOPS | compare to volume’s provisioned IOPS |
rkB/s wkB/s |
throughput | compare to volume’s MB/s ceiling |
(Note: on modern multi-queue NVMe, %util can read 100% while the device still has headroom — trust await and aqu-sz over %util for EBS.) When await is high and aqu-sz > 1, you are I/O-bound. Now cross-check the AWS side: whether it’s the volume or the instance that’s the cap.
EBS volume types set the baseline you’re hitting:
| Type | Baseline | Burst | Max IOPS | Max throughput | Burst metric |
|---|---|---|---|---|---|
| gp3 (SSD) | 3,000 IOPS + 125 MB/s free, size-independent | (no burst — you hit the provisioned ceiling) | 16,000 | 1,000 MB/s | — (provision more) |
| gp2 (SSD) | 3 IOPS/GiB (min 100) | to 3,000 IOPS via BurstBalance (vols < 1 TiB) | 16,000 (at ~5.3 TiB) | 250 MB/s | BurstBalance |
| io2 / io1 | provisioned IOPS | — | 64,000 (io2 Block Express 256,000) | 1,000–4,000 MB/s | — |
| st1 (HDD) | 40 MB/s per TiB | to 250 MB/s per TiB | 500 IOPS | 500 MB/s | BurstBalance |
| sc1 (HDD) | 12 MB/s per TiB | to 80 MB/s per TiB | 250 IOPS | 250 MB/s | BurstBalance |
The two EBS traps:
- gp2
BurstBalancedrain. A small gp2 volume (say 20 GiB) has a baseline of just 100 IOPS but bursts to 3,000 by spending a credit bucket. Under sustained load the bucket empties,BurstBalancefalls to 0%, and IOPS collapse to 100 — the app was fast for ten minutes then fell off a cliff. Confirm with theBurstBalancemetric hitting 0. Fix: switch to gp3 (flat 3,000 IOPS, no burst game, and ~20% cheaper), or grow the gp2 for a higher baseline, or provision IOPS. - gp3 under-provisioning. gp3 has no burst — you get exactly what you provisioned (3,000 IOPS / 125 MB/s by default). If your workload needs 8,000 IOPS and you never raised it, you hit a hard wall with no BurstBalance to warn you. Confirm:
r/s+w/spinned at ~3,000. Fix:modify-volumeto raise IOPS/throughput (online, no downtime).
EBS CloudWatch metrics (the AWS-side confirm — AWS/EBS namespace unless noted):
| Metric | Namespace | Tells you |
|---|---|---|
VolumeQueueLength |
AWS/EBS | outstanding I/O — > 1 sustained = saturated |
VolumeReadOps / VolumeWriteOps |
AWS/EBS | IOPS (÷ period) vs provisioned |
VolumeThroughputPercentage |
AWS/EBS | % of provisioned IOPS used (io1/io2) |
BurstBalance |
AWS/EBS | gp2/st1/sc1 burst bucket % — →0 is the drain |
VolumeTotalReadTime / WriteTime |
AWS/EBS | latency contribution |
EBSIOBalance% |
AWS/EC2 | instance IOPS burst (smaller instances) — →0 = instance is the cap |
EBSByteBalance% |
AWS/EC2 | instance throughput burst — →0 = instance-capped |
That last pair matters: even a fat gp3 can be throttled if the instance is small, because each instance size has its own EBS bandwidth/IOPS ceiling. If EBSIOBalance% or EBSByteBalance% heads to 0 while the volume has headroom, the fix is a bigger instance, not a bigger volume.
Network: the ENA allowances nobody knows about
The network axis is where senior engineers separate from the pack, because the failure is invisible to every AWS metric and every Flow Log — it lives only in the ENA driver’s counters. Modern instances use the Elastic Network Adapter (ENA), and the Nitro system enforces per-instance allowances: caps on bandwidth, packets-per-second, tracked connections, and traffic to link-local services. Exceed one and the system shapes (queues then drops) your packets — and increments a counter you can only see with ethtool -S.
Baseline vs burst bandwidth by size
Instance network performance is published as a number like “Up to 10 Gigabit” or “10 Gigabit”. The words matter:
| Published spec | Meaning | Sustained? |
|---|---|---|
| “Up to 10 Gigabit” | burstable network — a baseline you can exceed for limited periods (like CPU credits, but for the NIC) | No — drops to baseline after the burst window |
| “10 Gigabit” (no “up to”) | that bandwidth is sustained | Yes |
| “…100 Gigabit” | needs ENA + often placement groups / EFA | Yes, at scale |
A few representative published specs make the “up to” distinction concrete:
| Instance | Published network spec | Burstable? | Fits |
|---|---|---|---|
| t3.micro | Up to 5 Gigabit | Yes (low baseline) | spiky web / dev |
| m5.large | Up to 10 Gigabit | Yes | general, bursty |
| m5.8xlarge | 10 Gigabit | No — sustained | steady general |
| c5n.large | Up to 25 Gigabit | Yes | network-tuned small |
| c5n.18xlarge | 100 Gigabit | No — sustained | HPC / high-throughput |
| m7g.16xlarge | 30 Gigabit | No — sustained | large Graviton general |
Smaller instances (most T3, small M/C) have “up to” bandwidth with a low baseline — fine for spiky traffic, a wall for sustained transfer (a backup job, a data load). The only lever to raise the baseline is a bigger instance; you cannot buy network allowance separately.
The allowance counters — the ENA table you keep
Run ethtool -S eth0 (or ens5 — check ip -br link) and look at the *_allowance_exceeded counters. Any of them rising over time is a smoking gun; they are cumulative since boot, so watch the delta.
ethtool -S counter |
Fires when you exceed… | Symptom you see | Fix |
|---|---|---|---|
bw_in_allowance_exceeded |
inbound aggregate bandwidth baseline | slow downloads, ingest lag, RX drops | bigger instance; spread ingest; enable jumbo frames |
bw_out_allowance_exceeded |
outbound aggregate bandwidth baseline | slow uploads/replication, TX stalls | bigger instance; compress; spread egress across ENIs/instances |
pps_allowance_exceeded |
packets-per-second limit (regardless of size) | tiny-packet workloads stall (DNS floods, RTP, memcached) | bigger instance; batch/coalesce packets; jumbo frames |
conntrack_allowance_exceeded |
tracked connections max for the instance | new connections hang/fail while established ones are fine | fewer concurrent conns; untracked SG rules; bigger instance |
linklocal_allowance_exceeded |
PPS to link-local services (DNS .2, IMDS 169.254.169.254, NTP) |
intermittent DNS/IMDS/NTP timeouts | cache DNS locally; cache IMDS; back off metadata polling |
conntrack_allowance_available |
(newer drivers) remaining conntrack headroom | proactive — how close you are | watch it approach 0 |
Baseline ethtool -S eth0 | grep -E 'allowance_exceeded|drops' on a healthy box is all zeros. During an incident, run it twice a minute apart; a counter that moved is your cause.
The third nasty: conntrack allowance drops
This one is genuinely evil because “established connections work, new ones don’t” points suspicion everywhere except the real cause. Security groups are stateful, which means the Nitro system tracks every connection in a per-instance connection-tracking table so it can allow return traffic. That table has a finite size that scales with instance size. A box that opens huge numbers of simultaneous connections — a busy reverse proxy, a connection-storm from a retry loop, a load test, a NAT-like pattern — can fill the conntrack table. When it’s full, new connections are dropped (conntrack_allowance_exceeded climbs) while existing ones keep flowing. Symptoms: new client connections time out under load, health checks flap, the app “works but can’t take more traffic,” and nothing in CPU/memory/disk explains it.
Confirm: ethtool -S eth0 | grep conntrack_allowance_exceeded rising. Fixes, in order: reduce concurrent tracked connections (connection pooling, keep-alive reuse, shorter timeouts so dead conns clear); use untracked security-group rules where possible — a rule that allows all traffic (all ports, 0.0.0.0/0) in a direction can be exempt from connection tracking, so certain flows stop consuming table entries (this is a real, deliberate lever, though it trades granularity for scale); and finally move to a larger instance, which has a bigger conntrack allowance. There is no way to raise the table size without changing instance size.
Likewise, linklocal_allowance_exceeded bites apps that hammer link-local endpoints — an SDK that reads IMDS on every request instead of caching credentials, a chatty DNS pattern with no local cache, aggressive NTP. The link-local PPS allowance is small and shared across DNS/IMDS/NTP; blow through it and you get intermittent DNS resolution failures and credential fetch timeouts that look like flaky networking. Fix: run a local DNS cache (systemd-resolved, dnsmasq, or nscd), cache IMDS responses / use the SDK’s credential cache, and back off any per-request metadata polling.
The network toolbox
| Tool | Shows | Use when |
|---|---|---|
ethtool -S eth0 |
ENA allowance + drop counters | first for any “network weird” symptom |
ip -s link / ip -br link |
interface errors, drops, device name | quick error counts + find ethN/ensN |
ss -s / ss -tan state estab | wc -l |
socket summary / live connection count | conntrack pressure, port exhaustion |
sar -n DEV 1 |
per-interface Mbps + pps | live throughput vs baseline |
iftop / nethogs |
bandwidth by connection / process | who is using the pipe |
mtr <host> |
per-hop loss & latency | is loss local (ENA) or in the path? |
tcpdump -ni eth0 |
packet capture | last-resort, prove what’s on the wire |
Architecture at a glance
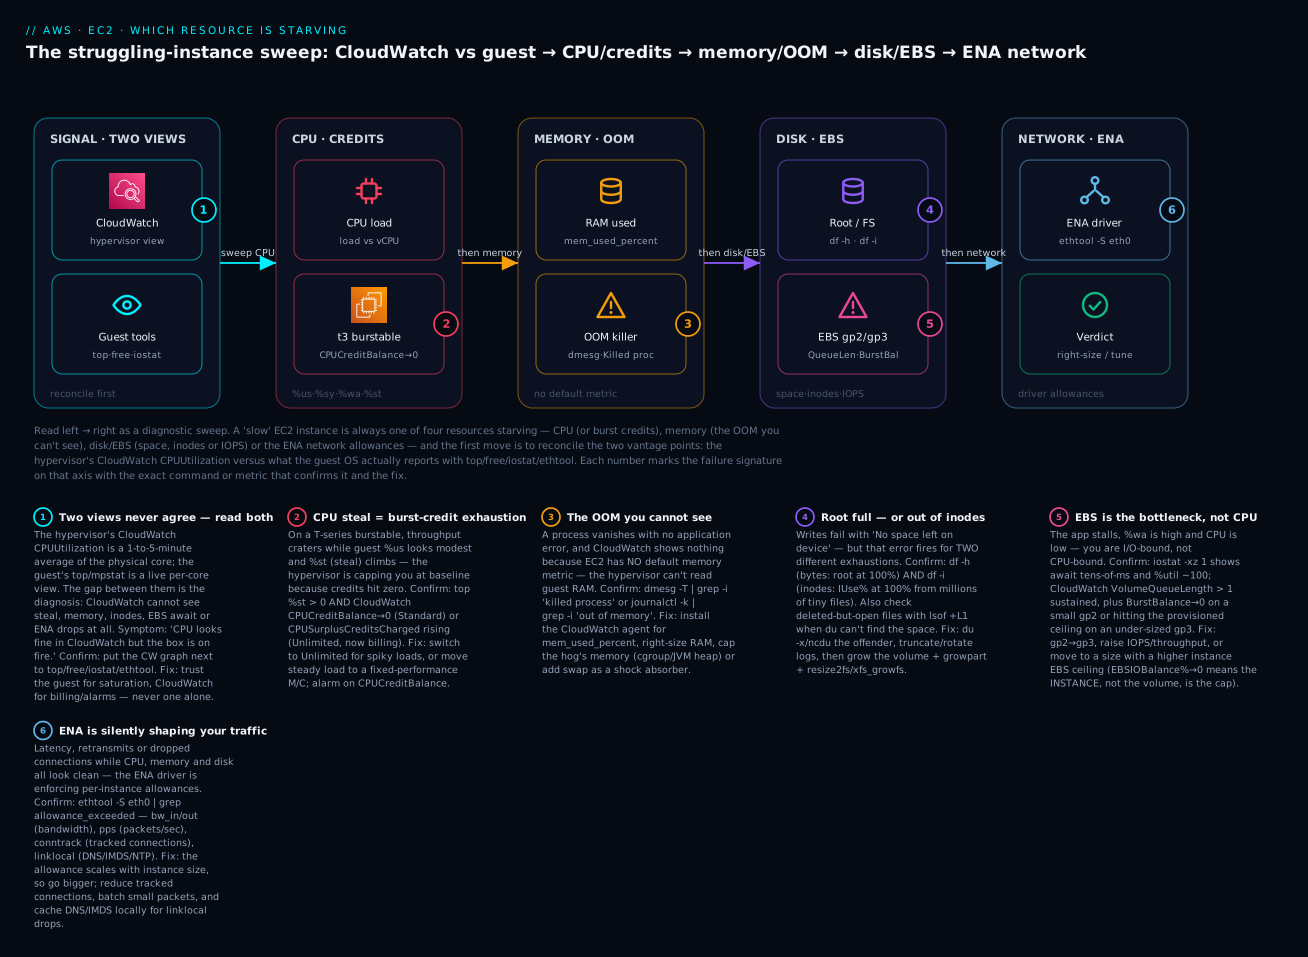
The diagram is the sweep itself, drawn left to right as a diagnostic path across the four resource axes of one instance. It opens with the two views you must reconcile — CloudWatch’s hypervisor CPUUtilization beside the guest’s top/free/iostat/ethtool (badge 1) — then walks each axis in order: CPU/credits, where steal on a burstable outs credit exhaustion (badge 2); memory/OOM, the axis with no default metric where the OOM killer strikes invisibly (badge 3); disk/EBS, split into the full-root/inode failure (badge 4) and the EBS BurstBalance/VolumeQueueLength saturation (badge 5); and network/ENA, where the ethtool -S allowance counters expose bandwidth, PPS, conntrack and link-local drops (badge 6). Each badge marks the exact failure signature on that hop, and the legend narrates every number as symptom · how to confirm · fix — so the picture doubles as the incident checklist.
Real-world scenario
PaySaral, a mid-size Indian payments startup, ran its authorization API on a fleet of t3.large instances behind an ALB — chosen months earlier when traffic was spiky and burstable looked cheap. As volume grew, the API developed a maddening pattern: every weekday from about 11:00, p99 latency climbed from 40 ms to 900 ms for roughly twenty minutes, then recovered. The on-call reflex — check CloudWatch CPUUtilization — showed a reassuring picture: CPU sat around 45%, occasionally dipping during the bad window. Two engineers spent a sprint chasing the database and the ALB, finding nothing.
The break came when a new SRE ran the four-axis sweep inside the box during a bad window instead of trusting the console. top told the story in one screen: %us was modest, but %st (steal) sat at 35% — the instance was being throttled. She pulled the burstable credit metric: aws cloudwatch get-metric-statistics ... --metric-name CPUCreditBalance showed the balance draining to zero at 11:00 every day and refilling overnight. The t3.large’s baseline is 30% per vCPU; the morning batch of settlement jobs pushed sustained CPU above baseline, the credit bucket emptied in ~20 minutes, and Standard credit mode threw the instances into baseline throttle — which is exactly why CloudWatch CPUUtilization dropped (the hypervisor was holding them down) while latency exploded. The default graph hadn’t just failed to help; it had actively pointed the wrong way.
The fix was a two-parter. Immediate: flip the fleet to Unlimited credit mode (modify-instance-credit-specification --instance-credit-specification "InstanceId=i-...,CpuCredits=unlimited") so the morning burst stopped throttling — latency normalised the next day. But the CloudWatch bill for CPUSurplusCreditsCharged then made the real problem obvious: these instances ran above baseline for hours daily, so they were the textbook case for fixed-performance compute, not burstable. They migrated to c7g.large (Graviton, compute-optimized, no credit game), which cost slightly less than a t3.large in permanent-Unlimited and delivered flat latency. The lasting change was cultural: PaySaral added a CPUCreditBalance < 20% alarm to every burstable instance and a runbook line — “if CloudWatch CPU looks calm but the box is slow, SSH in and read %st first.” Total resolution once someone looked at the guest: under an hour, after two weeks of chasing ghosts in the wrong view.
Advantages and disadvantages
The strategic choice underneath all of this is how deeply you instrument — stay with the free hypervisor metrics, or install the CloudWatch agent and build the guest-side muscle memory. Here is the honest trade-off.
| Advantages of deep guest instrumentation | Disadvantages / costs |
|---|---|
| Memory, disk-space, inodes and swap become visible (agent) — the four dark rows light up | The agent is a package to install, configure, patch and monitor on every instance |
Steal, OOM, await and ENA drops are diagnosable in minutes, not sprints |
Custom CloudWatch metrics cost ~$0.30/metric/month beyond the free tier — multiplied across a fleet |
Alarms on the right signals (CPUCreditBalance, mem_available_percent, BurstBalance) prevent 3 a.m. surprises |
More metrics = more alarms = more tuning to avoid alert fatigue |
| Root-cause fixes (gp2→gp3, right-size RAM, Unlimited vs C-family) instead of blind resizes | Requires the team to learn top/iostat/ethtool — a real skills investment |
| Works uniformly via SSM without opening SSH — smaller attack surface | Agent needs an IAM role + config management; drift if not enforced by Terraform/SSM |
The resolution isn’t all-or-nothing. Always install the agent for mem_used_percent and disk_used_percent — those two dark rows cause the most painful surprises for the least cost. Add ENA-counter checks to your incident runbook rather than as metrics (they’re free via ethtool, and rising counters are episodic). And reserve the deepest instrumentation (per-thread profiling, perf) for the workloads whose latency actually pays the bills.
Hands-on lab
You will launch a burstable instance with an IAM role (SSM + CloudWatch agent), install the agent for memory and disk metrics, drive CPU and memory with stress-ng, watch credits drain and an OOM kill, drain a small gp2’s BurstBalance, and read the ENA allowance counters — all via aws CLI, SSM, and Terraform. Then tear it down. The lab at a glance:
| Lab step | Driver command | Axis exercised | Signal to watch |
|---|---|---|---|
| CPU burn | stress-ng --cpu 2 |
CPU / credits | top %st↑, CPUCreditBalance→0 |
| Memory pressure | stress-ng --vm 1 --vm-bytes 2G |
Memory / OOM | dmesg OOM line, mem_used_percent↑ |
| EBS saturation | fio --rw=randwrite … |
Disk / EBS | iostat await↑, BurstBalance→0 |
| Network counters | ethtool -S eth0 |
Network / ENA | *_allowance_exceeded delta |
⚠️ Costs money if left running: the instance (t3.micro is free-tier-eligible, 750 h/month for 12 months), the extra 10 GiB gp2 volume (~$0.10/GB-month ≈ $1/month), CloudWatch custom metrics (~$0.30 each beyond the free tier), and — if you flip to Unlimited and pin CPU — surplus credit charges. Do the teardown.
Step 1 — Provision with Terraform (instance, role, extra gp2, alarms)
Save as ec2-diag.tf. It creates an IAM role with the two managed policies, an instance, an extra small gp2 volume (to drain BurstBalance), and four alarms.
provider "aws" { region = "ap-south-1" }

data "aws_ami" "al2023" {
  most_recent = true
  owners      = ["amazon"]
  filter { name = "name"   values = ["al2023-ami-*-x86_64"] }
  filter { name = "state"  values = ["available"] }
}

# --- IAM: SSM + CloudWatch agent, no SSH keys needed ---
resource "aws_iam_role" "diag" {
  name = "ec2-diag-role"
  assume_role_policy = jsonencode({
    Version = "2012-10-17"
    Statement = [{ Effect = "Allow", Principal = { Service = "ec2.amazonaws.com" }, Action = "sts:AssumeRole" }]
  })
}
resource "aws_iam_role_policy_attachment" "ssm" {
  role       = aws_iam_role.diag.name
  policy_arn = "arn:aws:iam::aws:policy/AmazonSSMManagedInstanceCore"
}
resource "aws_iam_role_policy_attachment" "cwagent" {
  role       = aws_iam_role.diag.name
  policy_arn = "arn:aws:iam::aws:policy/CloudWatchAgentServerPolicy"
}
resource "aws_iam_instance_profile" "diag" {
  name = "ec2-diag-profile"
  role = aws_iam_role.diag.name
}

# --- CloudWatch agent config in SSM Parameter Store ---
resource "aws_ssm_parameter" "cwagent" {
  name = "AmazonCloudWatch-linux"
  type = "String"
  value = jsonencode({
    agent   = { metrics_collection_interval = 60, run_as_user = "cwagent" }
    metrics = {
      namespace          = "CWAgent"
      append_dimensions  = { InstanceId = "$${aws:InstanceId}" }
      metrics_collected  = {
        mem    = { measurement = ["mem_used_percent", "mem_available_percent"] }
        swap   = { measurement = ["swap_used_percent"] }
        disk   = { measurement = ["used_percent", "inodes_free"], resources = ["/"] }
        diskio = { measurement = ["io_time", "read_bytes", "write_bytes"], resources = ["*"] }
      }
    }
  })
}

# --- The instance (burstable, so we can drain credits) ---
resource "aws_instance" "diag" {
  ami                    = data.aws_ami.al2023.id
  instance_type          = "t3.micro"
  iam_instance_profile   = aws_iam_instance_profile.diag.name
  credit_specification { cpu_credits = "standard" }   # Standard so credits THROTTLE, to see steal
  user_data = <<-EOF
    #!/bin/bash
    dnf install -y amazon-cloudwatch-agent stress-ng fio
    /opt/aws/amazon-cloudwatch-agent/bin/amazon-cloudwatch-agent-ctl \
      -a fetch-config -m ec2 -c ssm:AmazonCloudWatch-linux -s
  EOF
  tags = { Name = "ec2-diag-lab" }
}

# --- Extra small gp2 to drain BurstBalance (100 IOPS baseline) ---
resource "aws_ebs_volume" "burst" {
  availability_zone = aws_instance.diag.availability_zone
  size              = 10
  type              = "gp2"
  tags = { Name = "ec2-diag-burst-gp2" }
}
resource "aws_volume_attachment" "burst" {
  device_name = "/dev/sdf"
  volume_id   = aws_ebs_volume.burst.id
  instance_id = aws_instance.diag.id
}

# --- Alarms on the signals that matter ---
resource "aws_cloudwatch_metric_alarm" "credits" {
  alarm_name          = "ec2-diag-low-credits"
  namespace           = "AWS/EC2"
  metric_name         = "CPUCreditBalance"
  dimensions          = { InstanceId = aws_instance.diag.id }
  statistic           = "Minimum"
  period              = 300
  evaluation_periods  = 1
  threshold           = 20
  comparison_operator = "LessThanThreshold"
}
resource "aws_cloudwatch_metric_alarm" "burst" {
  alarm_name          = "ec2-diag-low-burstbalance"
  namespace           = "AWS/EBS"
  metric_name         = "BurstBalance"
  dimensions          = { VolumeId = aws_ebs_volume.burst.id }
  statistic           = "Minimum"
  period              = 300
  evaluation_periods  = 1
  threshold           = 20
  comparison_operator = "LessThanThreshold"
}
resource "aws_cloudwatch_metric_alarm" "mem" {
  alarm_name          = "ec2-diag-high-mem"
  namespace           = "CWAgent"
  metric_name         = "mem_used_percent"
  dimensions          = { InstanceId = aws_instance.diag.id }
  statistic           = "Average"
  period              = 60
  evaluation_periods  = 2
  threshold           = 90
  comparison_operator = "GreaterThanThreshold"
}
terraform init && terraform apply -auto-approve
INSTANCE_ID=$(terraform output -raw 2>/dev/null || aws ec2 describe-instances \
  --filters Name=tag:Name,Values=ec2-diag-lab Name=instance-state-name,Values=running \
  --query 'Reservations[0].Instances[0].InstanceId' --output text)
echo "Instance: $INSTANCE_ID"
Step 2 — Connect with SSM (no SSH key, no open port 22)
aws ssm start-session --target "$INSTANCE_ID"
# expected: a shell prompt on the instance, e.g. sh-5.2$
Confirm the agent is running:
sudo /opt/aws/amazon-cloudwatch-agent/bin/amazon-cloudwatch-agent-ctl -a status
# expected: "status": "running"
Step 3 — Drive CPU and watch steal + credit drain
# in the SSM session: pin both vCPUs for 15 minutes
stress-ng --cpu 2 --timeout 900s &
top -b -n1 | head -5      # watch %st climb once credits run out (Standard mode)
From your workstation, watch the credit balance fall:
aws cloudwatch get-metric-statistics \
  --namespace AWS/EC2 --metric-name CPUCreditBalance \
  --dimensions Name=InstanceId,Value=$INSTANCE_ID \
  --start-time "$(date -u -v-30M +%FT%TZ 2>/dev/null || date -u -d '30 min ago' +%FT%TZ)" \
  --end-time   "$(date -u +%FT%TZ)" \
  --period 300 --statistics Minimum --output table
# expected: Minimum column falling toward 0; once there, top shows %st > 0
Step 4 — Drive memory to an OOM and read it back
# request far more RAM than a t3.micro's 1 GiB → the OOM killer fires
stress-ng --vm 1 --vm-bytes 2G --vm-keep --timeout 60s
# stress-ng reports a worker killed; now prove it was the kernel:
sudo dmesg -T | grep -i -E 'killed process|out of memory'
# expected: "Out of memory: Killed process <pid> (stress-ng-vm) ... anon-rss:...kB"
free -m   # note: 'available' near 0 during the run; check mem_used_percent in CloudWatch
Step 5 — Drain the gp2 BurstBalance and see EBS latency
# format + mount the extra volume (device may be /dev/nvme1n1 on Nitro)
DEV=$(lsblk -dpno NAME | grep -v nvme0 | head -1)
sudo mkfs.xfs -f "$DEV" && sudo mkdir -p /mnt/burst && sudo mount "$DEV" /mnt/burst
# hammer it with random I/O to burn the burst bucket
sudo fio --name=drain --filename=/mnt/burst/f --size=2G --rw=randwrite \
  --bs=16k --iodepth=32 --numjobs=2 --time_based --runtime=1200 --direct=1 &
iostat -xz 1 3     # watch await climb and aqu-sz > 1 as burst empties
From your workstation:
VOL_ID=$(aws ec2 describe-volumes --filters Name=tag:Name,Values=ec2-diag-burst-gp2 \
  --query 'Volumes[0].VolumeId' --output text)
aws cloudwatch get-metric-statistics \
  --namespace AWS/EBS --metric-name BurstBalance \
  --dimensions Name=VolumeId,Value=$VOL_ID \
  --start-time "$(date -u -v-30M +%FT%TZ 2>/dev/null || date -u -d '30 min ago' +%FT%TZ)" \
  --end-time "$(date -u +%FT%TZ)" --period 300 --statistics Minimum --output table
# expected: BurstBalance Minimum falling toward 0; iostat await rises as it does
Step 6 — Read the ENA allowance counters
# baseline (healthy = zeros); IFACE is usually eth0 or ens5
IFACE=$(ip -br link | awk '$1!="lo"{print $1; exit}')
ethtool -S "$IFACE" | grep -E 'allowance_exceeded|_drops'
# example output on a healthy box:
#   bw_in_allowance_exceeded: 0
#   bw_out_allowance_exceeded: 0
#   pps_allowance_exceeded: 0
#   conntrack_allowance_exceeded: 0
#   linklocal_allowance_exceeded: 0
Run it, note the values, generate traffic (e.g. a large curl/aws s3 cp or many parallel connections), and run it again — a counter that moved would be your network cause. On a t3.micro you likely won’t breach a bandwidth allowance, but you’ve learned exactly where the signal lives.
You can also drive these remotely without a session, via Run Command:
aws ssm send-command --document-name "AWS-RunShellScript" \
  --targets "Key=InstanceIds,Values=$INSTANCE_ID" \
  --parameters 'commands=["ethtool -S $(ip -br link | awk \x27$1!=\"lo\"{print $1;exit}\x27) | grep allowance","dmesg -T | grep -i oom | tail","df -h /","df -i /"]' \
  --query 'Command.CommandId' --output text
# then: aws ssm get-command-invocation --command-id <id> --instance-id $INSTANCE_ID
Step 7 — Teardown
terraform destroy -auto-approve
# also delete the SSM parameter if not managed by TF, and confirm the extra volume is gone:
aws ec2 describe-volumes --filters Name=tag:Name,Values=ec2-diag-burst-gp2 \
  --query 'Volumes[].State' --output text     # expected: empty
Custom CloudWatch metrics stop incurring cost once no data is published (they age out of the console in ~15 months). The alarms are destroyed with the stack.
Common mistakes & troubleshooting
This is the heart of the article: the master sweep table, an error-signature reference, a fast triage table, and deep notes on the three failures that cost the most time.
The master playbook — symptom → resource → confirm → fix
Keep this open during an incident. It runs the four axes in the order the sweep does.
| # | Symptom | Likely resource | Confirm (exact command / metric) | Fix |
|---|---|---|---|---|
| 1 | Load ≫ vCPU count, app slow, %wa high |
Disk I/O (not CPU) | top %wa high + iostat -xz 1 await↑ |
move to gp3 / raise IOPS; the CPU is waiting |
| 2 | CPU pinned, %us ~100 sustained |
CPU (app-bound) | pidstat 1, top -H for hot thread |
profile/optimize; scale to C-family / bigger |
| 3 | App slow, low guest %CPU, %st > 0 |
CPU credits (steal) | top %st>0 and CPUCreditBalance→0 |
Unlimited mode, or move to fixed M/C |
| 4 | One core 100%, average looks calm | CPU (single-thread) | mpstat -P ALL 1 shows one core pinned |
parallelize; higher-clock family (C7i) |
| 5 | Process vanished, no app error | Memory (OOM) | dmesg -T | grep -i 'killed process' |
right-size RAM; cap the hog; add swap |
| 6 | “Cannot allocate memory” / fork fails |
Memory / limits | free -m available~0; ulimit -a; /proc/sys/vm/overcommit_memory |
add RAM/swap; raise nofile/nproc |
| 7 | Monitoring shows memory “full”, app fine | Page cache confusion | free -m — big buff/cache, healthy available |
nothing; alarm on available, not used |
| 8 | Memory climbs then OOM every N hours/days | Memory leak | ps aux --sort=-rss trend; smem |
fix leak; restart policy; bigger box as stopgap |
| 9 | No space left on device, df -h shows free space |
Inode exhaustion | df -i IUse% 100% |
delete tiny files; recreate FS with more inodes |
| 10 | No space left on device, inodes fine |
Disk full (bytes) | df -h mount 100%; du -xhd1 / / ncdu -x / |
clear/rotate logs; grow volume + growpart+resize |
| 11 | df full but du finds nothing |
Deleted-but-open file | lsof +L1 (link-count 0) |
restart/truncate the holding process |
| 12 | App stalls, CPU low, await high |
EBS saturation | iostat await↑ + VolumeQueueLength > 1 |
raise IOPS/throughput; gp2→gp3 |
| 13 | Fast for minutes then falls off a cliff | gp2 BurstBalance drain | BurstBalance metric →0% |
gp3 (flat IOPS), or larger gp2, or io2 |
| 14 | I/O slow though volume is under its limit | Instance EBS cap | EBSIOBalance%/EBSByteBalance%→0 |
bigger instance (higher EBS ceiling) |
| 15 | Intermittent latency/loss, all else clean | ENA bandwidth allowance | ethtool -S bw_in/out_allowance_exceeded↑ |
bigger instance; spread traffic |
| 16 | Small-packet workload drops/stalls | ENA PPS allowance | ethtool -S pps_allowance_exceeded↑ |
bigger instance; batch; jumbo frames |
| 17 | New connections fail under load, old ones fine | ENA conntrack | ethtool -S conntrack_allowance_exceeded↑ |
pool/reuse conns; untracked SG rule; bigger instance |
| 18 | Intermittent DNS / IMDS / NTP timeouts | ENA link-local allowance | ethtool -S linklocal_allowance_exceeded↑ |
local DNS cache; cache IMDS; back off polling |
| 19 | T-instance bill jumped, no throttle | Unlimited surplus | CPUSurplusCreditsCharged > 0 |
Standard mode, or move to C/M |
| 20 | CPU/mem/disk fine but box unreachable/degraded | Status-check layer | StatusCheckFailed_System/_Instance |
see EC2 status-checks & recovery playbook |
Error / signature reference
Same string, different resource — this table disambiguates the ones that fool people.
| Signature / string | Seen in | Resource | Meaning | First move |
|---|---|---|---|---|
Out of memory: Killed process |
dmesg / journal |
Memory | OOM killer fired | right-size RAM; cap the hog |
Cannot allocate memory (ENOMEM) |
app stderr | Memory | malloc/fork refused |
free -m available; overcommit; limits |
fork: retry: Resource temporarily unavailable (EAGAIN) |
shell / app | Memory / limits | thread/PID/mem limit hit | ulimit -u, cgroup pids.max, RAM |
No space left on device (ENOSPC) |
app / dnf |
Disk | bytes OR inodes full | df -h and df -i |
Read-only file system (EROFS) |
app | Disk | FS remounted RO after I/O error | dmesg for EBS/xfs errors |
blocked for more than 120 seconds (hung_task) |
dmesg |
Disk I/O | thread wedged in I/O | EBS await/VolumeQueueLength |
nvme nvme0: I/O ... timeout, reset controller |
dmesg |
Disk | EBS/instance-store I/O timeout | EBS health + queue depth |
%st non-zero |
top/mpstat |
CPU | steal / throttle | CPUCreditBalance; noisy neighbour |
CPUCreditBalance = 0 |
CloudWatch | CPU | burst fuel gone (Standard=throttle) | Unlimited or fixed family |
BurstBalance = 0% |
CloudWatch | Disk | gp2/st1/sc1 burst drained | gp3 / bigger / provisioned |
bw_out_allowance_exceeded↑ |
ethtool -S |
Network | egress bandwidth shaped | bigger instance |
conntrack_allowance_exceeded↑ |
ethtool -S |
Network | tracked-connection cap | fewer conns; untracked rule |
linklocal_allowance_exceeded↑ |
ethtool -S |
Network | DNS/IMDS/NTP PPS shaped | local caches |
Fast triage — “if you see X, it’s probably Y”
| If you see… | It’s probably… | Do this first |
|---|---|---|
High load + high %wa |
I/O-bound | iostat -xz 1, then EBS metrics |
High load + high %us |
CPU-bound app | pidstat/top -H |
%st > 0 on a T instance |
credit exhaustion | CPUCreditBalance |
available near 0 + dmesg OOM |
memory-bound | right-size / cap |
df -h 100% |
disk full (bytes) | du/ncdu, then grow |
df -i 100% |
inode-bound | find the tiny-file dir |
VolumeQueueLength > 1 |
EBS-bound | raise IOPS / gp3 |
any *_allowance_exceeded rising |
network-bound | bigger instance / tune workload |
| everything clean but box unreachable | status-check / boot | recovery playbook |
Deep dive — the three nastiest
1) Credit-exhaustion steal (the graph lies down). Covered in the CPU section, but the reason it belongs at the top of “nastiest” is the inversion: on a Standard-mode burstable, CPUUtilization falls as performance worsens, because the hypervisor throttles you to baseline and there’s simply less CPU time to report. Every instinct (“CPU is low, it’s not CPU”) is wrong. The tell is %st in the guest plus CPUCreditBalance on the AWS side; nothing in the default console view alone reveals it. Fix by matching the workload to the model — Unlimited for spiky, fixed C/M for steady — and always alarm on CPUCreditBalance.
2) The invisible OOM (no metric, no error). A process disappears; the app logs show nothing because the app didn’t crash — the kernel killed it. And because EC2 has no default memory metric, CloudWatch is blank at the moment of death, so dashboards mislead. The only proof is dmesg -T | grep -i 'killed process'. The durable fixes are: install the agent so mem_used_percent shows the run-up, cap memory-hungry processes (JVM -Xmx, container limits) so they fail predictably, protect critical daemons with oom_score_adj = -1000, and add swap as a shock absorber (watching si/so so you don’t trade an OOM for thrashing).
3) ENA conntrack drops (established works, new fails). The cruel misdirection: existing connections are healthy, so you suspect a capacity or app-scaling issue — but new connections fail because the Nitro connection-tracking table (there because security groups are stateful) is full. ethtool -S eth0 | grep conntrack_allowance_exceeded climbing is the only signal — it appears in no CloudWatch metric and no VPC Flow Log. Fixes: pool and reuse connections and shorten idle timeouts to keep the table small; where the SG rule can be a broad allow-all in a direction, it may be untracked and stop consuming table entries; and, ultimately, a larger instance carries a larger allowance. The sibling linklocal_allowance_exceeded (DNS/IMDS/NTP) is the same shape of problem for link-local traffic — fix with local DNS caching and IMDS credential caching.
Best practices
- Install the CloudWatch agent on every instance — at minimum
mem_used_percentanddisk_used_percent(withinodes_free). The two most painful surprises (OOM, full disk) are the two dark rows; light them up by default, baked into the launch template / Terraform. - Alarm on the right signals, not the loud ones. For burstable:
CPUCreditBalancelow. For memory:mem_available_percentlow (notused). For gp2:BurstBalancelow. For disk:disk_used_percent≥ 85%. These catch the failure before it fires. - Run the four-axis sweep in order. CPU (and credits) → memory (and OOM) → disk (space, inodes, EBS) → network (ENA). Do not skip to a resize before you know which axis.
- Always read both views. Put the CloudWatch graph next to
top/free/iostat/ethtool; the gap between hypervisor and guest is the diagnosis. Never diagnose fromCPUUtilizationalone. - Prefer gp3 over gp2. Flat 3,000 IOPS / 125 MB/s with no burst game to lose, and ~20% cheaper. Migrating existing gp2→gp3 is an online
modify-volume. - Match burstable to workload. T-Unlimited for genuinely spiky; fixed C/M for anything that lives above baseline for hours. A pinned T in Unlimited quietly out-costs the fixed instance it should have been.
- Cap memory hogs. JVM
-Xmx, container--memory, cgroupmemory.max— so a leak fails one process gracefully instead of OOM-killing the box. - Keep an ENA-counter check in the runbook.
ethtool -S eth0 | grep allowance_exceeded, run twice a minute apart, for any “network weird” symptom. It’s free and it’s the only place those drops show. - Cache link-local calls. Run a local DNS cache and use the SDK credential cache so you never breach the link-local allowance under load.
- Use SSM Session Manager, not SSH, for diagnosis — no open port 22, full audit trail, and Run Command lets you sweep a fleet at once.
- Right-size from data, not vibes. Compute Optimizer + the agent’s memory metric over 14 days beats guessing; over- and under-provisioning are both diagnosable.
- Write the fingerprint down. After every incident, add the symptom→confirm→fix row to your team’s copy of the master table. Institutional memory is the real fix.
Security notes
Diagnosing an instance shouldn’t widen its attack surface. Prefer SSM Session Manager over SSH: it needs no inbound port 22, no key distribution, and every session is logged to CloudTrail/CloudWatch/S3 — so you can debug production without an internet-facing shell. The instance needs an IAM role with AmazonSSMManagedInstanceCore (for Session Manager and Run Command) and CloudWatchAgentServerPolicy (for the agent to publish metrics) — both AWS-managed, both minimal; grant nothing broader just to read top.
Scope the agent’s IAM to least privilege: CloudWatchAgentServerPolicy allows PutMetricData, reading SSM parameters prefixed AmazonCloudWatch-*, and ssm:GetParameter for its config — it does not grant broad ssm:* or metric read. If you also want the instance to pull its config from Parameter Store, keep that parameter name under the AmazonCloudWatch- prefix so the managed policy covers it without a custom policy.
Enforce IMDSv2 (HttpTokens = required on the instance metadata options) — this both hardens against SSRF credential theft and is relevant to the network axis, since a poorly-behaved app that hammers IMDS on every request can trip linklocal_allowance_exceeded; caching the session token fixes both the security and the allowance problem at once. Finally, restrict who can run ssm:StartSession and ssm:SendCommand via IAM — a diagnostic session is still a shell on production; gate it, log it, and prefer read-only Run Command documents for routine sweeps.
Cost & sizing
The bill from this topic comes from three places: metrics, storage, and the burstable trap.
| Cost driver | Rough figure (ap-south-1 / us-east-1) | Notes |
|---|---|---|
| Detailed monitoring (1-min EC2 metrics) | ~$2.10 / instance / month | default is 5-min (free); only enable where 1-min resolution earns its keep |
| CloudWatch agent custom metrics | ~$0.30 / metric / month (first 10k in some tiers vary) | mem+disk+swap+diskio ≈ 6–10 metrics/instance; multiply by fleet |
| CloudWatch alarms | ~$0.10 / alarm / month (standard) | the four lab alarms ≈ $0.40/month |
| Extra EBS gp2 (lab) | ~$0.10 / GB-month → $1 for 10 GiB | delete it in teardown |
| gp3 vs gp2 | gp3 ~20% cheaper per GB + free 3,000 IOPS/125 MB/s | migrating saves money and removes BurstBalance risk |
| T-Unlimited surplus | ~$0.05 / vCPU-hour (Linux) surplus | a pinned t3.large ≈ $0.05×2×730 ≈ $73/month surplus on top of base |
The sizing lessons fall out of the diagnosis. If CPUSurplusCreditsCharged is steadily positive, you are paying burstable-premium for a fixed workload — move to C/M and it’s usually cheaper and faster. If BurstBalance drains daily, gp3 is both the fix and a saving. If the agent’s mem_used_percent sits at 90%+ while CPU idles, you’re on the wrong family — move to R (memory-optimized) rather than buying a bigger, still-unbalanced box. And free-tier: t2/t3.micro at 750 h/month and 30 GiB of EBS cover the whole lab if you tear down promptly. Right-sizing down is as important as up — an over-provisioned fleet is a diagnosable, recoverable cost, not a fixed one.
Interview & exam questions
Q1. Why can’t you see memory utilization for an EC2 instance in CloudWatch by default, and how do you fix it? (SOA-C02)
The hypervisor allocates RAM but doesn’t read inside the guest, so there is no default memory metric. Install the CloudWatch agent, which reads /proc/meminfo and publishes mem_used_percent/mem_available_percent to the CWAgent namespace.
Q2. CloudWatch shows CPU at 30% but the app on a t3.medium is crawling. What do you check? (SOA-C02 / SAA-C03)
Read the guest: top for %st (steal). If %st is high and CPUCreditBalance is at 0, the burstable has exhausted credits and (in Standard mode) is throttled to baseline — which is why CPUUtilization reads low. Fix with Unlimited mode or a fixed-performance instance.
Q3. A process on your instance disappears with no application error. How do you prove it was the OOM killer? (DVA-C02 / SOA-C02)
sudo dmesg -T | grep -i 'killed process' (or journalctl -k). A line like “Out of memory: Killed process … (java)” is the proof. CloudWatch shows nothing because there’s no default memory metric.
Q4. df -h shows 40% free but writes fail with “No space left on device.” What’s wrong? (SOA-C02)
Inode exhaustion. Run df -i — IUse% will be 100% from too many small files. Free inodes by deleting the tiny files, or recreate the filesystem with more inodes.
Q5. What is BurstBalance and which volumes have it? (SAA-C03 / SOA-C02)
The percentage of the I/O burst credit bucket for gp2, st1, and sc1. gp2 volumes < 1 TiB burst above their 3 IOPS/GiB baseline to 3,000 IOPS by spending it; when it hits 0%, IOPS collapse to baseline. gp3, io1, io2 have no burst — they deliver provisioned performance flat.
Q6. Difference between gp2 and gp3 for a database that needs 6,000 IOPS? (SAA-C03) gp2 would need ~2 TiB just to reach a 6,000-IOPS baseline (3 IOPS/GiB). gp3 delivers a flat 3,000 IOPS free and you simply provision to 6,000 independent of size — cheaper and predictable, with no BurstBalance to drain.
Q7. Established connections work but new ones fail under load, with normal CPU/memory. Cause? (ANS-C01 / SOA-C02)
The ENA connection-tracking (conntrack) allowance is exhausted — security groups are stateful and Nitro tracks each connection in a size-limited table. Confirm with ethtool -S eth0 | grep conntrack_allowance_exceeded. Fix: pool/reuse connections, use untracked SG rules where possible, or a larger instance.
Q8. Your app has intermittent DNS resolution failures on EC2. What ENA counter would you check? (ANS-C01)
linklocal_allowance_exceeded — the PPS allowance for link-local services (DNS resolver at VPC+2, IMDS, NTP). Fix with a local DNS cache and by caching IMDS calls instead of polling per request.
Q9. Standard vs Unlimited credit mode — cost and behaviour? (SAA-C03) Standard throttles to baseline at 0 credits (no extra cost). Unlimited keeps bursting and bills surplus at ~$0.05/vCPU-hour if you overspend over 24 h. T3/T3a/T4g default to Unlimited; T2 defaults to Standard.
Q10. High load average but low CPU utilization — what does it usually mean on EC2? (SOA-C02)
Load counts uninterruptible-sleep (I/O-blocked) threads, so a high load with high %wa and low %us means you’re I/O-bound, not CPU-bound. Confirm with iostat -xz 1 (await, aqu-sz) and the EBS VolumeQueueLength metric.
Q11. iostat shows await of 40 ms and aqu-sz of 6 on a gp3 volume provisioned at 3,000 IOPS. What’s happening and what do you do? (SOA-C02)
The volume is saturated — I/O is queuing (aqu-sz > 1) and each op waits 40 ms. gp3 has no burst, so you’ve hit the provisioned ceiling. modify-volume to raise IOPS/throughput (online), or reduce I/O; also check EBSIOBalance% in case the instance is the cap.
Q12. How do you tell whether an EBS bottleneck is the volume or the instance? (SAA-C03 / SOA-C02)
Compare volume metrics (VolumeQueueLength, IOPS vs provisioned) with instance metrics EBSIOBalance% / EBSByteBalance%. If the volume is under its limit but EBSIOBalance%/EBSByteBalance% heads to 0, the instance’s EBS ceiling is the cap — move to a larger size.
Quick check
- Which single
topcolumn, if non-zero on a T-family instance, most strongly suggests burst-credit exhaustion? - Why does alarming on
free(rather thanavailable) memory produce false positives on Linux? - You get
No space left on devicebutdf -hshows free space. What’s the one command that identifies the real cause? - Which EBS volume types have a
BurstBalancemetric, and what does it hitting 0% do to a small gp2 volume? - Name the four ENA
*_allowance_exceededcounters and the one tool that shows them.
Answers
%st(steal). On a burstable, non-zero steal withCPUCreditBalanceat 0 means the hypervisor is throttling you to baseline.- Linux uses spare RAM as reclaimable page cache, so
freeis normally near zero on a healthy busy box.availablealready accounts for reclaimable cache and is the true “can I allocate more?” number. df -i— inode exhaustion throws the sameENOSPCwhile bytes remain free. (If both look fine,lsof +L1for deleted-but-open files.)- gp2, st1, and sc1. When a small gp2’s
BurstBalancehits 0%, IOPS collapse from the burst 3,000 to the 3-IOPS/GiB baseline (as low as 100), so the app falls off a performance cliff. bw_in_allowance_exceeded,bw_out_allowance_exceeded,pps_allowance_exceeded,conntrack_allowance_exceeded,linklocal_allowance_exceeded— shown byethtool -S eth0. (That’s five; any four earns the point.)
Glossary
| Term | Definition |
|---|---|
| Load average | Count of threads running or in uninterruptible (I/O) sleep, averaged over 1/5/15 min — not CPU %. |
CPU steal (%st) |
Time a vCPU was ready to run but the hypervisor scheduled elsewhere; on burstables, the fingerprint of credit throttling. |
| CPU credits | The burstable currency: earned below baseline, spent to burst above it; tracked by CPUCreditBalance. |
| Baseline (burstable) | The sustained CPU fraction a T instance gets without spending credits (e.g. t3.large = 30%/vCPU). |
| Standard / Unlimited | Credit modes: Standard throttles at 0 credits; Unlimited keeps bursting and bills surplus (~$0.05/vCPU-hr). |
| OOM killer | Kernel mechanism that kills a process to reclaim memory under pressure; logged in dmesg/journal, invisible to default CloudWatch. |
available memory |
RAM allocatable to new processes without swapping (includes reclaimable cache) — the number to watch, not free. |
| Page cache | Kernel caching of file data in otherwise-free RAM; shows as buff/cache, is reclaimable, and is healthy. |
| Inode | Filesystem metadata slot per file; a fixed pool that can exhaust (df -i) and throw ENOSPC while space remains. |
await |
Average milliseconds per I/O including queue time (iostat -x); the truest guest signal of EBS latency. |
VolumeQueueLength |
EBS CloudWatch metric of outstanding I/O; > 1 sustained indicates saturation. |
BurstBalance |
% of the I/O burst bucket for gp2/st1/sc1; draining to 0 collapses a small gp2 to baseline IOPS. |
| gp3 / gp2 | SSD EBS types: gp3 gives flat provisioned IOPS/throughput (no burst); gp2 scales IOPS with size and bursts via BurstBalance. |
| ENA | Elastic Network Adapter — the Nitro NIC whose per-instance allowances (bw/pps/conntrack/linklocal) shape traffic when exceeded. |
| conntrack allowance | Cap on simultaneously tracked connections (SGs are stateful); exceeding it drops new connections (conntrack_allowance_exceeded). |
| link-local allowance | PPS cap for traffic to DNS resolver, IMDS (169.254.169.254) and NTP; exceeding it causes intermittent DNS/IMDS timeouts. |
Next steps
- Right-size before you diagnose runtime problems — most CPU/memory grief is a family/size mismatch. See Choosing EC2 Instance Types & Families.
- Go deep on the disk axis with EBS volume types, IOPS/throughput provisioning and snapshots in EBS Volumes: Types, Snapshots & Hands-On.
- When the box is unreachable rather than slow, switch playbooks to EC2 Status Checks, Boot & Recovery Troubleshooting.
- Diagnose without SSH keys and sweep fleets at once using SSM Session Manager, Patch & Run Command.
- Take the network analysis up to the VPC layer (remembering ENA drops never reach Flow Logs) with VPC Flow Logs Network Troubleshooting.