A logistics company runs an order-events platform on AKS: a payments-consumer reading a Kafka topic and an invoice-worker draining an Azure Service Bus queue. Both are sized for the 6 p.m. dispatch peak, so they sit at eight replicas each — burning CPU and node hours — through the 2 a.m. trough when the topics are silent. The CPU-based HorizontalPodAutoscaler ops bolted on does nothing useful, because the consumers are I/O-bound on the broker, not CPU-bound: a 40,000-message Kafka backlog can build with the pods at 12% CPU and the HPA never reacts. The mandate from the platform lead is blunt — “scale on the actual backlog, and when there is no work, run zero pods.” That is exactly what KEDA (Kubernetes Event-Driven Autoscaling) does. KEDA scales Kubernetes workloads on the depth of the event source itself — Kafka consumer lag, Service Bus queue length, and 70-odd other sources — and it can take a deployment all the way to zero between bursts, something a plain HPA cannot do.
The reason a CPU HPA fails here is structural, not a tuning problem. A consumer that pulls a batch, does light transformation, and writes to a database spends most of its time waiting on network I/O, so CPU stays low even as the backlog explodes. The HPA metric is a proxy — you are hoping CPU correlates with backlog, and for I/O-bound workers it doesn’t. KEDA removes the proxy: it reads the actual metric that represents work waiting (unconsumed messages) and scales on that directly, and because “no work” is a real number (zero lag), it can scale to zero and hand back the node hours.
This guide stands the whole thing up end to end and teaches the mechanics a senior engineer learns the hard way: when to reach for a ScaledObject versus a ScaledJob, exactly how the Kafka lagThreshold and Service Bus messageCount translate into replica counts, why maxReplicaCount must respect Kafka’s partition ceiling, how the activation threshold is a different knob from the scaling threshold, how KEDA drives a hidden HPA for the 1→N range while owning the 0↔1 transitions itself, how to authenticate the scalers with TriggerAuthentication and Entra workload identity instead of stored secrets, and how to diagnose the two failures you will hit — “it won’t scale” and “the scaler lost auth and froze.”
What problem this solves
Event-driven workloads have a demand curve that looks nothing like a web app’s. A web front end scales on CPU or request rate and that works fine — load correlates with CPU. A message consumer is different: it is I/O-bound on the broker, its “load” is the number of unprocessed messages sitting in a topic or queue, and that backlog can be enormous while CPU is near idle. Try to autoscale it on CPU and you get the worst of both worlds — the HPA never scales out when a 50,000-message backlog builds (CPU is low), and it may scale in right when you need throughput. So teams give up on autoscaling and pin the deployment at a fixed replica count sized for peak. That fixed floor runs 24×7, paying for pods and nodes during every trough.
What breaks without KEDA: you either over-provision (a fixed peak-sized floor, wasting money overnight) or under-provision (a floor sized for the average, so backlog and latency blow out during bursts and your SLA breaks). Neither is acceptable for a workload with a 10× peak-to-trough ratio. And there is a subtler failure — you cannot scale a plain-HPA workload to zero at all (the HPA’s floor is 1), so even a perfectly idle consumer keeps a pod alive, keeping a node alive, all night.
Who hits this: anyone running Kafka/Event Hubs consumers, Azure Service Bus or RabbitMQ workers, cron-style batch jobs triggered by queue depth, or any deployment whose real load signal lives outside the pod. It bites hardest on cost-sensitive platforms with bursty traffic and on latency-sensitive pipelines where a growing backlog is directly customer-visible. KEDA is a small, standard, CNCF-graduated add-on that turns the backlog itself into the scaling metric and unlocks true scale-to-zero.
To frame the whole field before the deep dive, here is what KEDA changes versus a stock HPA:
| Dimension | Plain HPA (CPU/memory) | KEDA (event-driven) |
|---|---|---|
| Scaling signal | Pod CPU/memory (a proxy) | Actual backlog: Kafka lag, queue length, etc. |
| Scale-to-zero | No — minimum is 1 replica | Yes — minReplicaCount: 0, operator owns 0↔1 |
| Metric source | In-cluster metrics-server | 70+ external scalers polling the source |
| Right for | CPU-bound web/API workloads | I/O-bound consumers, batch, event pipelines |
| Reacts to a silent-but-backlogged topic | No (CPU stays low) | Yes (reads lag directly) |
| 1→N ramp control | HPA behavior | Same HPA behavior (KEDA drives an HPA) |
Learning objectives
By the end of this article you can:
- Install KEDA on an AKS/Kubernetes cluster with Helm, verify the operator and metrics adapter are healthy, and run the single smoke test that proves scaling will work.
- Choose between a ScaledObject (scale a long-running Deployment/StatefulSet) and a ScaledJob (spawn a Kubernetes Job per unit of work) and explain when each is correct.
- Author a Kafka scaler that scales on consumer-group lag, size
lagThreshold, and respect the partition ceiling that caps useful replicas. - Author an Azure Service Bus scaler for both queues (
queueName) and topics (topicName+subscriptionName), and sizemessageCount. - Authenticate scalers securely with TriggerAuthentication / ClusterTriggerAuthentication and Entra workload identity, keeping the scaler identity separate from the consumer identity.
- Tune scale-to-zero,
cooldownPeriod,pollingInterval, the activation vs scaling threshold distinction, and the HPAbehaviorblock for asymmetric fast-out/slow-in ramping. - Combine multiple triggers on one workload and predict the resulting replica count (KEDA takes the max).
- Diagnose the two canonical failures — a workload that won’t scale and a scaler that lost authentication — from
kubectloutput and operator logs.
Prerequisites & where this fits
You should be comfortable with core Kubernetes objects (Deployments, Services, ServiceAccounts), kubectl, and Helm v3, and you should understand what a HorizontalPodAutoscaler does, because KEDA builds on it. You need a running cluster — this guide assumes AKS (Kubernetes 1.28+) with the OIDC issuer and workload identity add-ons enabled — plus a message source: a Kafka cluster (self-managed Strimzi/Confluent, or Azure Event Hubs’ Kafka surface) with a topic and consumer group, and an Azure Service Bus namespace (Standard or Premium) with a queue. Critically, the consumers themselves must already run and commit offsets correctly before you add autoscaling — KEDA scales a workload, it does not fix a broken one. If your consumer doesn’t commit offsets, KEDA will read a lag that never drops and scale to the ceiling forever.
This sits in the container platform / autoscaling track. It assumes the AKS fundamentals from Your First AKS Cluster: CLI, Portal, and Bicep Walkthrough and the cluster-authentication model from AKS Managed Identity vs Service Principal for Cluster Auth. It pairs with node-level scaling — AKS Cluster Autoscaler vs Node Autoprovisioning (Karpenter) — because KEDA scaling pods to zero only saves real money when the cluster autoscaler then removes the empty nodes. On the source side it leans on Azure Event Hubs: Partitions, Consumer Groups, and Offsets Explained and Azure Service Bus: Queues vs Topics — When to Use Which. If your workload is HTTP rather than message-driven, the scale-to-zero story lives in Container Apps: Your First Microservice with Scale-to-Zero and Knative Serving: Scale-to-Zero for HTTP Workloads instead.
Where this fits in the bigger picture — the layers of autoscaling and who owns each:
| Layer | What scales | Driven by | Owner in this guide |
|---|---|---|---|
| Pod (1→N and 0↔1) | Replica count of a Deployment | Event source depth | KEDA (this article) |
| Pod (1→N, CPU/mem) | Replica count | In-cluster metrics | HPA (KEDA reuses it) |
| Node | VM count in a node pool | Pending/idle pods | Cluster Autoscaler / Karpenter |
| Cluster control plane | API server, etc. | Managed | Azure (AKS) |
| Source capacity | Partitions / throughput units | Manual / policy | Platform / data team |
Core concepts
Five mental models make every later decision obvious.
KEDA is two components, and they split the job. KEDA installs into a keda namespace as an operator and a metrics adapter (metrics apiserver). The operator watches ScaledObject/ScaledJob resources and owns the 0↔1 transition — activating a scaled-to-zero deployment from 0 to 1 when work appears, and deactivating it from 1 to 0 after a cooldown. The metrics adapter registers as a Kubernetes external-metrics API server (v1beta1.external.metrics.k8s.io) and serves the observed backlog as a metric. For the 1→N range, KEDA creates and drives a normal HPA under the hood, feeding it the backlog as an external metric — so you get native HPA behaviour (stabilization windows, scaling policies) for free. The mental split: KEDA does 0↔1; the HPA does 1↔N. This is why a plain HPA can’t scale to zero (its floor is 1) but KEDA can (the operator handles the last hop).
A scaler is a plug-in that reads one source. KEDA ships ~70 scalers — Kafka, Azure Service Bus, RabbitMQ, AWS SQS, Prometheus, Redis lists, PostgreSQL, and more. A scaler’s job is narrow: given some metadata, return “how much work is waiting” (lag, message count, query result). You reference a scaler as a trigger inside a ScaledObject. Each trigger has two numbers that matter — the scaling target (e.g. lagThreshold: 500 means “one replica per 500 messages of lag”) and, optionally, an activation threshold (the floor below which KEDA keeps the workload at zero). Everything else about a trigger is connection detail.
ScaledObject scales a running workload; ScaledJob spawns jobs. A ScaledObject points at a long-running Deployment/StatefulSet and adjusts its replica count — right for stream consumers that stay resident and process a continuous flow. A ScaledJob creates a fresh Kubernetes Job per batch of work (up to a limit) and lets each run to completion — right for discrete, long-running units where you want isolation and a clean exit per item (video transcode, a report per queued request). Picking the wrong one is a common early mistake: a ScaledObject re-uses pods across messages (good for high-throughput streams); a ScaledJob gives one pod its own lifecycle per item (good for long, isolated tasks).
Activation and scaling are two different thresholds. This trips everyone up. The scaling threshold (lagThreshold, messageCount) governs the 1→N math: desiredReplicas = ceil(metricValue / threshold). The activation threshold (activationLagThreshold, activationMessageCount) is a separate gate that governs 0→1: KEDA only wakes a scaled-to-zero workload once the metric exceeds the activation value (default 0). Set activationLagThreshold: 10 and a trickle of 5 messages will not start a pod — useful to avoid flapping on tiny bursts. The scaling threshold does the sizing; the activation threshold decides whether to leave zero at all.
Scale-to-zero is a cost lever with a latency cost. With minReplicaCount: 0, an idle consumer runs no pods, and when its pods drain the cluster autoscaler can remove the now-empty nodes — turning saved pod-hours into saved VM-hours. The price is a cold start: the first message after idle waits for a pod to schedule, image-pull, boot, join the consumer group and rebalance (10–60s for Kafka). For latency-critical paths, keep minReplicaCount: 1; for anything that tolerates a few seconds after a lull, scale to zero and bank the savings. The cooldownPeriod decides how long the metric must stay below activation before KEDA drops to zero.
The vocabulary in one table
Pin down every moving part before the deep sections. The glossary repeats these for lookup; this table is the model side by side:
| Concept | One-line definition | Where it lives | Why it matters |
|---|---|---|---|
| Operator | Reconciles ScaledObjects; owns 0↔1 | keda namespace |
The thing that activates/deactivates |
| Metrics adapter | External-metrics API server for HPA | keda namespace |
Feeds backlog to the HPA (1→N) |
| ScaledObject | Scales a Deployment/StatefulSet | App namespace | The core resource for consumers |
| ScaledJob | Spawns a Job per work item | App namespace | For discrete long-running batches |
| Scaler / trigger | Reads one source’s backlog | Inside a ScaledObject | Kafka lag, SB messages, etc. |
| TriggerAuthentication | Auth config the trigger references | App namespace | Workload identity / secret for the scaler |
lagThreshold |
Kafka messages of lag per replica | Kafka trigger metadata | Sizes 1→N for Kafka |
messageCount |
Service Bus messages per replica | SB trigger metadata | Sizes 1→N for Service Bus |
| Activation threshold | Floor that gates 0→1 | Trigger metadata | Stops flapping on tiny bursts |
cooldownPeriod |
Seconds at zero-work before →0 | ScaledObject spec | How long before scaling to zero |
pollingInterval |
Seconds between backlog checks | ScaledObject spec | Reaction latency vs broker load |
| Managed HPA | keda-hpa-<name> KEDA creates |
App namespace | Do NOT also create your own |
ScaledObject vs ScaledJob: pick the right resource
Everything downstream depends on this fork. KEDA has two CRDs for scaling workloads, and they model fundamentally different execution shapes.
A ScaledObject wraps a Deployment (or StatefulSet, or any /scale sub-resource) and changes its replica count. The pods are long-running — each stays up and processes message after message, re-using its connection, warm caches, and consumer-group membership. This is the right model for a stream consumer (a Kafka group consumer, a Service Bus receive-loop): throughput is high because there is no per-message startup cost.
A ScaledJob wraps a Kubernetes Job template and creates a new Job per unit of work, up to maxReplicaCount concurrent jobs. Each Job runs to completion and exits — the right model for discrete, long-running, isolated tasks (transcode a video, generate a report, run an ETL batch) where each item wants its own fresh pod, its own resource envelope, and a clean success/failure exit that Kubernetes tracks. It is the wrong model for a high-throughput stream (you’d pay pod-startup per item).
The decision, laid out:
| Question | ScaledObject | ScaledJob |
|---|---|---|
| What it scales | A running Deployment/StatefulSet | Spawns a Job per work item |
| Pod lifecycle | Long-lived, re-used across messages | One item per pod, runs to completion |
| Best for | Stream consumers (Kafka, SB receive-loop) | Long, isolated batch tasks |
| Per-item startup cost | Paid once (warm pods) | Paid per item (fresh pod) |
| Scale-to-zero | Yes (minReplicaCount: 0) |
Inherent (no jobs = nothing running) |
| Consumer-group membership | Stable, rebalances on scale | New membership per job |
| Failure isolation | Shared pods | Per-job (Kubernetes tracks each) |
| Managed HPA created | Yes (keda-hpa-<name>) |
No (KEDA drives Job count directly) |
Concrete rules of thumb:
| If the work is… | Use | Because |
|---|---|---|
| A continuous Kafka/SB stream | ScaledObject | Warm pods, high throughput, stable group membership |
| One message = one long job (minutes+) | ScaledJob | Isolation, clean exit, no re-use benefit anyway |
| Latency-critical, always some traffic | ScaledObject (minReplicaCount: 1) |
Avoid cold start |
| Rare, bursty, expensive per item | ScaledJob | Pay for pods only while a job runs |
| Needs per-item resource limits/quota | ScaledJob | Each Job carries its own spec |
The rest of this guide uses ScaledObject for both consumers, because both are stream consumers — the common case. A ScaledJob example appears in the deep-dive section on batch workloads.
The Kafka scaler: scaling on consumer lag
The Kafka scaler answers “how many messages is my consumer group behind?” — the consumer lag, which is latestOffset − committedOffset summed across the partitions the group owns. That number is the honest signal of pending work, and KEDA turns it into replicas: desiredReplicas = ceil(totalLag / lagThreshold).
The metadata that matters
| Field | What it does | Example | Notes / gotcha |
|---|---|---|---|
bootstrapServers |
Broker list to connect to | broker:9092 |
Event Hubs Kafka surface uses :9093 + TLS |
consumerGroup |
The group whose lag is read | payments-consumer |
Must match the consumers’ actual group |
topic |
Topic to measure | orders |
Omit to sum lag across all group topics |
lagThreshold |
Messages of lag per replica | "500" |
The 1→N sizing knob; default 10 |
activationLagThreshold |
Lag floor to go 0→1 | "10" |
Default 0; gate tiny bursts |
offsetResetPolicy |
Where to start if no committed offset | latest |
latest avoids replaying history on first run |
allowIdleConsumers |
Allow replicas > partitions | "false" |
Default false — keeps you honest on the ceiling |
scaleToZeroOnInvalidOffset |
Behaviour when offset is invalid | "false" |
If true, scales to 0 on invalid offset instead of holding |
sasl / tls |
Auth + transport | oauthbearer / enable |
Event Hubs: OAUTHBEARER + TLS |
excludePersistentLag |
Ignore stuck (non-advancing) lag | "false" |
Avoids scaling forever on a poison partition |
The partition ceiling — the number-one Kafka mistake
A Kafka consumer group can have at most one active consumer per partition. If orders has 30 partitions and you scale to 40 replicas, 10 pods sit idle — they join the group, get assigned nothing, and waste resources while triggering rebalances. So maxReplicaCount must not exceed the topic’s partition count. KEDA even enforces a version of this: by default allowIdleConsumers: false caps the scaler’s own recommendation at the partition count. The rule: your real ceiling is min(partitions, whatever downstream can absorb).
How lag maps to replicas at lagThreshold: 500:
| Total consumer lag | ceil(lag / 500) |
Capped at 30 partitions? | Resulting replicas |
|---|---|---|---|
| 0 (and below activation) | 0 | — | 0 (scaled to zero) |
| 400 | 1 | no | 1 |
| 2,500 | 5 | no | 5 |
| 12,000 | 24 | no | 24 |
| 15,000 | 30 | at ceiling | 30 |
| 40,000 | 80 | yes | 30 (extra would idle) |
A real Kafka ScaledObject
First a TriggerAuthentication that tells the scaler to use Entra workload identity (for Event Hubs), then the ScaledObject:
# kafka-trigger-auth.yaml
apiVersion: keda.sh/v1alpha1
kind: TriggerAuthentication
metadata:
  name: kafka-eventhub-auth
  namespace: orders
spec:
  podIdentity:
    provider: azure-workload
    identityId: "<id-keda-scaler-client-id>"   # the scaler's user-assigned identity
---
# kafka-scaledobject.yaml
apiVersion: keda.sh/v1alpha1
kind: ScaledObject
metadata:
  name: payments-consumer
  namespace: orders
spec:
  scaleTargetRef:
    name: payments-consumer          # the Deployment to scale
  pollingInterval: 15                # seconds between lag checks
  cooldownPeriod: 120                # seconds at ~0 lag before scaling to 0
  minReplicaCount: 0                 # scale-to-zero between bursts
  maxReplicaCount: 30                # never exceed the topic's partition count
  triggers:
    - type: kafka
      metadata:
        bootstrapServers: sb-orders-prod.servicebus.windows.net:9093
        consumerGroup: payments-consumer
        topic: orders
        lagThreshold: "500"               # ~1 replica per 500 messages of lag
        activationLagThreshold: "10"      # don't wake for a trickle
        offsetResetPolicy: latest
        sasl: oauthbearer                 # Entra token via OAUTHBEARER (Event Hubs)
        tls: enable
      authenticationRef:
        name: kafka-eventhub-auth
kubectl apply -f kafka-trigger-auth.yaml
kubectl apply -f kafka-scaledobject.yaml
The moment you apply the ScaledObject, KEDA creates a managed HPA named keda-hpa-payments-consumer. Do not create your own HPA on the same Deployment — two controllers writing one replica count oscillate endlessly. Size lagThreshold from a measurement, not a guess: run one replica, measure its steady drain rate (messages/second), multiply by your pollingInterval to get “messages one replica clears between checks,” and set lagThreshold near that. Too low over-scales and thrashes on partition rebalances; too high lets backlog and latency build before KEDA reacts.
Self-managed Kafka with SASL/SCRAM
If you run your own Kafka with SASL/SCRAM (no Entra), the auth moves into a Secret referenced by the TriggerAuthentication. Keep the credential in HashiCorp Vault and sync it into a Kubernetes Secret via the External Secrets Operator rather than committing it — see External Secrets Operator with Vault, AWS Secrets & Kubernetes:
apiVersion: keda.sh/v1alpha1
kind: TriggerAuthentication
metadata:
  name: kafka-sasl-auth
  namespace: orders
spec:
  secretTargetRef:
    - parameter: username
      name: kafka-creds      # a K8s Secret synced from Vault
      key: username
    - parameter: password
      name: kafka-creds
      key: password
    - parameter: sasl
      name: kafka-creds
      key: sasl              # e.g. "scram_sha512"
    - parameter: tls
      name: kafka-creds
      key: tls               # "enable"
The Azure Service Bus scaler: queues and topics
The Service Bus scaler reads the active message count on a queue or a topic subscription from the management API and scales toward ceil(activeMessages / messageCount). Unlike Kafka, Service Bus has no partition ceiling on consumers — you can run as many receivers as the entity allows — so maxReplicaCount is governed by downstream limits (a database connection pool, an API rate cap), not the broker.
Queue vs topic-subscription metadata
A queue trigger names queueName; a topic trigger names topicName and subscriptionName (because the depth lives on the subscription, not the topic). Everything else is shared:
| Field | Queue trigger | Topic trigger | Notes |
|---|---|---|---|
namespace |
required | required | The Service Bus namespace name (no .servicebus... suffix when using workload identity) |
queueName |
required | — | The queue to measure |
topicName |
— | required | The topic |
subscriptionName |
— | required | Depth is per-subscription |
messageCount |
target per replica | target per replica | Default 5; the 1→N sizing knob |
activationMessageCount |
floor for 0→1 | floor for 0→1 | Default 0 |
How activeMessageCount maps to replicas at messageCount: 20:
| Active messages in queue | ceil(msgs / 20) |
Replicas |
|---|---|---|
| 0 (below activation) | 0 | 0 |
| 15 | 1 | 1 |
| 100 | 5 | 5 |
| 1,000 | 50 | 50 |
| 5,000 | 250 | capped by maxReplicaCount |
A real Service Bus ScaledObject (queue)
# servicebus-scaledobject.yaml
apiVersion: keda.sh/v1alpha1
kind: TriggerAuthentication
metadata:
  name: servicebus-auth
  namespace: orders
spec:
  podIdentity:
    provider: azure-workload
    identityId: "<id-keda-scaler-client-id>"
---
apiVersion: keda.sh/v1alpha1
kind: ScaledObject
metadata:
  name: invoice-worker
  namespace: orders
spec:
  scaleTargetRef:
    name: invoice-worker
  pollingInterval: 20
  cooldownPeriod: 300
  minReplicaCount: 0
  maxReplicaCount: 50                    # governed by DB pool, not the broker
  triggers:
    - type: azure-servicebus
      metadata:
        namespace: sb-orders-prod
        queueName: invoices
        messageCount: "20"               # ~20 messages per replica
        activationMessageCount: "5"
      authenticationRef:
        name: servicebus-auth
kubectl apply -f servicebus-scaledobject.yaml
For a topic subscription, swap the trigger metadata:
    - type: azure-servicebus
      metadata:
        namespace: sb-orders-prod
        topicName: order-events
        subscriptionName: invoicing-sub
        messageCount: "20"
      authenticationRef:
        name: servicebus-auth
Two production notes. First, messageCount counts active messages — dead-lettered messages don’t count, so a poison-message storm won’t inflate your scaling (alert on DLQ depth separately). Second, if invoices uses sessions, scaling on messageCount still works, but cap maxReplicaCount at the number of concurrent sessions you expect — one consumer locks a session at a time, so replicas beyond the session count idle. For the queue-vs-topic mechanics, see Service Bus: Queues vs Topics — When to Use Which.
Authentication: TriggerAuthentication and workload identity
A scaler needs to reach the source to read its depth, and that requires credentials. KEDA’s answer is the TriggerAuthentication (namespaced) or ClusterTriggerAuthentication (cluster-wide) CRD — a reusable auth object a trigger references via authenticationRef, so the same identity can back many ScaledObjects without repeating secrets in each.
The authentication providers
TriggerAuthentication mechanism |
What it uses | Best for | Secret in cluster? |
|---|---|---|---|
podIdentity: azure-workload |
Entra workload identity (federated) | Event Hubs, Service Bus on Azure | No |
secretTargetRef |
A Kubernetes Secret’s keys | Self-managed brokers (SASL) | Yes (sync from Vault) |
env |
Env vars on the scaler pod | Rare; simple cases | Depends |
hashiCorpVault |
Direct Vault lease | Vault-centric shops | No (leased) |
azureKeyVault |
Secrets from Azure Key Vault | Azure-centric secret storage | No |
ClusterTriggerAuthentication |
Any of the above, cluster-scoped | Shared identity across namespaces | Varies |
Wiring Entra workload identity end to end
KEDA should read broker and queue depth as a managed identity, not a stored connection string. Enable the operator’s workload-identity support at install time, then federate a user-assigned identity to KEDA’s operator service account so the scalers authenticate as it. (Terraform owns these resources in a real platform; the az calls are shown for clarity — run them against a non-secret identity only.)
helm install keda kedacore/keda \
  --namespace keda --version 2.15.1 \
  --set podIdentity.azureWorkload.enabled=true \
  --set podIdentity.azureWorkload.clientId="$KEDA_OPERATOR_CLIENT_ID" \
  --set serviceAccount.create=true
# A user-assigned identity KEDA's scalers authenticate as
az identity create -g rg-orders-prod -n id-keda-scaler
KEDA_OPERATOR_CLIENT_ID=$(az identity show -g rg-orders-prod -n id-keda-scaler --query clientId -o tsv)

# Federate it to KEDA's operator service account (the OIDC subject)
OIDC_ISSUER=$(az aks show -g rg-orders-prod -n aks-orders-prod --query oidcIssuerProfile.issuerUrl -o tsv)

az identity federated-credential create \
  --name fc-keda-operator \
  --identity-name id-keda-scaler \
  --resource-group rg-orders-prod \
  --issuer "$OIDC_ISSUER" \
  --subject system:serviceaccount:keda:keda-operator \
  --audience api://AzureADTokenExchange

# Grant it the DATA-PLANE read roles (Receiver, not Manage/Send)
SB_ID=$(az servicebus namespace show -g rg-orders-prod -n sb-orders-prod --query id -o tsv)
az role assignment create --assignee "$KEDA_OPERATOR_CLIENT_ID" \
  --role "Azure Service Bus Data Receiver" --scope "$SB_ID"
# And, for the Event Hubs Kafka surface:
#   --role "Azure Event Hubs Data Receiver" --scope <event-hubs-namespace-id>
The exact roles the scaler needs — least privilege, read-only:
| Source | Role the scaler needs | Scope | Does NOT need |
|---|---|---|---|
| Service Bus (queue/topic) | Azure Service Bus Data Receiver | Namespace | Sender, Owner, Manage |
| Event Hubs (Kafka surface) | Azure Event Hubs Data Receiver | Namespace | Sender, Owner |
| Self-managed Kafka | SASL user with Describe/Read on the group |
Broker ACLs | Write/Alter |
Keep the scaler identity separate from the consumer identity
The consumer pods also need to reach the broker (to actually receive messages). Give each consumer its own workload-identity service account, distinct from KEDA’s scaler identity, so app traffic and metric polling use separate, least-privilege identities:
# payments-consumer-sa.yaml
apiVersion: v1
kind: ServiceAccount
metadata:
  name: payments-consumer
  namespace: orders
  annotations:
    azure.workload.identity/client-id: "<consumer-identity-client-id>"
---
# in the Deployment's pod template:
#   metadata:
#     labels:
#       azure.workload.identity/use: "true"
#   spec:
#     serviceAccountName: payments-consumer
This keeps the blast radius small: if a consumer identity leaks it can consume messages, but it is not the identity KEDA uses to enumerate queues, and neither identity can touch infrastructure. The two-identity model:
| Identity | Belongs to | Data-plane role | If compromised |
|---|---|---|---|
id-keda-scaler |
KEDA operator SA | Data Receiver (read depth) | Can read backlog metadata only |
id-payments-consumer |
Consumer pods | Data Receiver (consume) | Can consume messages on that entity |
id-invoice-worker |
Invoice worker pods | Data Receiver (consume) | Can consume on invoices only |
Scale-to-zero, cooldown, polling, and the HPA interplay
This is where you turn a working ScaledObject into a well-behaved one. Three ScaledObject-level knobs and one HPA block control the dynamics.
The four dynamics knobs
| Setting | Governs | Default | Raise it when… | Lower it when… |
|---|---|---|---|---|
pollingInterval |
Seconds between backlog checks | 30 | Broker admin API is rate-limited | Bursts need fast reaction (→ 10–15) |
cooldownPeriod |
Seconds at ~0 before →0 | 300 | Cold start is expensive; avoid flap | You want to release nodes faster |
minReplicaCount |
Floor (0 enables scale-to-zero) | 0 | Latency-critical; avoid cold start (→1) | Cost matters more than first-message latency |
idleReplicaCount |
Distinct idle floor (optional) | unset | You want e.g. 0 idle but never 1 as a “min” | (advanced; rarely needed) |
pollingInterval is the reaction-latency knob: at 30s, up to 30 seconds of backlog can build unnoticed before KEDA sees it. Tighten to 10–15s for bursty topics — but not so tight you hammer the broker’s management API (Service Bus meters management calls; a 1s poll across many ScaledObjects can throttle). cooldownPeriod only applies to the last replica leaving (the 1→0 hop); the 1→N scale-in is governed by the HPA below.
The 0↔1 vs 1↔N split, made concrete
Walk one full cycle to cement the mental model:
| Phase | Metric | Who acts | Result |
|---|---|---|---|
| Idle | lag = 0 (< activation) | KEDA operator | 0 replicas |
| First burst | lag crosses activation | KEDA operator | 0 → 1 (activation) |
| Growing backlog | lag = 6,000, threshold 500 | HPA (KEDA-fed metric) | 1 → 12 |
| Backlog shrinking | lag = 1,000 | HPA | 12 → 2 (per scale-down policy) |
| Backlog cleared | lag = 0 for cooldownPeriod |
KEDA operator | 1 → 0 (deactivation) |
Only the first and last hops are KEDA’s; the middle is a stock HPA you can inspect with kubectl describe hpa keda-hpa-<name>.
Tuning the 1→N ramp with HPA behavior
The 1→N ramp is the HPA’s behavior, which KEDA exposes through advanced.horizontalPodAutoscalerConfig. Make it asymmetric — scale out fast, scale in slow — because a backlog is customer-visible latency (scale out immediately) while killing a pod mid-batch re-incurs cold-start and partition-rebalance cost (scale in cautiously):
# patch onto the Kafka ScaledObject spec:
  advanced:
    horizontalPodAutoscalerConfig:
      behavior:
        scaleUp:
          stabilizationWindowSeconds: 0     # scale out immediately on a backlog
          policies:
            - type: Percent
              value: 100                      # up to double per step
              periodSeconds: 30
        scaleDown:
          stabilizationWindowSeconds: 300     # 5 min of low lag before scaling in
          policies:
            - type: Percent
              value: 50                       # at most halve per step
              periodSeconds: 60
For scale-to-zero to be safe, the consumer must handle SIGTERM gracefully — commit the current Kafka offset, and complete or abandon the in-flight Service Bus message — so the last replica leaving does not drop or double-process a message. Set terminationGracePeriodSeconds on the pod to cover the longest in-flight batch.
Multiple triggers on one workload
A workload often has more than one demand signal — a consumer that reads Kafka and should also scale up when a Prometheus latency metric climbs, or a worker fed by two queues. KEDA supports a list of triggers, and the rule is simple: KEDA computes the desired replicas for each trigger independently and takes the maximum. Any single trigger crossing its threshold scales the whole workload; the workload scales to zero only when all triggers are below their activation thresholds.
  triggers:
    - type: kafka
      metadata:
        bootstrapServers: broker:9092
        consumerGroup: payments-consumer
        topic: orders
        lagThreshold: "500"
      authenticationRef: { name: kafka-eventhub-auth }
    - type: azure-servicebus
      metadata:
        namespace: sb-orders-prod
        queueName: priority-invoices
        messageCount: "10"
      authenticationRef: { name: servicebus-auth }
    - type: prometheus
      metadata:
        serverAddress: http://prometheus.monitoring:9090
        query: sum(rate(orders_processing_seconds_sum[2m]))
        threshold: "50"
How the max works with three triggers:
| Kafka replicas | Service Bus replicas | Prometheus replicas | KEDA sets |
|---|---|---|---|
| 4 | 2 | 1 | 4 (max) |
| 0 | 6 | 0 | 6 (max) |
| 0 | 0 | 0 (all < activation) | 0 (scale to zero) |
| 3 | 3 | 8 | 8 (max) |
Two cautions. pollingInterval and cooldownPeriod are ScaledObject-wide, not per-trigger — every trigger is polled on the same interval. And a broken trigger can pin your scaling: if the Kafka scaler loses auth and errors, it may hold the workload at its last value while the other triggers still work, so alert on keda_scaled_object_errors per object.
Architecture at a glance
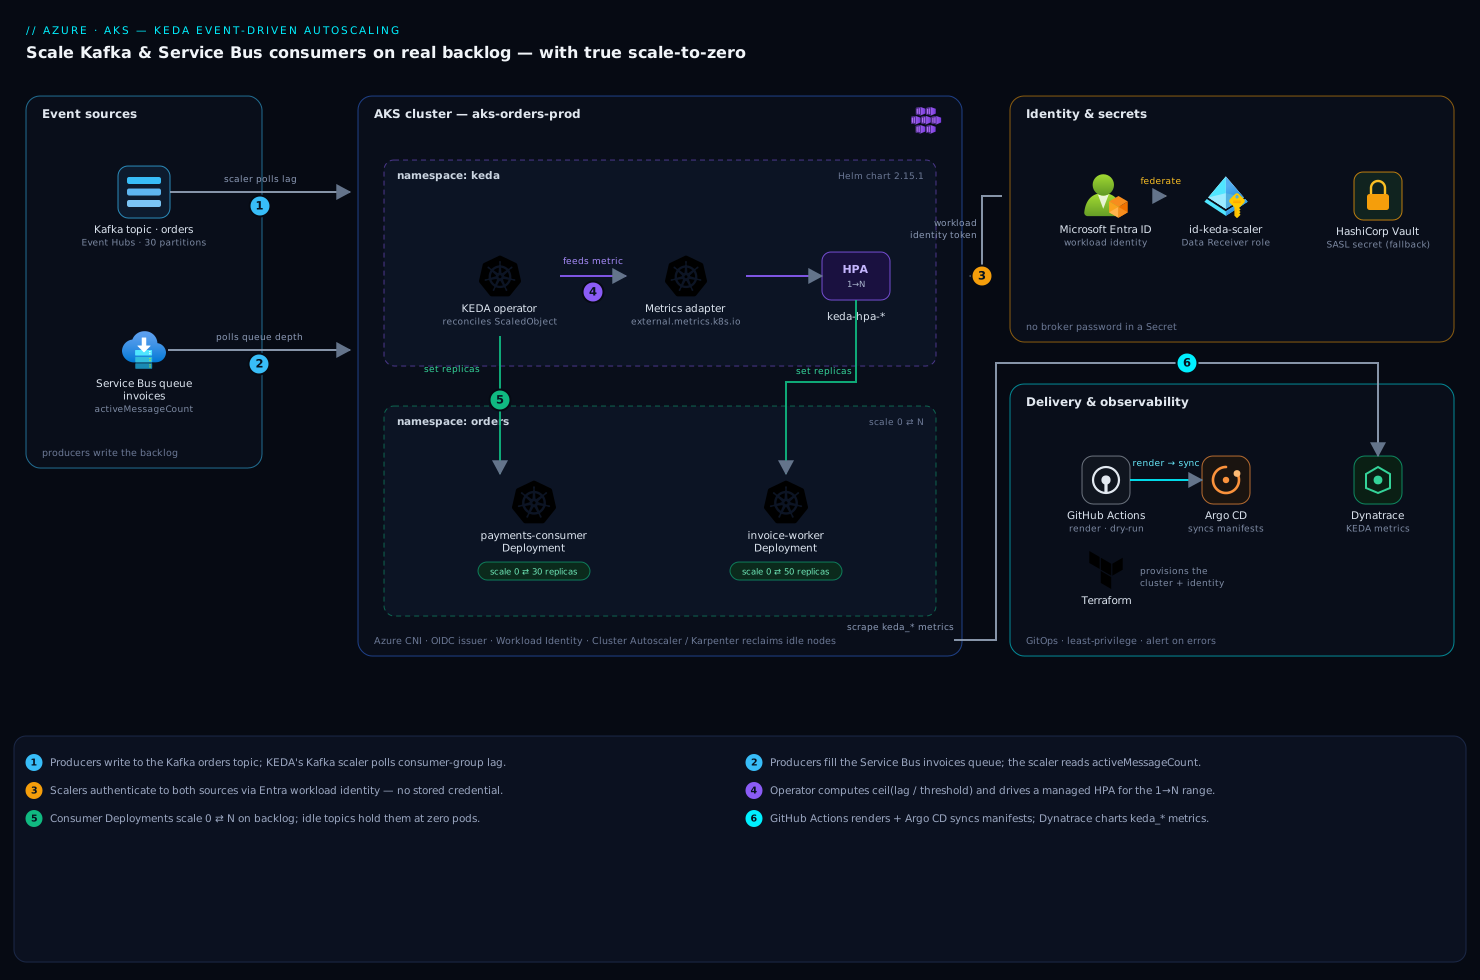
The diagram traces the whole loop, left to right. Producers write to the Kafka orders topic and the Service Bus invoices queue. Inside the cluster, KEDA runs as two components in the keda namespace: the operator (which owns the 0↔1 transitions) and the metrics adapter (registered as the v1beta1.external.metrics.k8s.io API server). KEDA’s scalers poll each source on a fixed pollingInterval — reading Kafka consumer-group lag and the Service Bus active message count. The operator computes desired replicas as ceil(backlog / threshold) and drives the consumer Deployments (payments-consumer, invoice-worker), creating a managed HPA per workload for the 1→N range and scaling each Deployment back to zero after cooldownPeriod once its backlog clears.
Follow the identity path, drawn as a separate flow: both scalers authenticate to Azure through Microsoft Entra ID workload identity (federated to the KEDA operator’s service account) so no broker password or Service Bus connection string ever lands in a Kubernetes Secret. Notice the two distinct arrows into the broker — one from KEDA (reading depth via the scaler identity) and one from the consumer pods (consuming messages via their own identity) — least-privilege, separated. Finally, when a Deployment drains to zero and its node empties, the cluster autoscaler removes the node, turning saved pod-hours into saved VM-hours: the KEDA loop is the pod-level half of a two-level scaling system.
Real-world scenario
Meridian Freight runs the order-events platform described in the intro: on a single AKS cluster in Central India, a payments-consumer reads a 30-partition Event Hubs topic (orders, on the Kafka surface) and an invoice-worker drains a Service Bus queue (invoices). Before KEDA, both Deployments were pinned at 8 replicas to survive the 6 p.m. dispatch peak, running across a Standard_D4s_v5 node pool that never scaled below 4 nodes even at 3 a.m. Monthly AKS compute was about ₹92,000, and the platform lead could see on the cost dashboard that most of it was idle capacity carrying two always-on eight-replica Deployments through eighteen hours of near-silence a day.
The team’s first mistake was reaching for a CPU HPA. They set targetCPUUtilization: 60 and watched it do nothing useful: during a genuine 42,000-message Kafka backlog at 6 p.m., the consumers ran at 14% CPU (blocked on the payment provider’s API, not the CPU), so the HPA held at its floor while lag climbed and checkout confirmations lagged by minutes. Worse, at 2 a.m. with the topic empty, the HPA couldn’t scale below 1, so both Deployments kept a pod — and two nodes — alive all night. The proxy metric was simply wrong for an I/O-bound consumer, and scale-to-zero was impossible.
They installed KEDA (Helm, pinned to 2.15.1, workload identity on the operator) and replaced both HPAs with ScaledObjects. The Kafka ScaledObject used lagThreshold: 500, maxReplicaCount: 30 (the partition count), minReplicaCount: 0, and cooldownPeriod: 120. The first night went wrong in an instructive way: the consumer took ~45 seconds to join the group and warm its connection pool after idle, so the first messages of the morning burst ate that cold start, and a support ticket landed about “slow first order of the day.” The fix was not to abandon scale-to-zero but to set minReplicaCount: 1 on the Kafka consumer (latency-critical checkout path) while keeping minReplicaCount: 0 on the Service Bus invoice worker (a batch path where a few seconds after a lull is invisible). They also added activationLagThreshold: 50 so a stray heartbeat message wouldn’t wake the whole Deployment.
The second issue was self-inflicted and is the most common KEDA failure: a leftover CPU HPA. An engineer had forgotten to delete the old payments-consumer HPA before applying the ScaledObject, so for a day two controllers fought over the replica count and the Deployment oscillated between 2 and 9 every couple of minutes. kubectl get hpa -n orders showed two HPAs on the same target — the old one and keda-hpa-payments-consumer. Deleting the stray HPA settled it instantly.
Once stable, the numbers told the story. During the overnight trough, invoice-worker sat at 0 replicas and payments-consumer at 1; their pods drained, the cluster autoscaler removed nodes, and the pool floated down to 2 nodes. At the 6 p.m. peak, payments-consumer scaled to 24 (12,000 lag / 500) within one 15-second polling interval and invoice-worker to 35, then both scaled back over the next hour under a 300-second scale-down window that stopped them thrashing on the tail of the backlog. Monthly AKS compute dropped from ₹92,000 to ~₹41,000. The lesson on the wall: “Autoscale on the backlog, not on a proxy — and always delete the old HPA.”
The before/after, as numbers:
| Metric | Before (fixed + CPU HPA) | After (KEDA) |
|---|---|---|
| Overnight replicas (each consumer) | 8 + 8 | 1 (Kafka) + 0 (SB) |
| Node pool floor | 4 nodes | 2 nodes |
| Peak reaction to 12k lag | HPA never reacted (low CPU) | 24 replicas in ~15 s |
| Scale-to-zero possible | No (HPA floor = 1) | Yes (SB worker) |
| Monthly AKS compute | ₹92,000 | ~₹41,000 |
| First-order-of-day latency | n/a | Fixed via minReplicaCount: 1 on Kafka |
Advantages and disadvantages
KEDA is the right tool for event-driven scaling, but it is not free of trade-offs — weigh them honestly:
| Advantages | Disadvantages |
|---|---|
| Scales on the real backlog (lag, queue depth), not a CPU proxy | Adds a cluster component to operate, patch, and monitor |
| True scale-to-zero — releases pods and (via CA) nodes | Scale-to-zero adds cold-start latency on the first message after idle |
| 70+ scalers — Kafka, Service Bus, RabbitMQ, SQS, Prometheus, Redis… | Each scaler has its own metadata quirks to learn |
| Re-uses the standard HPA for 1→N (native behavior, no new mental model) | You must not also create your own HPA — a classic footgun |
| CRDs live in Git — GitOps-friendly, reviewed, revertible | A bad maxReplicaCount in a PR can over-scale until caught |
| Secretless auth via workload identity / TriggerAuthentication | Auth misconfig silently freezes scaling (needs alerting) |
| Multiple triggers, max-wins, on one workload | pollingInterval/cooldown are per-object, not per-trigger |
| CNCF-graduated, widely adopted, low overhead | Wrong lagThreshold/messageCount over- or under-scales |
KEDA is right whenever the load signal lives outside the pod — message consumers, batch triggered by queue depth, anything with a bursty demand curve and a real “no work” state. It is overkill for a steady CPU-bound web API (a plain HPA is simpler) and it does not replace node autoscaling — pods scaling to zero only saves money if the cluster autoscaler or Karpenter then removes the empty nodes. The disadvantages are all manageable if you know they exist: alert on scaler errors, never double-HPA, size thresholds from measurement, and gate changes through review.
Hands-on lab
This lab installs KEDA on any Kubernetes cluster, proves scale-to-zero and scale-out against a Service Bus queue, and tears down cleanly. It is the centerpiece — do it once by hand and the YAML above stops being abstract. It uses Azure Service Bus (a Standard namespace is cheap and deletes in seconds) because it needs no self-managed broker; the Kafka path is identical in shape. Run in a shell with az, kubectl, and helm v3.12+.
Step 1 — Variables and a namespace.
RG=rg-keda-lab
LOC=centralindia
SBNS=sbkedalab$RANDOM        # globally-unique Service Bus namespace
QUEUE=invoices
NS=orders
az group create -n $RG -l $LOC -o table
kubectl create namespace $NS
Step 2 — Create a Service Bus namespace and queue.
az servicebus namespace create -g $RG -n $SBNS --sku Standard -o table
az servicebus queue create -g $RG --namespace-name $SBNS -n $QUEUE -o table
Expected: a namespace row (sku.name = Standard) and a queue row for invoices.
Step 3 — Install KEDA with Helm. Pin the version — never track latest on a component that controls replica counts cluster-wide.
helm repo add kedacore https://kedacore.github.io/charts
helm repo update
kubectl create namespace keda
helm install keda kedacore/keda --namespace keda --version 2.15.1
Step 4 — Verify the control plane and the one smoke test that matters.
kubectl get pods -n keda
# keda-operator-...                 1/1  Running
# keda-operator-metrics-apiserver-* 1/1  Running
# keda-admission-webhooks-*         1/1  Running

kubectl get crd | grep keda.sh
# scaledobjects.keda.sh / scaledjobs.keda.sh / triggerauthentications.keda.sh / ...

kubectl get apiservice v1beta1.external.metrics.k8s.io
# NAME                            SERVICE                              AVAILABLE
# v1beta1.external.metrics.k8s.io keda/keda-operator-metrics-apiserver True
If v1beta1.external.metrics.k8s.io is not True, KEDA cannot serve metrics to the HPA and no scaling will happen — this is the single most useful smoke test on the whole install.
Step 5 — Deploy a consumer that drains the queue. For the lab, use a tiny receiver image (any image that receives from Service Bus works; a Deployment that sleeps is enough to observe scaling, since we only care about replica counts here):
cat <<'EOF' | kubectl apply -f -
apiVersion: apps/v1
kind: Deployment
metadata:
  name: invoice-worker
  namespace: orders
spec:
  replicas: 1
  selector: { matchLabels: { app: invoice-worker } }
  template:
    metadata: { labels: { app: invoice-worker } }
    spec:
      containers:
        - name: worker
          image: busybox:1.36
          command: ["sh","-c","echo draining invoices; sleep 3600"]
EOF
Step 6 — Create the auth Secret and TriggerAuthentication. For a lab, a connection string is the fastest path (production uses workload identity — see the auth section). Grab a listen-only connection string and store it as a Secret:
CONN=$(az servicebus namespace authorization-rule keys list \
  -g $RG --namespace-name $SBNS --name RootManageSharedAccessKey \
  --query primaryConnectionString -o tsv)

kubectl create secret generic sb-conn -n orders --from-literal=connection="$CONN"

cat <<'EOF' | kubectl apply -f -
apiVersion: keda.sh/v1alpha1
kind: TriggerAuthentication
metadata:
  name: sb-lab-auth
  namespace: orders
spec:
  secretTargetRef:
    - parameter: connection
      name: sb-conn
      key: connection
EOF
Step 7 — Apply the ScaledObject.
cat <<'EOF' | kubectl apply -f -
apiVersion: keda.sh/v1alpha1
kind: ScaledObject
metadata:
  name: invoice-worker
  namespace: orders
spec:
  scaleTargetRef:
    name: invoice-worker
  pollingInterval: 15
  cooldownPeriod: 60
  minReplicaCount: 0
  maxReplicaCount: 10
  triggers:
    - type: azure-servicebus
      metadata:
        queueName: invoices
        messageCount: "5"
        activationMessageCount: "1"
      authenticationRef:
        name: sb-lab-auth
EOF
Step 8 — Watch it scale to zero. With the queue empty, KEDA deactivates the Deployment after the cooldown:
kubectl get scaledobject invoice-worker -n orders
# NAME             SCALETARGETKIND       MIN  MAX  READY  ACTIVE  ...
# invoice-worker   apps/v1.Deployment    0    10   True   False

kubectl get deploy invoice-worker -n orders -w
# within ~60s (cooldownPeriod): replicas -> 0
READY: True proves the scaler authenticated; ACTIVE: False with 0 replicas proves scale-to-zero fired.
Step 9 — Flood the queue and watch it scale out. Push 40 messages; at messageCount: 5 KEDA should target 8 replicas (capped at 10):
for i in $(seq 1 40); do
  az servicebus queue send -g $RG --namespace-name $SBNS \
    --queue-name $QUEUE --body "invoice-$i" >/dev/null
done

kubectl get deploy invoice-worker -n orders -w
# 0 -> 1 (activation) -> up toward 8 within one pollingInterval (~15s)

kubectl get hpa keda-hpa-invoice-worker -n orders
# KEDA's managed HPA — the 1->N driver
Step 10 — Inspect KEDA’s reasoning. When scaling looks wrong, these two commands tell you why:
kubectl describe scaledobject invoice-worker -n orders
# Events + conditions: Ready, Active, and any auth/connection errors

kubectl logs -n keda -l app=keda-operator --tail=100 | grep invoice-worker
Because the busybox “worker” doesn’t actually consume, the messages stay in the queue and the Deployment holds at its computed max — exactly the behaviour you’d see with a real-but-too-slow consumer, which is a useful thing to have seen.
Validation checklist. You installed KEDA, confirmed the external-metrics apiservice is True, wired a Service Bus trigger through a TriggerAuthentication, watched a Deployment scale to zero on an empty queue and out on a 40-message backlog, and read KEDA’s own reasoning from describe and operator logs. Each step mapped to a real mechanic:
| Step | What you did | What it proves |
|---|---|---|
| 4 | Checked external.metrics.k8s.io = True |
Metrics adapter can feed the HPA |
| 6–7 | TriggerAuthentication + ScaledObject | The auth-and-trigger wiring end to end |
| 8 | Saw replicas → 0 | Scale-to-zero and cooldown work |
| 9 | Saw replicas climb on backlog | ceil(messages / messageCount) sizing |
| 10 | Read describe + operator logs |
The two diagnostic commands you’ll live in |
Teardown. KEDA is non-destructive to remove, but delete ScaledObjects before uninstalling so no finalizer hangs:
kubectl delete scaledobject,triggerauthentication --all -n orders
helm uninstall keda -n keda
kubectl delete namespace keda orders
az group delete -n $RG --yes --no-wait     # removes the Service Bus namespace
Common mistakes & troubleshooting
Two failures dominate KEDA operations — “it won’t scale” and “the scaler lost auth and froze” — and both have crisp fingerprints. This is the playbook: symptom → root cause → how to confirm → fix.
| # | Symptom | Root cause | Confirm with | Fix |
|---|---|---|---|---|
| 1 | ScaledObject READY: False |
Scaler can’t reach the source / bad metadata | kubectl describe scaledobject <n> (Events) |
Fix connection metadata / auth; see rows 2–3 |
| 2 | ACTIVE: False under real load |
Broken TriggerAuthentication (wrong client ID, role not propagated) |
kubectl logs -n keda -l app=keda-operator shows 401/403 |
Fix identity ID / grant Data Receiver / wait for role propagation |
| 3 | Deployment oscillates every few min | A leftover CPU HPA on the same target | kubectl get hpa -n <ns> shows two HPAs |
Delete the stray HPA; let KEDA own scaling |
| 4 | Never scales beyond N despite huge backlog | maxReplicaCount too low, or Kafka partition ceiling |
kubectl get scaledobject MAX; topic partition count |
Raise maxReplicaCount up to partition count |
| 5 | Scales to ceiling and never back | Consumer isn’t committing offsets → lag never drops | Check committed offset lag on the broker | Fix the consumer’s offset commit; KEDA only reads |
| 6 | Won’t scale to zero | minReplicaCount > 0, or cooldownPeriod not elapsed |
kubectl get scaledobject MIN; wait cooldown |
Set minReplicaCount: 0; verify metric truly at 0 |
| 7 | Wakes on a trickle of messages | activationThreshold at default 0 |
Inspect trigger metadata | Set activation*Threshold above the noise floor |
| 8 | Scaling frozen at last value silently | Scaler erroring; keda_scaled_object_errors > 0 |
Prometheus metric; operator logs | Alert on the metric; fix the underlying scaler error |
| 9 | helm uninstall hangs |
A ScaledObject finalizer stuck (HPA mid-reconcile) | kubectl get scaledobject still present |
Delete ScaledObjects first, then uninstall |
| 10 | Metrics apiservice not True |
Metrics adapter unhealthy / not registered | kubectl get apiservice v1beta1.external.metrics.k8s.io |
Restart/reinstall metrics adapter; check its pod |
| 11 | Replicas thrash on the backlog tail | No scale-down stabilization window | kubectl describe hpa keda-hpa-<n> |
Add scaleDown.stabilizationWindowSeconds |
| 12 | Extra Kafka pods idle, rebalance storms | maxReplicaCount > partitions |
Topic partition count vs MAX | Cap MAX at partition count; keep allowIdleConsumers: false |
| 13 | Two triggers, one froze, scaling stuck | A broken trigger pins the max | Per-trigger errors in operator logs | Fix/remove the broken trigger; alert per object |
| 14 | Lost messages when scaling in | Consumer doesn’t handle SIGTERM |
Reproduce a scale-in; check for uncommitted offsets | Handle SIGTERM (commit/complete); raise grace period |
The two big ones, in prose:
“It won’t scale.” Ninety percent of the time it is one of three things, in this order: (a) the ScaledObject isn’t READY — run kubectl describe scaledobject <name> and read the Events; a READY: False almost always means the scaler can’t reach the source (bad bootstrapServers/namespace, or auth). (b) A stray HPA — kubectl get hpa and if you see two on one target, delete the non-KEDA one. © The ceiling — maxReplicaCount is lower than the backlog demands, or (Kafka) it’s above the partition count so extra pods can’t help.
“The scaler lost auth and froze.” A scaler that can’t authenticate will keep the workload at its last replica count and quietly stop reacting — the most dangerous KEDA failure because nothing looks broken until backlog piles up. The fingerprint is ACTIVE: False (or a stuck value) under obvious load, plus 401/403 in kubectl logs -n keda -l app=keda-operator. Causes: wrong identityId in the TriggerAuthentication, the Data Receiver role never assigned or not yet propagated (Azure RBAC can take minutes), a Secret rotated out from under the reference, or (workload identity) the federated credential subject not matching system:serviceaccount:keda:keda-operator. Always alert on keda_scaled_object_errors > 0 so a frozen scaler pages you instead of surprising you at the next peak.
Best practices
- Delete any pre-existing HPA on a workload before applying its ScaledObject. KEDA creates its own
keda-hpa-<name>; two controllers on one replica count oscillate forever. This is the single most common footgun. - Cap
maxReplicaCountat the Kafka partition count. More consumers than partitions idle and trigger rebalance storms. KeepallowIdleConsumers: false(the default) as a guardrail. - Size
lagThreshold/messageCountfrom a measurement, not a guess. Measure one replica’s steady drain rate, then set the threshold near what it clears in onepollingInterval. - Use the activation threshold to stop flapping. Set
activationLagThreshold/activationMessageCountabove the noise floor so a stray heartbeat doesn’t wake a scaled-to-zero Deployment. - Scale out fast, scale in slow. Asymmetric HPA
behavior—scaleUp.stabilizationWindowSeconds: 0, ascaleDownwindow of a few minutes — because backlog is latency and mid-batch pod kills are expensive. - Reserve
minReplicaCount: 0for tolerant paths; keep1for latency-critical ones. Scale-to-zero saves money but adds cold-start latency on the first message. - Handle
SIGTERMin the consumer — commit offsets, complete/abandon the in-flight message — and setterminationGracePeriodSecondsto cover the longest batch, so scale-in never drops or double-processes. - Prefer workload identity over stored credentials for the scalers; where a static credential is unavoidable, lease it from Vault into a short-lived Secret, never commit it.
- Keep the scaler identity and consumer identities separate, each with only the least-privilege Data Receiver role on the entity it reads.
- Alert on
keda_scaled_object_errors > 0— a non-zero value usually means a scaler lost auth and scaling has silently frozen. - Manage ScaledObjects through GitOps — they are first-class Kubernetes objects; ship them via Argo CD/Flux so a
maxReplicaCount: 5000is caught in review. See Argo CD: SSO, RBAC & ApplicationSets. - Pin the KEDA chart version. Never track
lateston a component that controls replica counts cluster-wide; upgrade deliberately.
Security notes
KEDA’s security posture reduces to three ideas: least-privilege identities, no stored secrets, and gated changes. Give KEDA’s scaler identity and each consumer identity only the Data Receiver role on the specific namespace/entity it reads — neither needs Send, Manage, or Owner. Prefer Entra workload identity over connection strings everywhere; the whole point of the TriggerAuthentication + federated credential setup is that no broker password or Service Bus connection string ever lands in a Kubernetes Secret. Where a static SASL credential is genuinely unavoidable (a self-managed Kafka cluster), lease it from HashiCorp Vault into a short-lived Kubernetes Secret via the External Secrets Operator rather than committing it to Git.
Scope the KEDA operator’s Kubernetes RBAC to the namespaces it manages, and use a ClusterTriggerAuthentication only when a shared identity across namespaces is genuinely required — a namespaced TriggerAuthentication is the tighter default. Gate every ScaledObject change through the GitOps pull-request flow so a malicious or accidental maxReplicaCount: 5000 is caught in review, not in your cloud bill. Finally, treat a non-zero keda_scaled_object_errors as a security-adjacent signal: it can mask a quietly frozen workload (backlog silently building) or a quietly over-scaling one (a scaler misreading depth), both of which have cost and availability consequences.
The identity/permission summary:
| Principal | Grant | Scope | Never grant |
|---|---|---|---|
| KEDA scaler identity | Data Receiver (read depth) | Namespace it reads | Sender, Manage, Owner |
| Consumer pod identity | Data Receiver (consume) | The one entity it drains | Cross-entity, Send |
| KEDA operator RBAC | Reconcile scaled objects | Its managed namespaces | Cluster-admin |
| GitOps controller | Apply ScaledObjects | The app repos | Direct kubectl in prod |
Cost & sizing
The point of the whole exercise is the cost line. Scaling on real backlog with minReplicaCount: 0 means a consumer Deployment consumes zero pod resources during the trough instead of a peak-sized floor — and when its pods drain, the cluster autoscaler or Karpenter removes the now-empty nodes, turning saved pod-hours into saved VM-hours, which is where the real money is. KEDA itself is free and its overhead is tiny (the operator and metrics adapter are small pods); the savings are entirely in the workloads it right-sizes.
Two sizing errors both cost money, in opposite directions. Set lagThreshold/messageCount too aggressive (small) and you over-provision — more replicas than the work needs, more nodes, a bigger bill for idle capacity. Set them too conservative (large) and you under-provision — backlog and end-to-end latency build, breaching an SLA whose penalty shows up elsewhere. Size from measurement (one replica’s drain rate) and revisit as throughput changes.
What drives the bill, and the lever:
| Cost driver | Lever | Effect |
|---|---|---|
| Idle overnight replicas | minReplicaCount: 0 + cluster autoscaler |
Pods → 0, empty nodes removed → VM-hours saved |
| Over-scaling at peak | Right-size lagThreshold/messageCount |
Fewer replicas for the same throughput |
| Cold-start pain forcing a floor | minReplicaCount: 1 on latency paths only |
Small always-on cost, big latency win where it matters |
| Broker admin-API calls | pollingInterval (don’t over-poll) |
Avoids Service Bus management throttling/charges |
| Node fragmentation | Bin-packing / node pool sizing | Empty nodes actually removable |
Rough figures from the Meridian scenario: collapsing two always-on eight-replica Deployments to demand-driven, scale-to-zero workloads on a Standard_D4s_v5 pool took the node floor from 4 to 2 and cut monthly AKS compute from ₹92,000 to ~₹41,000 (about US$490), with KEDA adding no meaningful cost of its own. Pipe KEDA’s replica-count and keda_scaler_metrics_value (observed lag/queue depth) to your dashboard alongside node count so the savings are visible on the same chart the platform lead used to justify the work.
Interview & exam questions
1. Why does a CPU-based HPA fail for a Kafka consumer, and what does KEDA do differently? A message consumer is I/O-bound on the broker, so CPU stays low even as backlog explodes — CPU is a poor proxy for pending work. KEDA reads the actual backlog (consumer lag, queue depth) and scales on that directly, and it can scale to zero, which an HPA (floor of 1) cannot.
2. What are the two KEDA components and how do they split the work? The operator watches ScaledObjects and owns the 0↔1 transition (activate/deactivate). The metrics adapter registers as the external-metrics API server and feeds the backlog to a managed HPA that KEDA creates to handle the 1↔N range. KEDA does 0↔1; the HPA does 1↔N.
3. When do you use a ScaledJob instead of a ScaledObject? Use a ScaledJob for discrete, long-running, isolated units of work (transcode, report generation) where each item gets its own pod that runs to completion. Use a ScaledObject for long-running stream consumers that re-use warm pods across many messages.
4. Why must maxReplicaCount respect the Kafka partition count?
A consumer group allows at most one active consumer per partition; replicas beyond the partition count get no assignment, idle, and trigger rebalance storms. Cap maxReplicaCount at the partition count (and KEDA’s allowIdleConsumers: false enforces it by default).
5. Explain the difference between the scaling threshold and the activation threshold.
The scaling threshold (lagThreshold, messageCount) sizes the 1→N math: desiredReplicas = ceil(metric / threshold). The activation threshold (activationLagThreshold, etc.) is a separate gate on the 0→1 transition — the metric must exceed it before KEDA wakes a scaled-to-zero workload. One sizes; the other decides whether to leave zero.
6. How does KEDA authenticate to Azure Service Bus without a connection string?
Via a TriggerAuthentication with podIdentity: azure-workload, backed by a user-assigned identity federated to the KEDA operator’s service account and granted Azure Service Bus Data Receiver. The scaler reads depth as that identity; no secret lives in the cluster.
7. You applied a ScaledObject and the Deployment now oscillates every few minutes. Cause?
Almost certainly a leftover CPU HPA on the same Deployment fighting KEDA’s managed keda-hpa-<name>. kubectl get hpa shows two; delete the non-KEDA one.
8. What happens with multiple triggers on one ScaledObject? KEDA computes the desired replicas per trigger and takes the maximum; any one trigger crossing its threshold scales the whole workload. It scales to zero only when all triggers are below their activation thresholds.
9. Your scaler shows ACTIVE: False under heavy load. First move?
Suspect broken auth. Check kubectl logs -n keda -l app=keda-operator for 401/403, verify the identityId/Secret in the TriggerAuthentication, and confirm the Data Receiver role is assigned and has propagated. A scaler that loses auth freezes scaling silently.
10. Why is cooldownPeriod about the 1→0 hop specifically?
cooldownPeriod governs how long the metric must stay below activation before the last replica is removed (deactivation). The 1→N scale-in is governed by the HPA’s scaleDown behavior, not cooldownPeriod.
11. What must the consumer do to make scale-to-zero safe?
Handle SIGTERM gracefully — commit the current Kafka offset and complete/abandon the in-flight Service Bus message — and have a terminationGracePeriodSeconds long enough for the batch, so scaling in never drops or double-processes messages.
12. How does pod scale-to-zero translate into actual cost savings? Pods scaling to zero only saves money if the cluster autoscaler/Karpenter then removes the empty nodes, converting saved pod-hours into saved VM-hours. KEDA is the pod-level half; node autoscaling is the other half.
These map to the CKA/CKAD ecosystem (HPA, autoscaling), Azure’s AZ-204/AZ-305 (Service Bus, Event Hubs, AKS scaling patterns), and any Kubernetes platform-engineering interview.
Quick check
- Which KEDA component owns the 0↔1 transition, and which drives the 1↔N range?
- A topic has 24 partitions and lag hits 30,000 at
lagThreshold: 500. How many replicas does KEDA run, and why not 60? - You want a Deployment to not wake for a 3-message trickle but to size normally above that. Which field(s) do you set?
- What is the single most useful smoke test right after installing KEDA?
- A ScaledObject won’t scale out despite a huge backlog. Name the three most likely causes in order.
Answers
- The operator owns 0↔1 (activate/deactivate to and from zero); the managed HPA (fed by KEDA’s metrics adapter) drives 1↔N.
ceil(30000/500) = 60, but it is capped at 24 — the partition count — because a consumer group allows at most one active consumer per partition, so replicas beyond 24 would idle. SetmaxReplicaCount: 24.- Set
activationLagThreshold(Kafka) /activationMessageCount(Service Bus) to just above 3 — the activation threshold gates the 0→1 wake without changing thelagThreshold/messageCountthat sizes 1→N. kubectl get apiservice v1beta1.external.metrics.k8s.io— it must beTrue, or the metrics adapter can’t feed the HPA and nothing scales.- (a) The
ScaledObjectisn’tREADY(scaler can’t reach the source / auth) —kubectl describe scaledobject. (b) A leftover HPA fighting KEDA —kubectl get hpa. ©maxReplicaCounttoo low or above the Kafka partition ceiling.
Glossary
- KEDA — Kubernetes Event-Driven Autoscaling; a CNCF add-on that scales workloads on external event sources and enables scale-to-zero.
- ScaledObject — the CRD that scales a long-running Deployment/StatefulSet on one or more triggers.
- ScaledJob — the CRD that spawns a Kubernetes Job per unit of work, up to a concurrency limit.
- Operator — the KEDA component that reconciles ScaledObjects and owns the 0↔1 (activation/deactivation) transitions.
- Metrics adapter — the KEDA component registered as the external-metrics API server (
v1beta1.external.metrics.k8s.io) that feeds the HPA. - Scaler / trigger — a plug-in (Kafka, Azure Service Bus, Prometheus, …) that reports how much work is waiting on one source.
- Consumer lag — for Kafka,
latestOffset − committedOffsetacross a group’s partitions; the backlog KEDA scales on. lagThreshold— Kafka messages of lag targeted per replica;desiredReplicas = ceil(lag / lagThreshold).messageCount— Service Bus active messages targeted per replica;desiredReplicas = ceil(activeMessages / messageCount).- Activation threshold — the metric floor that gates the 0→1 transition, separate from the scaling threshold.
cooldownPeriod— seconds the metric must stay below activation before the last replica is removed (→ 0).pollingInterval— seconds between a scaler’s backlog checks; the reaction-latency vs broker-load knob.- TriggerAuthentication — a namespaced CRD holding the auth (workload identity, Secret, Vault) a trigger references.
- Managed HPA — the
keda-hpa-<name>HorizontalPodAutoscaler KEDA creates per ScaledObject; never create your own alongside it. - Workload identity — Entra federation of a user-assigned identity to a Kubernetes service account, so pods authenticate to Azure without secrets.
- Partition ceiling — the Kafka rule that useful replicas ≤ topic partitions (one active consumer per partition).
Next steps
- Deepen the AKS-native KEDA path with AKS KEDA: Event-Driven Autoscaling Scalers Setup.
- Close the loop on node cost with AKS Cluster Autoscaler vs Node Autoprovisioning (Karpenter) so scaled-to-zero pods actually free nodes.
- Compare HTTP scale-to-zero models in Container Apps: Your First Microservice with Scale-to-Zero and Knative Serving: Scale-to-Zero for HTTP Workloads.
- Ground the sources in Azure Event Hubs: Partitions, Consumer Groups & Offsets and Service Bus: Queues vs Topics — When to Use Which.
- Ship your ScaledObjects the GitOps way with Argo CD: SSO, RBAC & ApplicationSets and keep broker secrets out of Git with External Secrets Operator with Vault.