Quick take: Blue-green gives instant cutover and instant rollback at the cost of double infrastructure. Canary gives gradual, metric-gated risk exposure at the cost of tooling and analysis. Rolling is the cheapest and the default, but it is the slowest to detect failure and the messiest to roll back. The right strategy is the one whose blast radius and recovery time fit your risk tolerance — and most mature teams run two or three of them at once for different services.
At 19:40 on a Friday an online retailer pushed a new checkout service with a plain rolling update. The new version compiled, passed CI, and started fine — so the platform happily replaced old pods with new ones, three at a time. The bug was in a code path that only fired when a discount coupon met a specific tax rule, so the readiness probe stayed green the whole time. By the time the error rate alert paged someone, 30% of live checkouts were failing and the rolling update was 60% complete, which meant the rollback also had to roll backward through a half-migrated fleet. The incident ran 47 minutes. The fix was not a better coupon parser. It was a better deployment strategy: the same change behind a canary would have sent 5% of traffic to the new version, an automated analysis would have caught the elevated error rate inside two minutes, and the rollout would have aborted before the second user was affected.
This article is the field guide to that decision. A deployment strategy is the procedure by which you replace a running version of a service with a new one — specifically how many users see the new version at each moment, how you decide it is healthy, and how fast you can undo it if it is not. We take the five strategies that matter in production — recreate, rolling update, blue-green, canary, and A/B testing — and for each lay out the mechanics, the traffic-shifting controls, the health gates that promote or abort it, the rollback path, the Kubernetes and cloud-load-balancer specifics, the database-compatibility trap that breaks all of them, and the cost. Because you will return to this mid-incident and mid-design-review, every comparison and limit lives in a scannable table. You will stop treating “deploy” as one verb, and learn the rule that ties the strategies together: a deployment strategy is only as good as the health signal that drives it and the schema discipline underneath it.
What problem this solves
Every deployment is a bet that the new version is at least as good as the old one. You lose that bet more often than you would like — a config typo, an unhandled null, a dependency that times out under load, a memory leak that shows after an hour, a migration that locks a table. The deployment strategy controls how expensive losing the bet is. Without one you have a single mode: replace everything and hope. When the hope fails, every user is on the broken version and recovery is a full redeploy of the old one — minutes you do not have while revenue bleeds.
What breaks without a deliberate strategy: the blast radius is always 100% (a bad release hits everyone at once), detection is slow (you find out from customer complaints, not a 5%-cohort metric), and rollback is a deploy, not a switch — so your mean time to recovery is bounded below by your build-and-deploy time, often 10–30 minutes. “We’ll just be careful” works until the one change nobody scrutinised takes the site down at peak.
Who hits this: everyone who ships more than occasionally, but hardest on high-traffic customer-facing services (100% blast radius is an outage in the press), services with chatty downstream dependencies (the new version’s behaviour only shows under real traffic), and teams running shared databases (where the deployment strategy and the schema migration strategy are the same problem wearing two hats). The fix is rarely “deploy more carefully” — it is “pick the strategy whose blast radius and recovery time you can live with, wire a real health signal to it, and make the database backward-compatible so the strategy can actually roll back.”
To frame the whole field before the deep dive, here is every strategy this article covers, the one sentence that defines it, and the single property that decides whether it is the right tool:
| Strategy | One-line definition | Blast radius during rollout | Rollback speed | Extra capacity needed | Decided by |
|---|---|---|---|---|---|
| Recreate | Stop all old, then start all new | 100% (full downtime) | Redeploy old (slow) | None | Can you take downtime? |
| Rolling update | Replace instances in batches | Grows with each batch | Roll forward/back through batches | ~1 batch (surge) | Is slow detection acceptable? |
| Blue-green | Two full environments, switch traffic atomically | 0% then 100% at the switch | Instant (switch back) | 2× (a full second environment) | Do you need atomic, instant rollback? |
| Canary | Small % to new version, grow if metrics are healthy | Capped at the canary % | Instant (route 0% to canary) | Small (the canary fleet) | High traffic + metric tooling? |
| A/B testing | Route cohorts to variants to compare a metric | Defined by the experiment | Switch cohort routing | Small (variant fleet) | Is this a product experiment, not just a release? |
Learning objectives
By the end of this article you can:
- Define each of the five deployment strategies precisely in terms of blast radius, detection time, rollback mechanism, and capacity cost — and explain which property makes each one the right or wrong choice.
- Implement a rolling update in Kubernetes with
maxSurge/maxUnavailabletuned correctly, and explain exactly how a readiness probe gates each batch. - Stand up a blue-green cutover using either a Kubernetes Service label switch or a cloud load-balancer target-group swap, and execute an instant rollback.
- Run a canary with progressive traffic weights (5% → 25% → 50% → 100%), wired to an automated analysis that promotes or aborts on real metrics — using Argo Rollouts and a service mesh, or a cloud weighted router.
- Distinguish canary from A/B testing, and know when “send 10% of traffic somewhere” is a safety mechanism versus a product experiment.
- Make a database schema-compatible across versions (expand/contract migrations) so that any of these strategies can actually roll back without data loss.
- Choose the right strategy per service using an explicit decision matrix, and estimate the cost of each in INR/USD for a realistic fleet.
Prerequisites & where this fits
You should already understand a CI/CD pipeline — that code is built into an immutable artifact (a container image, a zip, a package) and that “deploy” means rolling that artifact into an environment. If that is fuzzy, read CI/CD Pipelines Explained: From Code Commit to Production first; deployment strategies are the last mile of that pipeline. You should know the basics of a load balancer (it spreads requests across backends and can stop sending to an unhealthy one) and, for the Kubernetes sections, what a Pod, Deployment and Service are.
This sits in the release engineering track. It is the concrete mechanics underneath the broader discipline of Progressive Delivery and Feature Flags: Release Without Fear — progressive delivery is the philosophy (decouple deploy from release, expose change gradually, automate the decision); the strategies here are how you do it at the infrastructure layer. It depends hard on a real health signal, which is why DevOps Observability: Logs, Metrics, Traces and SLOs is effectively a co-requisite — a canary with no metrics is just a slow rolling update. When you operate these via Git, the controller is usually GitOps with Argo CD and Flux: Deliver from Git. And the upstream decision of what branch produces a deployable artifact comes from your Git Branching Strategies: Trunk-Based, GitFlow and Feature Branches.
A quick map of who owns what during a deployment, so you escalate to the right person when one goes wrong:
| Layer | What lives here | Who usually owns it | Failure it can cause |
|---|---|---|---|
| Artifact / image | The immutable thing you ship | App / dev team | Broken code, missing dependency |
| Pipeline / controller | The thing that orchestrates the rollout | Platform / DevOps | Bad rollout config, no health gate |
| Traffic router (LB / Service / mesh) | What decides who sees which version | Platform / network | Wrong weights, sticky sessions, no drain |
| Health signal (probe / metrics) | What says “this version is OK” | App + platform | Lying probe, no SLO, slow detection |
| Database / schema | Shared state both versions touch | App + DBA | Incompatible migration → can’t roll back |
| Config / feature flags | Runtime switches independent of deploy | App team | Flag and deploy coupled → no decouple |
Core concepts
Six ideas make every later section obvious. Pin these first.
Deploy is not release. Deploying means the new version’s process is running somewhere. Releasing means real user traffic reaches it. The entire art of safe deployment is widening the gap between these two events — deploy the new version with zero traffic, prove it is healthy, then release traffic to it gradually. Recreate collapses the gap to zero (deploy = release = everyone). Blue-green and canary deliberately separate them. Feature flags push the separation all the way into the running process so you can release a code path without any deploy at all.
Blast radius is the fraction of users on the new version at the worst moment. It is the single number that distinguishes the strategies. Recreate has a blast radius of 100% (and a window of full downtime). Rolling grows the blast radius batch by batch — at 60% rolled out, 60% of users can hit the bug. Canary caps the blast radius at the canary weight: if 5% of traffic is on the canary and you abort, only 5% ever saw the bug. Blue-green is bimodal — 0% before the switch, 100% after — so its safety comes not from a small blast radius but from an instant rollback.
Detection time is how long the bad version runs before you know. A bug is only as dangerous as blast_radius × detection_time × traffic. Rolling’s weakness is detection time: if your only signal is a readiness probe (which checks “is the process up,” not “is the logic correct”), a logically-broken-but-process-healthy version sails through the entire rollout. Canary pairs a small blast radius with fast, automated detection — an analysis that compares the canary’s error rate and latency against the baseline every minute and aborts on a breach.
Rollback is either a switch or a deploy — and that difference is everything. Blue-green and canary roll back by re-routing traffic (flip the Service label, set canary weight to 0), an operation that takes seconds and touches no build system. Recreate and rolling roll back by deploying the previous version, bounded below by your build-and-deploy time and, for rolling, rolling through batches. The MTTR gap between “flip a label” (5 seconds) and “redeploy the old image through 10 batches” (8 minutes) is the gap between a non-event and an incident review.
The health gate is what promotes or aborts the rollout. Every progressive strategy needs a signal that answers “is the new version OK to give more traffic?” The crude gate is a readiness probe (HTTP 200 on /healthz). The real gate is an analysis over golden signals — error rate, p95/p99 latency, saturation, and ideally a business metric (checkout success, add-to-cart rate). A canary without a real analysis gate is theatre: you have the small blast radius but you still detect failures by hand, slowly.
The database is the strategy’s hidden dependency. Both the old and new versions of your code talk to the same database during any non-recreate rollout. If the new version’s migration drops a column the old version still reads, the old version breaks the instant the migration runs — and now you cannot roll back, because rolling back the code does not roll back the schema. Every strategy in this article assumes backward-compatible, expand/contract migrations. Skip that discipline and your “instant rollback” is a lie.
The vocabulary in one table
Before the deep sections, the moving parts side by side. The glossary at the end repeats these for lookup:
| Term | One-line definition | Why it matters to deployment |
|---|---|---|
| Blast radius | Fraction of users on the new version at the worst moment | The core safety number per strategy |
| Detection time | How long a bad version runs before you know | Multiplies blast radius into total harm |
| MTTR | Mean time to recovery — how long to get back to good | Switch (seconds) vs redeploy (minutes) |
| Readiness probe | Check that says “this instance can take traffic” | Gates rolling batches; a weak health signal |
| Liveness probe | Check that says “restart me if I fail this” | Recovers a hung process; not a rollout gate |
| Surge / unavailable | Extra/old capacity allowed during a rolling update | Tunes speed vs availability of a rolling update |
| Traffic weight | % of requests sent to a version | The canary’s primary control knob |
| Analysis / metric gate | Automated check that promotes or aborts a rollout | What turns a canary from theatre into safety |
| Bake time | How long to hold a canary step before judging it | Too short → miss slow leaks; too long → slow ship |
| Expand/contract | Two-phase backward-compatible schema migration | What makes rollback actually possible |
| Sticky session | Pinning a client to one backend | Can trap users on the wrong version |
| Connection draining | Letting in-flight requests finish before kill | Avoids 502s during a cutover |
The five strategies side by side
Before going deep on each, here is the master comparison — the table you screenshot for a design review. Read down the column that matters most for the service in question:
| Property | Recreate | Rolling | Blue-Green | Canary | A/B Testing |
|---|---|---|---|---|---|
| Downtime | Yes (full) | No | No (brief at switch) | No | No |
| Blast radius at worst | 100% | Grows to 100% | 100% after switch | Capped at canary % | Cohort-defined |
| Detection before full exposure | None | Partial | None (all-or-nothing) | Strong (gated steps) | Strong (per cohort) |
| Rollback mechanism | Redeploy old | Roll back batches | Switch traffic | Set weight to 0 | Switch routing |
| Rollback speed | Slow (minutes) | Medium | Instant (seconds) | Instant (seconds) | Instant |
| Extra capacity | None | ~1 batch | 2× (full duplicate) | Small (canary fleet) | Small (variant fleet) |
| Tooling needed | Trivial | Built into k8s | LB / label switch | Mesh + analysis | Router + analytics |
| Stateful-friendly | Yes (with downtime) | Risky | Risky (data sync) | Risky | N/A |
| Best for | Batch jobs, dev, breaking schema | Stateless internal services | Instant-rollback prod | High-traffic prod | Product experiments |
| Primary cost | Downtime | Slow detection | 2× infra | Analysis complexity | Analytics complexity |
The same five mapped to the two numbers that decide an incident’s severity — how big the failure is and how fast you escape it:
| Strategy | Typical blast radius | Typical MTTR | Net risk profile |
|---|---|---|---|
| Recreate | 100% + downtime window | Build + deploy (10–30 min) | High — avoid for live services |
| Rolling | 25–60% before alert fires | Roll-back through batches (5–15 min) | Medium — fine for low-stakes |
| Blue-Green | 100% but for seconds before you notice | Switch back (~5 s) | Low blast window, instant escape |
| Canary | 1–10% (the canary weight) | Set weight 0 (~5 s) | Lowest — small and fast |
| A/B | The experiment cohort | Switch routing (~5 s) | Low — but it is a product tool |
Recreate: the honest baseline
The recreate strategy stops every instance of the old version, then starts every instance of the new version. There is a window — from “last old instance stopped” to “first new instance ready” — during which the service is down. It is the simplest possible strategy and the only one that is honest about downtime instead of pretending to avoid it.
It is the right tool more often than its reputation suggests. Use recreate when: the workload can tolerate a maintenance window (internal tools, batch processors, nightly jobs); you are making a change that cannot run two versions side by side (a non-backward-compatible schema migration where old and new code genuinely cannot coexist); or you are in a dev/test environment where double infrastructure is wasteful and a 30-second blip is fine. Crucially, recreate sidesteps the entire expand/contract migration burden — if you accept downtime, you can do a destructive migration in the gap.
In Kubernetes it is one line in the Deployment spec:
apiVersion: apps/v1
kind: Deployment
metadata:
  name: report-generator
spec:
  replicas: 3
  strategy:
    type: Recreate          # terminate all old pods before creating new ones
  selector:
    matchLabels: { app: report-generator }
  template:
    metadata:
      labels: { app: report-generator }
    spec:
      containers:
        - name: app
          image: registry.example.com/report-generator:2.0.0
When you apply a new image, Kubernetes scales the old ReplicaSet to zero, waits for all old pods to terminate, then scales the new ReplicaSet up. The trade-off is explicit and the controls are minimal:
| Aspect | Recreate behaviour | When it is acceptable | When it is not |
|---|---|---|---|
| Availability | Full downtime during the gap | Internal tools, batch jobs, dev | Any customer-facing live service |
| Capacity | No extra (never runs both) | Cost-sensitive, single-version constraint | When you cannot afford a blip |
| Schema | Can do destructive migrations in the gap | Genuinely incompatible changes | When backward-compat is achievable |
| Rollback | Redeploy old image (another gap) | Low-stakes, infrequent deploys | When MTTR must be seconds |
| Complexity | Trivial — no traffic shaping | Small teams, simple services | When you need gated exposure |
Recreate’s quiet virtue is that it never lets two versions hit the database at once, so a whole class of compatibility bugs simply cannot occur. Its quiet vice is that “just a few seconds of downtime” compounds — at twenty deploys a day it is twenty outages a day, and it trains the team to deploy rarely, which is the opposite of what you want.
Rolling update: the default, and its blind spot
A rolling update replaces instances incrementally — take down a small batch of old instances, bring up an equal-ish batch of new ones, wait for them to pass their readiness probe, then move to the next batch. The service stays up throughout because there is always healthy capacity serving traffic. This is the Kubernetes default (strategy.type: RollingUpdate) and the default in most PaaS, which is exactly why so many teams ship logic bugs to 100% of users without realising they chose a strategy at all.
The two knobs that define a rolling update’s character are maxSurge and maxUnavailable:
apiVersion: apps/v1
kind: Deployment
metadata:
  name: catalog-api
spec:
  replicas: 10
  strategy:
    type: RollingUpdate
    rollingUpdate:
      maxSurge: 2            # up to 2 EXTRA pods above replicas during the roll
      maxUnavailable: 0      # never drop below `replicas` healthy (surge-only)
  minReadySeconds: 15        # a new pod must stay Ready 15s before it counts
  selector:
    matchLabels: { app: catalog-api }
  template:
    metadata:
      labels: { app: catalog-api }
    spec:
      containers:
        - name: app
          image: registry.example.com/catalog-api:3.4.1
          readinessProbe:
            httpGet: { path: /healthz/ready, port: 8080 }
            initialDelaySeconds: 5
            periodSeconds: 5
            failureThreshold: 3
Here is precisely what each control does and how to reason about it:
| Setting | What it controls | Default (k8s) | Set it to… | Trade-off |
|---|---|---|---|---|
maxSurge |
Extra pods allowed above replicas during the roll |
25% | Higher = faster roll, more peak capacity/cost | More nodes briefly; faster exposure of a bug |
maxUnavailable |
How many pods may be missing below replicas |
25% | 0 for zero-capacity-loss rollouts |
0 requires surge headroom (extra nodes) |
minReadySeconds |
How long a new pod must be Ready before counting | 0 | 10–30 s to catch instant-crash pods | Slower roll; catches “ready then dies” |
readinessProbe |
When a pod is allowed to receive traffic | none | Always set it; check real readiness | A missing probe ships traffic to a booting pod |
progressDeadlineSeconds |
When a stuck roll is declared failed | 600 | Lower to fail fast on a wedged rollout | Too low aborts a legitimately slow start |
The single most important fact about rolling updates: the readiness probe is the only health gate, and it almost never checks business logic. A probe that returns 200 when the process is up will happily pass a build whose checkout math is wrong. The rollout proceeds batch by batch, the blast radius grows from 10% to 100%, and your first real signal is an error-rate alert or a customer ticket — by which point a large fraction of the fleet is bad. This is the Friday-checkout incident in the intro.
maxSurge vs maxUnavailable is the availability-versus-speed dial. The common configurations and what they mean:
maxSurge / maxUnavailable |
Behaviour | Use when |
|---|---|---|
25% / 25% (default) |
Balanced; brief dip below full capacity allowed | General internal services with capacity headroom |
surge>0 / 0 |
Never lose capacity; add new before removing old | Customer-facing services that cannot dip |
0 / >0 |
Never exceed replicas; remove old before adding new |
Hard pod/quota or licence caps; tolerate a dip |
100% / 0 |
All-new-at-once on top of old (mini blue-green) | Small fleets where you want fast full cutover with headroom |
Rolling back a rolling update is itself a rolling operation — Kubernetes keeps prior ReplicaSets, so kubectl rollout undo deployment/catalog-api rolls the previous image back in, batch by batch. It works, but it is not instant: you are rolling forward to the old version through the same batched process, so MTTR is on the order of the rollout time, not seconds.
# Watch a rollout, and undo it if it goes wrong
kubectl rollout status deployment/catalog-api --timeout=120s
kubectl rollout undo deployment/catalog-api          # back to the previous ReplicaSet
kubectl rollout undo deployment/catalog-api --to-revision=7   # to a specific revision
kubectl rollout history deployment/catalog-api       # list revisions
Rolling is the correct default for stateless services where a few minutes of partial exposure is an acceptable risk — internal APIs, background workers, anything where the cost of a slow detection is low. It is the wrong default for a high-traffic checkout path, where you want the blast radius capped and the detection automated. The fix there is not “tune maxSurge” — it is “use a canary.”
Blue-green: two environments, one atomic switch
Blue-green runs two complete, identical production environments side by side. One (“blue”) serves all live traffic; the other (“green”) is idle or serving none. You deploy the new version to green, test it in isolation against production-grade infrastructure, and then switch all traffic from blue to green in a single atomic operation — flip a load-balancer target, repoint a DNS record, or change a Kubernetes Service selector. If green misbehaves, you switch straight back to blue. Blue becomes the idle environment, ready for the next release.
The defining properties: the cutover is atomic (everyone moves at once, no in-between fleet), the rollback is instant (switch the pointer back), and you pay for roughly double the infrastructure because two full environments exist. Blue-green’s safety does not come from a small blast radius — after the switch, 100% of users are on green. It comes from the rollback being a single, fast, build-system-free operation.
Blue-green in Kubernetes via a Service label switch
The cleanest Kubernetes implementation uses one Service and two Deployments distinguished by a version label. The Service’s selector decides which Deployment receives traffic; changing the selector is the cutover.
# Two deployments: blue (live) and green (new), same app, different version label
apiVersion: apps/v1
kind: Deployment
metadata: { name: web-blue }
spec:
  replicas: 6
  selector: { matchLabels: { app: web, version: blue } }
  template:
    metadata: { labels: { app: web, version: blue } }
    spec:
      containers: [ { name: app, image: registry.example.com/web:1.8.0 } ]
---
apiVersion: apps/v1
kind: Deployment
metadata: { name: web-green }
spec:
  replicas: 6
  selector: { matchLabels: { app: web, version: green } }
  template:
    metadata: { labels: { app: web, version: green } }
    spec:
      containers: [ { name: app, image: registry.example.com/web:1.9.0 } ]
---
# The Service routes to whichever version its selector names. Flip it to cut over.
apiVersion: v1
kind: Service
metadata: { name: web }
spec:
  selector: { app: web, version: blue }   # ← live traffic goes here
  ports: [ { port: 80, targetPort: 8080 } ]
The cutover and the rollback are each a one-line selector patch:
# Cut over: send the Service to green
kubectl patch service web -p '{"spec":{"selector":{"app":"web","version":"green"}}}'

# Roll back instantly: send it back to blue (which is still running)
kubectl patch service web -p '{"spec":{"selector":{"app":"web","version":"blue"}}}'
Blue-green on a cloud load balancer
On AWS/Azure/GCP you typically keep two target groups / backend pools behind one load balancer (or two and swap DNS). The new version registers into the idle target group; you shift the listener (or weighting) from old to new. The mechanics differ by platform but the shape is identical — an atomic repoint of a router from one fully-provisioned fleet to another.
| Platform | Blue-green primitive | Atomic switch via | Instant rollback via |
|---|---|---|---|
| Kubernetes | Two Deployments + one Service | Patch Service selector |
Patch selector back |
| AWS | Two target groups + ALB / CodeDeploy | Listener forward / CodeDeploy traffic shift | CodeDeploy auto-rollback / re-point listener |
| Azure | Two backend pools / App Service slots | App Service slot swap / App Gateway rule | Swap back / re-point rule |
| GCP | Two backend services + URL map | Update URL map / backend service | Revert URL map |
| DNS-based | Two environments, one record | Repoint DNS (CNAME/A) | Repoint DNS back |
Azure’s deployment slots are blue-green built into the platform: you deploy to a staging slot, warm it, then swap — the swap is the atomic cutover and the previous production instance is preserved in the staging slot for an instant swap-back. (See the warm-up-before-swap mechanics in Azure App Service vs Container Apps vs AKS: Choose the Right Compute.)
A few sharp edges that turn a “trivial” blue-green into an outage:
| Pitfall | What goes wrong | Mitigation |
|---|---|---|
| DNS-based switch is not instant | TTL caching means clients keep hitting the old IP for the TTL | Prefer LB/selector switch; set low TTL only as a fallback |
| In-flight requests dropped at switch | Connections to blue are cut mid-request → 502s | Enable connection draining; switch at the LB, not by killing pods |
| Stateful data divergence | Green wrote rows blue never sees (or vice versa) after a quick flip-flop | Keep a single shared, backward-compatible datastore; never fork state |
| Sticky sessions strand users | Session affinity pins users to blue after cutover | Externalise session state; disable affinity for stateless apps |
| Idle environment drifts | Green’s config/secrets/scaling rot while idle, so it fails when promoted | Keep both environments fully provisioned and config-identical |
| Cost surprise | 2× compute billed continuously | Scale the idle side down between releases if your switch can re-scale it |
Blue-green is the right choice when you need instant, atomic rollback and can afford the duplicate capacity — releases where “we must be able to undo this in five seconds” outweighs the infra bill, and where the change is not safely incremental. It is a poor fit for stateful systems unless the state is fully externalised into a shared, compatible store, because the moment blue and green write divergent data, your “instant rollback” loses the writes that happened on the wrong side.
Canary: small, gated, automated
A canary deployment releases the new version to a small slice of real traffic first — 1%, 5%, 10% — while keeping everyone else on the stable version. You then watch the canary’s metrics: error rate, latency, saturation, and ideally a business signal. If the canary stays healthy through a defined bake time, you increase its traffic share in steps (5% → 25% → 50% → 100%); if any metric breaches a threshold, you abort by routing the canary back to 0%. The name comes from the canary in a coal mine: a small, expendable sentinel that detects danger before it reaches everyone.
This is the strategy with the best risk profile because it combines a capped blast radius (only the canary % is ever exposed) with fast, automated detection (the analysis runs continuously and aborts in minutes or seconds). Its cost is complexity: you need a router that can split traffic by weight, and — to be more than theatre — an automated analysis that judges the canary against a baseline.
The two halves of a canary: traffic shifting and analysis
A canary has two independent mechanisms, and getting either wrong defeats it:
Traffic shifting — splitting requests by weight between stable and canary. Three common implementations, in rising order of precision:
| Mechanism | How the split works | Granularity | Best with |
|---|---|---|---|
| Replica-count canary | Run N stable + 1 canary pods behind one Service; share ≈ 1/(N+1) | Coarse (tied to pod counts) | No mesh; quick-and-dirty canary |
| Ingress weighting | Ingress controller (NGINX, ALB, App Gateway) splits by percentage | Fine (%) | Single entry point, no mesh |
| Service mesh weighting | Mesh (Istio/Linkerd) sets exact request weights between subsets | Fine (%) + header/cohort rules | Precise, header-based, mTLS canaries |
Analysis — the automated judge. It periodically queries your metrics backend (Prometheus, Datadog, CloudWatch, Application Insights) and compares the canary’s golden signals to the baseline. If the canary is meaningfully worse, it aborts. Without this, you have manual canarying: the small blast radius is real, but a human still has to stare at dashboards and decide, slowly.
Canary with Argo Rollouts and a service mesh
Argo Rollouts replaces the Kubernetes Deployment with a Rollout resource that natively understands canary steps, traffic weights and analysis. A representative spec:
apiVersion: argoproj.io/v1alpha1
kind: Rollout
metadata: { name: checkout }
spec:
  replicas: 10
  strategy:
    canary:
      canaryService: checkout-canary     # Service pointing at the canary pods
      stableService: checkout-stable     # Service pointing at the stable pods
      trafficRouting:
        istio:
          virtualService: { name: checkout-vs, routes: [ primary ] }
      steps:
        - setWeight: 5                    # 5% to canary
        - pause: { duration: 5m }         # bake — analysis runs during the pause
        - analysis:                       # automated gate; abort on failure
            templates: [ { templateName: success-rate-and-latency } ]
        - setWeight: 25
        - pause: { duration: 5m }
        - setWeight: 50
        - pause: { duration: 5m }
        - setWeight: 100                  # full promotion
  selector: { matchLabels: { app: checkout } }
  template:
    metadata: { labels: { app: checkout } }
    spec:
      containers:
        - name: app
          image: registry.example.com/checkout:5.2.0
The analysis template that promotes or aborts the rollout — this is the part that makes it real:
apiVersion: argoproj.io/v1alpha1
kind: AnalysisTemplate
metadata: { name: success-rate-and-latency }
spec:
  metrics:
    - name: success-rate
      interval: 1m
      successCondition: result >= 0.99           # ≥99% success or abort
      failureLimit: 2                             # 2 bad reads → abort the rollout
      provider:
        prometheus:
          address: http://prometheus.monitoring:9090
          query: |
            sum(rate(http_requests_total{app="checkout",code!~"5.."}[2m]))
            /
            sum(rate(http_requests_total{app="checkout"}[2m]))
    - name: p95-latency
      interval: 1m
      successCondition: result <= 400             # p95 ≤ 400 ms
      failureLimit: 2
      provider:
        prometheus:
          address: http://prometheus.monitoring:9090
          query: |
            histogram_quantile(0.95,
              sum(rate(http_request_duration_ms_bucket{app="checkout"}[2m])) by (le))
If success-rate drops below 99% or p95-latency exceeds 400 ms for two consecutive reads, Argo Rollouts aborts: it sets the canary weight back to 0 and the stable version carries all traffic again — an instant, automated rollback that no human had to trigger.
The canary parameters that actually matter
Tuning a canary is mostly about four numbers. Get them wrong and you either ship bugs (too fast/too small) or ship at a glacial pace (too slow):
| Parameter | What it controls | Typical value | If too low / small | If too high / large |
|---|---|---|---|---|
| Initial weight | First traffic % to the canary | 1–5% | Too little signal to judge | Larger blast radius before first gate |
| Step increments | How fast weight grows | 5 → 25 → 50 → 100 | More steps = slower, safer | Big jumps re-expose risk fast |
| Bake time per step | How long to hold before judging | 5–30 min | Misses slow leaks (memory, slow errors) | Deploys crawl; long lead time |
| Failure threshold | When the analysis aborts | error >1% or p95 +20% | Aborts on noise (flaky) | Lets real regressions through |
| Min sample size | Requests needed for a valid verdict | enough for stat-significance | Verdict on noise | Slow on low-traffic services |
Two non-obvious truths fall out of that table. First, canary needs traffic — a service doing 5 requests a minute cannot produce a statistically meaningful 5% signal, so canary is a poor fit for low-traffic services (use blue-green or rolling there). Second, bake time is a leak detector — a memory leak or slow connection-pool exhaustion only shows after minutes of load, so a 30-second bake passes a release that dies at minute four; size the bake to the slowest failure mode you care about.
Cloud-native canary without a mesh
You do not strictly need Kubernetes or Istio — cloud weighted routing does coarse canaries natively:
| Platform | Weighted-routing primitive | Analysis / automation |
|---|---|---|
| AWS | ALB weighted target groups; CodeDeploy canary configs; App Mesh | CloudWatch alarms drive CodeDeploy auto-rollback |
| Azure | App Gateway / Front Door weights; Container Apps revisions with traffic % | Azure Monitor alerts; Container Apps split by revision |
| GCP | Backend-service weights; Cloud Run traffic split by revision | Cloud Monitoring + manual or scripted gates |
| Kubernetes (mesh) | Istio/Linkerd subset weights via Argo Rollouts / Flagger | Prometheus analysis (shown above) |
Flagger is the common alternative to Argo Rollouts: it watches your Deployment, drives the mesh/ingress weights, runs metric checks, and promotes or rolls back automatically — the same canary loop, expressed as a Canary custom resource.
Canary is the right choice for high-traffic, customer-facing services where you can afford the analysis tooling — checkout, search, the API gateway. It is overkill for low-traffic internal tools (no signal, more machinery than the risk warrants) and it is dangerous without a real metric gate, because a canary you have to watch by hand gives you the false confidence of “we’re canarying” without the automated abort that makes it safe.
A/B testing: when “10% of traffic” is a product experiment
A/B testing routes different cohorts of users to different variants of a feature and compares a business metric — conversion rate, click-through, revenue per session — to decide which variant wins. Mechanically it looks like a canary (some users get version A, some get version B, routed by weight or by a rule), which is why it gets lumped in with deployment strategies. The intent is completely different: a canary asks “is the new version safe to roll out to everyone?” and the answer is a release decision; an A/B test asks “which variant produces a better outcome?” and the answer is a product decision.
The routing for A/B is usually rule-based, not random: you target a cohort by header, geography, user attribute, or a hash of the user ID (so a given user consistently sees the same variant — “sticky” assignment is essential, or your metric is noise). This is naturally expressed with a service mesh’s header-based routing or a feature-flag platform:
# Istio: route the "beta" cohort (a header set by your edge) to variant B
apiVersion: networking.istio.io/v1beta1
kind: VirtualService
metadata: { name: search-vs }
spec:
  hosts: [ search ]
  http:
    - match: [ { headers: { x-cohort: { exact: "beta" } } } ]
      route: [ { destination: { host: search, subset: variant-b } } ]
    - route: [ { destination: { host: search, subset: variant-a } } ]   # everyone else
In practice, A/B targeting is most often done with feature flags rather than infrastructure routing, because flags let you assign cohorts, hold the assignment sticky, and read the experiment back in your analytics — without redeploying. That overlap is exactly why A/B lives next to progressive delivery; the full treatment is in Progressive Delivery and Feature Flags: Release Without Fear.
The distinction that keeps teams out of trouble:
| Dimension | Canary | A/B testing |
|---|---|---|
| Question it answers | Is the new version safe to release? | Which variant performs better? |
| Decision it informs | Release / abort (operational) | Ship A or B (product) |
| Primary metric | Error rate, latency, saturation | Conversion, CTR, revenue, engagement |
| Routing basis | Random % of traffic | Sticky cohort (user/header/geo) |
| Duration | Minutes to hours (bake time) | Days to weeks (statistical power) |
| Who owns it | Platform / SRE | Product / growth + data |
| Abort condition | Health-metric breach | Inconclusive or losing variant |
Use A/B testing when you are genuinely comparing product outcomes and have the analytics to reach statistical significance. Do not use it as a safety mechanism — it is not designed to catch a 500-error regression quickly; that is the canary’s job. The two compose well: canary a change to prove it is safe, then A/B it to learn whether it is better.
The database problem every strategy shares
Here is the trap that turns every “instant rollback” into a lie: during any non-recreate rollout, old and new code run against the same database at the same time. If your migration is not backward-compatible, one of them breaks the instant the schema changes — and rolling the code back does not roll the schema back. You are now stuck on the broken version with no safe exit.
The discipline that fixes this is the expand/contract (also called parallel-change) pattern: never change a column in place; instead expand the schema to support both old and new shapes, deploy code that writes both/reads new, backfill, and only contract (remove the old shape) in a later deployment once nothing references it.
| Phase | Schema action | Code that is safe to run | Why it is reversible |
|---|---|---|---|
| 1. Expand | Add the new column/table (nullable, no constraint) | Old code (ignores it) + new code (can use it) | Old code untouched → old version still works |
| 2. Migrate | Backfill new column; code writes BOTH old and new | New code dual-writes; old code reads old | Either version can serve; roll back freely |
| 3. Switch reads | Code reads NEW; still writes both | New code authoritative; old still functions | Old path intact as a fallback |
| 4. Contract | Drop the old column — only after nothing reads it | New code only | Done in a separate later release |
Concrete rules that make a rollout reversible, and the destructive operations that quietly remove your rollback:
| Safe (backward-compatible) | Unsafe (breaks the other version) |
|---|---|
ADD COLUMN ... NULL (no default that rewrites the table) |
DROP COLUMN while old code still selects it |
| Add a new table | ALTER COLUMN type change in place |
| Add a nullable foreign key | Add a NOT NULL column with no default |
Create an index CONCURRENTLY |
Rename a column (old code’s queries 404) |
| Dual-write old + new fields | Tighten a constraint old data violates |
| Deploy code, then contract later | Couple a destructive migration to the deploy |
The operational rule: the migration ships ahead of, and separately from, the code that depends on it, and the destructive cleanup ships a release behind the code that stopped using the old shape. Get this right and any of recreate/rolling/blue-green/canary can roll back cleanly. Get it wrong and the fanciest canary in the world cannot save you, because the schema has already burned the bridge.
Health gates: the signal that drives every strategy
A progressive strategy is only as good as the signal that promotes or aborts it. There is a hierarchy of health signals, and most failures-that-shipped came from relying on a signal too low on it:
| Signal | What it proves | Catches | Misses |
|---|---|---|---|
| Process up (liveness) | The process is running | Crashes, hangs (restarts them) | Everything logical; it is not a rollout gate |
| Readiness probe | The instance can accept traffic | Boot-incomplete, lost dependency | Wrong business logic that returns 200 |
| Error-rate / latency (golden signals) | The version behaves under real traffic | 5xx spikes, latency regressions, saturation | Subtle correctness bugs with no error |
| Business metric | The version produces the right outcome | Drops in checkout success, add-to-cart | Slow-burn issues below the noise floor |
The lesson the intro incident taught: a readiness probe is a weak rollout gate because it answers “is the process up,” not “is the code correct.” A canary’s analysis should always reach at least the golden-signal layer, and for revenue-critical paths, the business-metric layer (a 2% dip in checkout success is a far better abort trigger than waiting for 5xx). Liveness vs readiness is a recurring confusion worth nailing:
| Probe | Question | Failure action | Use for |
|---|---|---|---|
| Liveness | “Is this instance wedged and should it be restarted?” | Kill + restart the container | Detecting deadlocks/hangs |
| Readiness | “Can this instance serve a request right now?” | Remove from the load-balancer rotation | Gating traffic during boot/drain |
| Startup | “Has a slow-starting app finished booting?” | Hold off liveness until it passes | Slow JVM/.NET/migration starts |
Never fail liveness on an optional downstream — a transient cache outage that flips liveness will restart your whole fleet into a crash loop. Keep liveness shallow (process-local), readiness honest (can I serve), and put the real judgment in the canary analysis.
Architecture at a glance
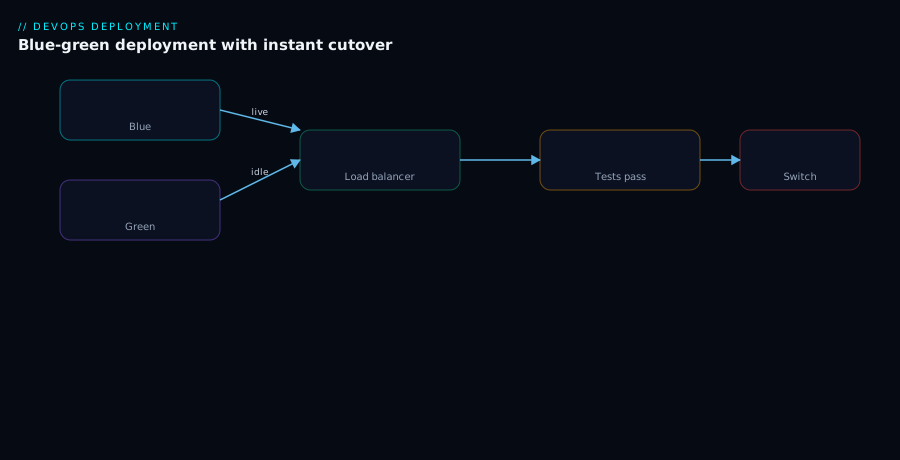
Picture the deployment as a traffic router in front of two versions of a service, with a health signal feeding back into the router to decide how much traffic each version gets. In a blue-green topology the router is a binary switch: it points entirely at blue (the current version) while green (the new version) is deployed and tested in isolation; the cutover flips the switch to green atomically, and rollback flips it back. Every node — the load balancer, the blue fleet, the green fleet, the shared backward-compatible database — stays in place; only the switch moves. The first diagram shows this: a single ingress feeding two complete environments, the live arrow on blue, the dormant arrow on green, the labelled “switch” that moves 100% of traffic in one operation, and the database shared beneath both so rollback loses no data.
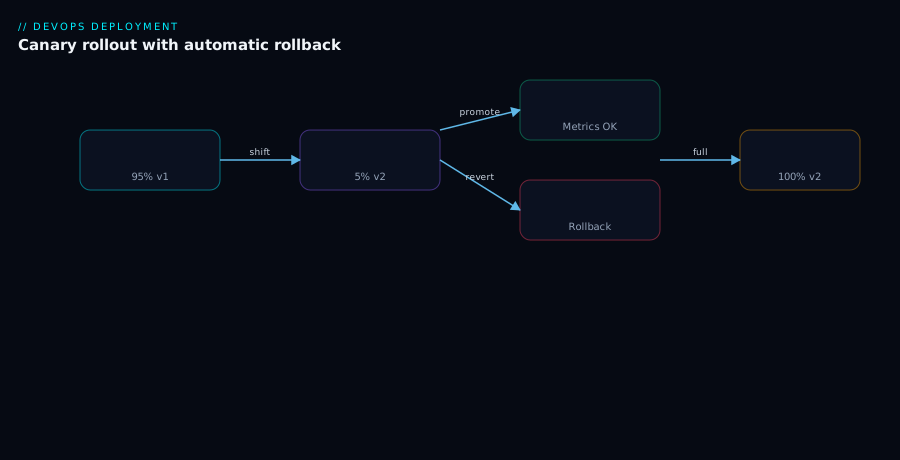
In a canary topology the same router is a weighted splitter rather than a binary switch: it sends a small, configurable percentage (5%) to the canary fleet and the remainder (95%) to the stable fleet, while an analysis component continuously reads error-rate and latency metrics from the canary and compares them to the baseline. The feedback loop is the whole point — healthy metrics tell the controller to increase the canary weight in steps (5% → 25% → 50% → 100%), while a breach tells it to abort by setting the weight back to 0. The second diagram traces this loop: traffic entering the weighted router, the 5%/95% split into canary and stable pods, metrics flowing from the canary into the analysis box, and two labelled arrows — “promote” raising the weight and “abort” collapsing it to zero — so a bad release is contained to the canary slice and rolled back automatically.
The unifying mental model across both diagrams: a router in front of versions, a health signal behind the router. Blue-green moves the router in one big step with the safety net of an instant reverse; canary moves it in small, metric-gated steps with the safety net of a capped blast radius. Rolling is the same picture with the router replaced by Kubernetes silently shifting which pods are old and new, and no metric feedback — which is exactly why its blind spot is detection.
Real-world scenario
Lumen Retail runs an e-commerce platform on Kubernetes: a public storefront, a search service, a checkout service, an internal pricing/promotions admin tool, and a nightly settlement batch job. They deploy 15–30 times a day across these services. For a year they used the Kubernetes default — rolling updates — for everything, and treated all deployments as equal. They had two painful incidents in one quarter: the Friday checkout outage from the intro (a coupon/tax bug that a readiness probe could not catch, 30% of checkouts failing for 47 minutes), and a search regression that doubled p95 latency and rolled out to 100% before anyone noticed, because the only alert was a slow-burning latency SLO.
The post-incident redesign assigned a strategy per service based on traffic, statefulness, and blast-radius tolerance:
| Service | Traffic | Old strategy | New strategy | Why |
|---|---|---|---|---|
| Checkout | High, revenue-critical | Rolling | Canary (5→25→50→100, metric-gated on checkout-success + p95) | Cap blast radius; auto-abort on a business-metric dip |
| Search | High | Rolling | Canary (latency-gated) | Latency regressions must abort before full exposure |
| Storefront | High, mostly stateless | Rolling | Blue-green (Service-label switch) | Big front-end releases needed instant rollback |
| Pricing admin | Low, internal | Rolling | Rolling (kept) | Low stakes, low traffic — canary has no signal here |
| Settlement batch | None (no live traffic) | Rolling | Recreate | A job, not a service; downtime is fine, allows clean migrations |
The mechanics they put in place: Argo Rollouts drove the checkout and search canaries against Prometheus golden-signal and business-metric queries, with a 10-minute bake per step (sized to catch a slow connection-pool leak they had been bitten by). The storefront moved to a two-Deployment blue-green with a Service-label switch and a warmed green environment. Underpinning all of it, they adopted expand/contract migrations as a hard rule — every schema change ships ahead of the code, destructive drops ship a release behind — because their old “rollback” had repeatedly failed when a migration had already removed a column the previous version needed.
The numbers six months later: the checkout canary aborted automatically four times on real regressions, each contained to the 5% slice and rolled back inside three minutes with zero customer-visible incident — failures that, under the old rolling default, would each have been a multi-minute, large-blast-radius outage. The storefront blue-green turned one botched release into a five-second switch-back instead of a 12-minute redeploy. The pricing admin tool stayed on rolling and nobody missed the ceremony. Total extra infra cost was modest — the canary fleets are a few buffer pods, and only the storefront pays the blue-green 2× during the brief overlap window — and it bought them out of the “every deploy is a 100%-blast-radius gamble” trap entirely. The lesson Lumen internalised: there is no single best strategy; there is a best strategy per service, and the cheapest way to pick wrong is to let the platform default decide for you.
Advantages and disadvantages
The honest two-column trade-off, per strategy:
| Strategy | Advantages | Disadvantages |
|---|---|---|
| Recreate | Dead simple; no traffic shaping; allows destructive migrations; never runs two versions | Full downtime; slow rollback (redeploy); unfit for live services |
| Rolling | Built-in, no extra tooling; no downtime; ~no extra cost; gradual capacity shift | Weak health gate (readiness only); slow detection; grows blast radius to 100%; rollback is also rolling |
| Blue-green | Instant atomic rollback; deploy/test in isolation; simple mental model; near-zero downtime | ~2× infra cost; all-or-nothing exposure; risky for stateful systems; idle env can drift |
| Canary | Smallest blast radius; automated metric-gated abort; best risk/cost ratio at scale; gradual confidence | Needs traffic to get signal; needs mesh/router + analysis tooling; more complex to operate |
| A/B | Data-driven product decisions; sticky cohorts; measures real outcomes | Not a safety mechanism; needs analytics + statistical rigour; runs for days/weeks |
When each advantage actually decides it: choose recreate when downtime is genuinely acceptable and you want to avoid the entire two-versions-coexisting problem (batch jobs, dev). Choose rolling when the service is stateless and low-stakes enough that slow detection costs little — the absence of extra tooling and cost wins. Choose blue-green when the deciding requirement is “we must be able to undo this instantly and atomically,” and you can pay for the duplicate environment. Choose canary when the service is high-traffic and customer-facing and you can afford the analysis machinery — the capped blast radius plus automated abort is worth the operational complexity. Reach for A/B only when the question is “which variant is better,” not “is this safe.”
Hands-on lab
This lab runs a real rolling update, then a blue-green cutover with instant rollback, on a local Kubernetes cluster — no cloud spend. You need kubectl and a local cluster (kind, minikube, Docker Desktop, or k3d). We use the public nginxdemos/hello image (it serves a page showing which pod answered, so you can see the version split).
Step 1 — Create the namespace and a rolling Deployment.
kubectl create namespace deploy-lab
cat <<'EOF' | kubectl apply -n deploy-lab -f -
apiVersion: apps/v1
kind: Deployment
metadata: { name: web, labels: { app: web } }
spec:
  replicas: 6
  strategy:
    type: RollingUpdate
    rollingUpdate: { maxSurge: 2, maxUnavailable: 0 }
  minReadySeconds: 5
  selector: { matchLabels: { app: web } }
  template:
    metadata: { labels: { app: web } }
    spec:
      containers:
        - name: web
          image: nginxdemos/hello:0.2          # "version 1"
          ports: [ { containerPort: 80 } ]
          readinessProbe:
            httpGet: { path: /, port: 80 }
            initialDelaySeconds: 2
            periodSeconds: 3
---
apiVersion: v1
kind: Service
metadata: { name: web, labels: { app: web } }
spec:
  selector: { app: web }
  ports: [ { port: 80, targetPort: 80 } ]
EOF
Expected output: namespace/deploy-lab created, then deployment.apps/web created and service/web created.
Step 2 — Confirm six pods are Ready.
kubectl get pods -n deploy-lab -l app=web
# Expected: 6 pods, all STATUS Running, READY 1/1
Step 3 — Trigger a rolling update and watch the batches. Change the image to a different tag and observe the surge-only roll (it never drops below 6 Ready because maxUnavailable: 0).
kubectl set image deployment/web web=nginxdemos/hello:plain-text -n deploy-lab
kubectl rollout status deployment/web -n deploy-lab --timeout=120s
# Expected, line by line: "Waiting for ... new replicas ... updated",
# then "deployment 'web' successfully rolled out"
During the roll, in a second terminal, watch pods churn in batches of two (the maxSurge):
kubectl get pods -n deploy-lab -l app=web -w
# Expected: new pods appear (surge), become Ready, old ones Terminate — never <6 Ready
Step 4 — Roll the rolling update back.
kubectl rollout undo deployment/web -n deploy-lab
kubectl rollout status deployment/web -n deploy-lab --timeout=120s
# Expected: "deployment 'web' successfully rolled out" — now back on hello:plain-text's predecessor
kubectl rollout history deployment/web -n deploy-lab
# Expected: a table of REVISION numbers; the latest is the rollback
Step 5 — Set up blue-green. Delete the rolling Deployment’s Service routing and stand up blue + green Deployments behind a switchable Service.
kubectl delete deployment web -n deploy-lab
cat <<'EOF' | kubectl apply -n deploy-lab -f -
apiVersion: apps/v1
kind: Deployment
metadata: { name: web-blue }
spec:
  replicas: 3
  selector: { matchLabels: { app: web, version: blue } }
  template:
    metadata: { labels: { app: web, version: blue } }
    spec: { containers: [ { name: web, image: nginxdemos/hello:0.2, ports: [ { containerPort: 80 } ] } ] }
---
apiVersion: apps/v1
kind: Deployment
metadata: { name: web-green }
spec:
  replicas: 3
  selector: { matchLabels: { app: web, version: green } }
  template:
    metadata: { labels: { app: web, version: green } }
    spec: { containers: [ { name: web, image: nginxdemos/hello:plain-text, ports: [ { containerPort: 80 } ] } ] }
EOF
# The Service from Step 1 still selects app=web (both versions). Make it version-specific:
kubectl patch service web -n deploy-lab -p '{"spec":{"selector":{"app":"web","version":"blue"}}}'
Expected: both Deployments created; the Service now routes only to blue.
Step 6 — Validate the blue-green cutover and instant rollback. Port-forward and curl across the switch.
kubectl port-forward -n deploy-lab service/web 8080:80 >/dev/null 2>&1 &
sleep 2
curl -s localhost:8080 | grep -i "server\|nginx" | head -1     # blue (hello:0.2 renders HTML)

# Cut over to green:
kubectl patch service web -n deploy-lab -p '{"spec":{"selector":{"app":"web","version":"green"}}}'
sleep 2
curl -s localhost:8080 | head -3                               # green (plain-text variant responds)

# Instant rollback to blue:
kubectl patch service web -n deploy-lab -p '{"spec":{"selector":{"app":"web","version":"blue"}}}'
sleep 2
curl -s localhost:8080 | grep -i "server\|nginx" | head -1     # back on blue, in seconds
Expected: the response content changes the instant you patch the selector — that change is the cutover, and the rollback patch reverses it in seconds without any redeploy.
Step 7 — Teardown. Remove everything so nothing lingers.
kill %1 2>/dev/null                                # stop the port-forward
kubectl delete namespace deploy-lab
# Expected: "namespace 'deploy-lab' deleted" — removes all Deployments, Services, pods
You have now executed a surge-only rolling update with a real readiness gate, rolled it back, and performed a blue-green cutover and instant rollback by moving a single Service selector — the two mechanics that underpin every production deployment strategy.
Common mistakes & troubleshooting
The real failure modes, as a symptom → root cause → confirm → fix playbook:
| # | Symptom | Root cause | How to confirm | Fix |
|---|---|---|---|---|
| 1 | Bad release reached 100% of users despite “we use rolling” | Readiness probe only checks process up, not business logic | Probe returns 200 while error rate climbs in metrics | Add a metric-gated canary for the critical path; probes are not a rollout gate |
| 2 | Rollout stuck “Waiting for rollout to finish” forever | New pods never become Ready (bad probe path, crash on boot) | kubectl describe pod → readiness failures / CrashLoopBackOff |
Fix the probe path / boot error; progressDeadlineSeconds will then fail it fast |
| 3 | Capacity dropped during a rolling update, users got 503 | maxUnavailable > 0 with no surge headroom |
kubectl get deploy -o yaml shows maxUnavailable: 25% |
Set maxUnavailable: 0 and maxSurge > 0 for zero-capacity-loss rolls |
| 4 | Blue-green cutover dropped requests (502s at the switch) | In-flight connections to blue cut when traffic moved | LB/ingress logs show resets at cutover time | Enable connection draining; switch at the LB, not by killing pods; add preStop drain |
| 5 | Rolled back the code but the bug persisted | Migration already dropped/changed a column the old version needs | Old pods log schema errors after the migration ran | Adopt expand/contract; never couple a destructive migration to the deploy |
| 6 | Canary “passed” but the release was bad | Bake time too short to surface a slow leak (memory, pool) | Failure appeared minutes after promotion to 100% | Increase bake time to exceed the slowest failure mode; add saturation metrics |
| 7 | Canary aborts constantly on healthy releases | Failure threshold too tight / sample size too small (noise) | Analysis aborts with marginal metric deltas at low traffic | Loosen threshold, require a minimum sample size, widen the metric window |
| 8 | DNS-based blue-green rollback “didn’t take” | Clients cached the old IP for the DNS TTL | dig shows old record served; TTL high |
Switch at the LB/selector instead; if DNS, pre-lower the TTL |
| 9 | Users stuck on the old version after cutover | Sticky sessions / ARR affinity pinned them to old backends | Session-affinity cookie present; old backends still serving | Externalise session state; disable affinity for stateless apps |
| 10 | Blue-green promotion failed — green broken on first traffic | Idle green environment’s config/secrets/scaling drifted | Green pods error on a missing setting/secret only it lacked | Keep both environments fully provisioned and config-identical; warm before switch |
| 11 | Canary got no traffic, analysis never ran | Mesh/ingress weight not actually wired (replica-count assumed) | Mesh VirtualService shows 0% to canary subset |
Confirm the traffic-routing backend; verify weights with the router, not pod counts |
| 12 | Rollback was “instant” in design but took minutes | The strategy was rolling/recreate, where rollback = redeploy | Rollback triggered a new ReplicaSet roll / image pull | For seconds-MTTR, use blue-green or canary (re-route), not rolling |
The meta-pattern in this table: most “the strategy failed” incidents are really a missing health signal (rows 1, 6, 7), a schema that burned the rollback (row 5), or a router/affinity detail nobody checked (rows 4, 8, 9, 11). Strategy mechanics rarely fail; the gates and the state around them do.
Best practices
- Pick a strategy per service, not per company. High-traffic revenue paths get canary; big stateless front-ends get blue-green; low-stakes internal services stay on rolling; jobs use recreate. The platform default is a decision you should make deliberately, not inherit.
- Wire a real health signal to every progressive rollout. A readiness probe gates rolling but is blind to logic bugs; a canary’s analysis must reach golden signals, and for revenue paths, a business metric. A canary without an automated metric gate is theatre.
- Make every schema migration backward-compatible (expand/contract). Ship the migration ahead of the code, never
DROP/rename in place, and do destructive cleanup a release later. This is the precondition for any rollback working. - Always set
maxUnavailable: 0withmaxSurge > 0for customer-facing rolling updates so you never dip below full capacity mid-roll. - Set
minReadySecondsso a pod that goes “Ready then dies” is caught before the next batch, not after the whole fleet is bad. - Size canary bake time to the slowest failure you care about. Memory leaks and connection-pool exhaustion take minutes; a 30-second bake will pass a release that dies at minute four.
- Enable connection draining / graceful shutdown (
preStophook +terminationGracePeriodSeconds) so cutovers and rollouts don’t sever in-flight requests into 502s. - Externalise session state and disable sticky affinity for stateless apps so cutovers don’t strand users on the old version.
- Keep the idle blue-green environment fully provisioned and config-identical. A drifted green that only fails on first real traffic defeats the entire point.
- Practice rollback as a routine, not an emergency. Rehearse the switch-back / weight-to-zero so that under incident pressure it is muscle memory, and verify your rollback path actually recovers (including the schema).
- Treat deploy and release as separate. Combine deployment strategies with feature flags: deploy dark, release gradually, and decouple “the code is present” from “the code is on.”
- Automate the abort. The fastest MTTR is the one no human had to trigger — CodeDeploy alarms, Argo Rollouts analysis, or Flagger metric checks that roll back without a page.
Security notes
Deployment strategies touch security in ways teams overlook:
- The idle/canary environment is still production. Blue’s secrets, green’s secrets, and the canary’s service account all have real production access. A drifted-but-still-credentialed green is an attack surface; rotate and scope its identity exactly as you do the live one.
- Don’t leak the new version early. A canary or blue-green green is reachable; if it exposes an unreleased feature or a debug endpoint, header/cohort routing must be enforced at the edge, not assumed. Treat pre-release routing rules as security controls.
- Secrets must reach both versions. A blue-green/canary split where only one side has a rotated secret causes the other side to fail (or worse, fall back to a stale credential). Manage secrets centrally (a secrets manager / mounted secret) so both versions get the same, current values — see the patterns in GitOps with Argo CD and Flux: Deliver from Git for keeping this declarative.
- Migrations run with elevated DB privileges. The expand/contract migration step often needs DDL rights the app does not. Run migrations as a separate, tightly-scoped pipeline step with their own credentials, not with the app’s runtime identity.
- Audit who can flip the switch. The ability to patch a Service selector or set a canary weight to 100% is the ability to release to all users; gate it with RBAC and change control, because a malicious or accidental cutover is a production change.
- Health endpoints must not leak. A
/healthzor canary-metrics endpoint that returns internal detail (versions, dependency hosts, stack traces) to anonymous callers is reconnaissance. Keep them shallow and unauthenticated-safe.
Cost & sizing
What each strategy actually adds to the bill, for a representative fleet of a service running 10 instances on mid-size nodes:
| Strategy | Extra compute vs steady-state | Tooling cost | Rough monthly delta (USD) | Rough monthly delta (INR) | Notes |
|---|---|---|---|---|---|
| Recreate | None (never doubles) | None | ~$0 | ~₹0 | You pay in downtime, not dollars |
| Rolling | ~1 surge batch, briefly | None (built in) | ~$0 ongoing | ~₹0 | Transient surge only during the roll |
| Blue-green | Up to 2× during overlap | LB usually already present | +$200–$2,000 (full duplicate) | +₹16,000–₹1,65,000 | Scale idle side down between releases to cut this |
| Canary | Small (a few canary pods) | Mesh + analysis (mostly OSS compute) | +$20–$200 | +₹1,600–₹16,000 | Cheapest safety-per-rupee at high traffic |
| A/B | Small (variant fleet) | Analytics platform | +$0–$1,000 (tool-dependent) | +₹0–₹82,000 | Dominated by the analytics/experimentation tool |
(USD↔INR at roughly ₹83/$; figures are order-of-magnitude for planning, not a quote — your node SKUs, region and traffic dominate.)
How to right-size each:
- Blue-green is the expensive one because of the 2× duplicate. The optimisation is to scale the idle environment down between releases (to a minimal warm footprint or zero, if your switch can scale it back up first) so you only pay double during the brief overlap window — Lumen did exactly this and paid full 2× for minutes, not months.
- Canary is cheap: the canary fleet is a few pods, and Argo Rollouts/Flagger/Prometheus are open-source (you pay for their modest compute). The “cost” is engineering time to build trustworthy analysis, which is a one-time investment amortised across every future release.
- Rolling is effectively free — the only extra is the transient surge capacity during the roll, which lasts minutes.
- A/B’s cost is almost entirely the analytics/experimentation platform, not infrastructure.
The real cost comparison is not infra — it is the cost of an incident the strategy would have prevented. A single 47-minute checkout outage at peak can dwarf a year of canary-fleet compute. Size the strategy to the value of the traffic it protects, and the canary’s few extra pods are the best money in the budget.
Interview & exam questions
Q1. Explain the difference between blue-green and canary in one sentence each. Blue-green runs two full environments and switches all traffic atomically (instant rollback, 2× cost, all-or-nothing exposure). Canary sends a small percentage to the new version and grows it only if metrics stay healthy (capped blast radius, automated abort, needs traffic and analysis tooling).
Q2. Why is a rolling update’s readiness probe a weak safety mechanism? Because it answers “is the process up and accepting traffic,” not “is the business logic correct.” A logically broken version that still returns HTTP 200 passes the probe and rolls out to 100% of users, with the first real signal being an error-rate alert or a customer report — slow detection across a growing blast radius.
Q3. What is the database problem common to all non-recreate strategies, and how do you solve it? Old and new code run against the same database during the rollout, so a non-backward-compatible migration breaks one of them and rolling back the code does not roll back the schema. Solve it with expand/contract (parallel-change): add new structures, dual-write, switch reads, and only drop the old structure in a later, separate release.
Q4. Set maxSurge and maxUnavailable for a customer-facing rolling update that must never lose capacity. Why?
maxUnavailable: 0 and maxSurge > 0 (e.g. 2). This adds new pods before removing old ones, so you never drop below the desired replica count mid-roll. The trade-off is briefly needing extra node capacity for the surge.
Q5. When is recreate the right strategy? When downtime is acceptable (batch jobs, internal tools, dev), or when the change genuinely cannot run two versions side by side (a destructive, non-backward-compatible schema change). Recreate avoids the entire two-versions-coexisting problem at the cost of a downtime window.
Q6. What makes a canary “real” rather than theatre? An automated analysis (over golden signals and ideally a business metric) that promotes or aborts the rollout without a human. A canary you have to watch by hand has the small blast radius but not the fast automated abort, giving false confidence.
Q7. How does blue-green rollback differ from rolling rollback in MTTR? Blue-green rollback is a single re-route (flip the Service selector / LB target) that takes seconds and touches no build system. Rolling rollback is itself a rolling operation — redeploying the previous image batch by batch — bounded by the rollout time, on the order of minutes.
Q8. Distinguish a canary from an A/B test. A canary is an operational safety mechanism asking “is the new version safe to release?” (gated on error rate/latency, minutes-long, random %). An A/B test is a product experiment asking “which variant performs better?” (gated on conversion/revenue, days-long, sticky cohorts). Different questions, different decisions, different owners.
Q9. Why can a canary be the wrong choice for a low-traffic service? A canary needs enough traffic on the canary slice to produce a statistically meaningful signal. At a few requests per minute, a 5% canary cannot be judged reliably, so the analysis either runs on noise or never reaches significance. Prefer blue-green or plain rolling there.
Q10. Name three non-code reasons a “rollback” can fail to recover the service. (1) A destructive migration already ran, so the schema no longer matches the old code. (2) DNS-based switching is cached for the TTL, so clients keep hitting the old version. (3) Sticky sessions/affinity strand users on the old backends. All three are state/routing issues, not code issues.
Q11. What does bake time control in a canary, and what happens if it is too short? Bake time is how long a canary step holds before the analysis judges it. Too short and slow-burning failures — memory leaks, connection-pool exhaustion, error rates that climb gradually — promote to 100% before they surface, so size the bake to exceed the slowest failure mode you care about.
Q12. How do feature flags complement deployment strategies? They push the deploy/release separation into the running process: you deploy the code dark (present but off) using any strategy, then release it gradually by flipping a flag — decoupling “the code is shipped” from “the code is on,” and enabling per-cohort release and instant disable without a redeploy.
Quick check
- Which single number best distinguishes the five deployment strategies, and what does it measure?
- You need rollback to take seconds, not minutes. Which two strategies give you that, and what is the underlying mechanism they share?
- A canary passes its 30-second bake and is promoted to 100%, then fails four minutes later. What was misconfigured?
- Why does coupling a
DROP COLUMNmigration to a deployment break rollback for every strategy except recreate? - Give one reason a canary is a poor fit for a low-traffic internal service.
Answers
- Blast radius — the fraction of users on the new version at the worst moment. Recreate/blue-green hit 100%; rolling grows toward 100%; canary caps it at the canary weight.
- Blue-green and canary. Both roll back by re-routing traffic (flip the Service selector / set canary weight to 0) rather than redeploying — a switch, not a deploy, so it takes seconds and touches no build system.
- Bake time too short. Thirty seconds did not exceed the slow failure’s onset (~4 minutes), so the analysis judged the canary healthy and promoted it before the regression surfaced. Increase the bake to exceed the slowest failure mode and add saturation metrics.
- Because old and new code share the database during the rollout; once the column is dropped, the old version’s queries fail, and rolling the code back does not restore the schema. Recreate escapes this only because it never runs two versions at once (and takes downtime). Expand/contract is the fix.
- It cannot get a statistically meaningful signal — a 5% canary on a few requests per minute is judged on noise. (Also acceptable: the analysis/mesh tooling is more machinery than the low risk warrants.)
Glossary
- Blast radius — The fraction of users exposed to the new (possibly broken) version at the worst moment of a rollout; the core safety number per strategy.
- MTTR (Mean Time To Recovery) — How long it takes to return to a healthy state after a bad deploy; a switch (seconds) versus a redeploy (minutes).
- Recreate — Stop all old instances, then start all new ones; full downtime, simplest, allows destructive migrations.
- Rolling update — Replace instances in batches, gated by readiness; no downtime, no extra cost, but slow detection and growing blast radius.
- Blue-green — Two complete environments with an atomic traffic switch between them; instant rollback at ~2× infrastructure cost.
- Canary — Release to a small traffic percentage first, growing it only if automated analysis stays healthy; smallest blast radius, needs traffic and tooling.
- A/B testing — Routing user cohorts to variants to compare a business metric; a product experiment, not a safety mechanism.
- Readiness / liveness probe — Readiness decides whether an instance may receive traffic (gates rolling batches, blind to logic bugs); liveness decides whether to restart a wedged instance.
- maxSurge / maxUnavailable — Kubernetes rolling-update knobs for extra capacity allowed above, and capacity allowed missing below, the desired replica count.
- Bake time — How long a canary holds a traffic step before the analysis judges it; must exceed the slowest failure mode to catch slow leaks.
- Analysis / metric gate — The automated check that promotes or aborts a progressive rollout based on real metrics; what makes a canary safe rather than theatrical.
- Expand/contract (parallel-change) — A two-phase, backward-compatible migration pattern (add new, dual-write, switch reads, drop old later) that keeps rollback possible.
- Connection draining — Letting in-flight requests finish before an instance is removed, preventing 502s during cutovers and rollouts.
- Argo Rollouts / Flagger — Kubernetes controllers that drive canary/blue-green steps, traffic weights, and metric analysis, automating promotion and rollback.
Next steps
- Decouple deploy from release entirely with Progressive Delivery and Feature Flags: Release Without Fear — flags turn any strategy into a per-cohort, instantly-reversible release.
- Wire the health signal that drives your canary by mastering DevOps Observability: Logs, Metrics, Traces and SLOs — a canary is only as good as the golden signals behind it.
- Operate these strategies from Git with GitOps with Argo CD and Flux: Deliver from Git, where Argo Rollouts and Flagger live and the rollout state is declarative.
- See where deployment sits in the bigger pipeline in CI/CD Pipelines Explained: From Code Commit to Production — strategies are the last mile of that flow.
- Catch regressions before they ever reach a canary with Shift-Left Testing and Quality Gates in CI/CD, and measure whether your strategy is paying off using DORA Metrics and Platform Engineering: Measure and Scale Delivery.