Quick take: DORA metrics tell you how fast and how safely your software reaches users. Platform engineering is how you make that speed the default — golden paths and an internal developer platform that remove the toil every team currently re-solves. Measure first with honest, automatically-collected numbers; then build the platform that moves the metric you’re actually losing on. A platform that doesn’t move a DORA metric is a cost centre, not a product.
A mid-size company had forty engineering teams and forty different ways to ship software. Some pushed through Jenkins, some through GitHub Actions, a few still SSH’d a tarball onto a VM at 9pm. Onboarding a new service took two to three weeks of copy-pasting another team’s Jenkinsfile, guessing at the right Terraform, and filing tickets for a database, a DNS record and a TLS certificate. Nobody could answer the CTO’s simplest question — “are we getting faster or slower?” — because there was no shared definition of “shipped,” let alone a number. The first real fix was not a tool. It was a measurement: instrument the four DORA metrics so the organisation could see, per team, how often it deployed, how long a change took to reach production, how often a deploy broke something, and how fast it recovered. Only then did a small platform team build golden paths — a service template, a reusable pipeline, default observability, a developer portal — and time-to-first-deploy for a new service fell from three weeks to about ninety minutes. The DORA numbers moved because the platform removed the specific bottleneck the numbers had exposed.
This article is the advanced, end-to-end treatment of that loop. DORA — the DevOps Research and Assessment program, the research behind Accelerate and the annual State of DevOps reports — distilled software delivery performance into four metrics that, unusually for engineering metrics, correlate with organisational outcomes rather than gaming-prone vanity. You will learn precisely what each metric is, the exact events you must capture to compute it honestly, the elite/high/medium/low performance bands and what they mean, and the real queries (SQL over a deployments table, KQL over pipeline telemetry, PromQL over a deploy counter) that turn raw events into a dashboard. Then we cross the bridge from measuring delivery to engineering it: platform engineering as a discipline, the Internal Developer Platform (IDP), golden paths, Backstage and software catalogs, Team Topologies as the org model that makes a platform team work, the anti-patterns that turn a platform into a new bottleneck, and how to prove — with the same DORA metrics — that the platform paid for itself.
By the end you will stop treating “DevOps maturity” as a feeling and treat it as four instrumented numbers plus a product (the platform) you invest in to move them. You will know why deployment frequency without change failure rate is a trap, why lead time measured from “ticket created” is meaningless and from “first commit” is gold, why a platform built before you understand team pain becomes shelfware, and how the elite performers actually operate — small batches, trunk-based development, automated testing, progressive delivery and a platform that makes the safe path the easy path.
What problem this solves
Two pains, tightly coupled. The first is flying blind on delivery performance. Leadership wants to know whether an “investment in DevOps” or a reorg or a new CI system actually made delivery better, and engineering can only offer anecdotes. Without DORA metrics you cannot tell a genuinely fast, safe team from a team that ships rarely but loudly, you cannot localise where delivery is slow (is it review latency, a flaky test suite, a manual change-approval board, or a deploy that takes four hours?), and you cannot defend platform or tooling spend with a before/after. Worse, teams optimise the thing they can see — story points, lines of code, PRs merged — none of which correlate with delivering value safely, and several of which actively reward the wrong behaviour.
The second pain is every team re-solving the same hard infrastructure problems. In an organisation of any size, dozens of teams independently figure out how to build a container, wire a pipeline, provision a database, get a TLS certificate, set up logging and metrics, manage secrets, and pass a security review. The result is weeks of onboarding per service, wild inconsistency in how things are secured and observed, a long tail of bespoke pipelines nobody understands, and senior engineers burned on toil instead of product. Platform engineering centralises the genuinely hard, genuinely shared parts into a self-service platform — but only the parts that should be shared — while preserving team autonomy through golden paths the teams can step off when they have a real reason to.
The coupling is the whole point. DORA metrics tell you which bottleneck to attack; the platform is how you attack it at scale; and the metrics then tell you whether the platform worked. Build the platform without the metrics and you’ll automate the wrong thing beautifully. Measure without building the platform and you’ll have a dashboard full of red numbers and no lever to move them.
Who hits this: any organisation past roughly five to ten teams, where the cost of not having shared paths starts to exceed the cost of building and running them; any team whose leadership is asking “are we fast?” and getting hand-waving; and any platform team that built an IDP nobody adopted because they never measured the pain they were supposed to relieve.
To frame the field before the deep dive, here is the loop this article teaches — the four questions, the metric that answers each, and the platform capability that typically moves it:
| Delivery question | DORA metric that answers it | Primary bottleneck it exposes | Platform capability that usually moves it |
|---|---|---|---|
| How often do we ship to users? | Deployment frequency | Big batches, manual gates, fear of deploying | Golden-path CI/CD, trunk-based dev, one-click deploy |
| How long from code to production? | Lead time for changes | Slow review, flaky tests, change-approval boards | Fast pipelines, automated tests, paved-road templates |
| How often does a deploy break things? | Change failure rate | No tests, no progressive delivery, big bang | Quality gates, canary/blue-green, automated rollback |
| How fast do we recover when it breaks? | Time to restore service (MTTR) | No observability, manual rollback, no runbooks | Default observability, instant rollback, SLOs |
Learning objectives
By the end of this article you can:
- Define each of the four DORA metrics precisely, name the exact start/stop events you must capture for an honest measurement, and avoid the common mis-definitions that make a metric lie.
- Place a team or service into the elite / high / medium / low performance bands for each metric, and read the relationship between the throughput pair (frequency, lead time) and the stability pair (change failure rate, time to restore).
- Instrument all four metrics from real sources — a deployments table, GitHub/GitLab/Azure DevOps APIs, pipeline telemetry, an incident tracker — and write the queries (SQL, KQL, PromQL) that compute them.
- Explain why the four metrics resist gaming as a set, which ones are vanity in isolation, and how to add guardrail metrics (and the fifth “reliability” signal) so optimising one doesn’t wreck another.
- Define platform engineering, the Internal Developer Platform, golden paths and “paved roads,” and decide what belongs on the platform versus what stays with product teams.
- Stand up the mental model for a Backstage software catalog, software templates (scaffolder) and TechDocs, and map an IDP’s planes (developer control plane, integration/orchestration, resource plane) to concrete tools.
- Apply Team Topologies (stream-aligned, platform, enabling, complicated-subsystem teams; the three interaction modes) so the platform is run as a product and not as a ticket queue, and recognise the anti-patterns (platform-as-gatekeeper, golden cage, building before listening, metrics theatre) before they bite.
Prerequisites & where this fits
You should already be fluent in modern delivery mechanics: what a CI/CD pipeline is and what its stages do, the difference between blue-green, canary and rolling deployments, how progressive delivery and feature flags decouple deploy from release, and the three pillars of observability — logs, metrics, traces and SLOs. You should know what Infrastructure as Code buys you and roughly how GitOps with Argo CD or Flux reconciles desired state from Git, because both are load-bearing for a real platform.
This article sits at the top of the DevOps track — it is the measurement-and-scale layer that sits above the individual practices. DORA metrics are the scoreboard for everything those upstream articles teach; platform engineering is the operating model that lets you apply those practices consistently across many teams instead of one. If CI/CD platforms and Git branching strategies are the tools and tactics, this is the strategy and scoreboard.
A quick map of who owns and consumes each layer, so you wire the right people to the right number:
| Layer | What lives here | Who owns it | Which DORA metric it most affects |
|---|---|---|---|
| Version control / review | Branching, PRs, review SLAs | Stream-aligned teams | Lead time (review latency) |
| CI (build + test) | Build, unit/integration tests, scans, quality gates | Teams + platform (shared templates) | Lead time, change failure rate |
| CD (deploy) | Deploy strategy, approvals, rollback | Teams (on golden-path CD) | Deployment frequency, time to restore |
| Runtime / observability | Logs, metrics, traces, SLOs, alerting | Platform provides defaults; teams own SLOs | Time to restore, change failure rate |
| Internal Developer Platform | Templates, catalog, self-service infra | Platform team (as a product) | All four (it removes the bottleneck) |
| Org design | Team boundaries, cognitive load, interaction modes | Engineering leadership | All four (indirectly, decisively) |
Core concepts
Six mental models make every later section obvious.
DORA measures the system, not the individual. The four metrics describe how the delivery system of a team or product performs — not how productive a person is. Used per-engineer they become surveillance and get gamed instantly; used per-team or per-service over time they are a remarkably honest signal of delivery health. The research finding that matters: high throughput and high stability are not a trade-off — elite performers are better at both at once, because the same practices (small batches, automation, fast feedback) improve speed and safety together. Any framing of “we slowed down to be safe” usually means you lack the automation that makes safe also fast.
Throughput and stability are two pairs, read together. Deployment frequency and lead time for changes are the throughput (velocity) pair — how much, how fast. Change failure rate and time to restore service are the stability pair — how safe, how resilient. A single metric in isolation lies: high deployment frequency with a 40% change failure rate is a fire, not a triumph; a 2% change failure rate achieved by deploying once a quarter is stagnation dressed as quality. You read the four as a set, and you read the two pairs against each other.
Every metric is a clock between two events — define both ends or the number is fiction. Each metric is the duration or count between two timestamped events. Lead time for changes is the clock from code committed to that code running in production — not from “ticket created” (which measures your backlog, not your delivery) and not to “merged to main” (which stops the clock before the value reaches a user). Time to restore is from a user-impacting incident begins to service is restored. Get the two endpoints right and the metric is trustworthy and automatable; get them wrong and you’ll optimise a number that doesn’t mean what you think.
A deployment is to production and user-facing. Counting CI runs, staging deploys, or merges as “deployments” inflates deployment frequency into vanity. The honest definition: a successful deployment of code to the production environment that could reach users (whether or not a feature flag gates the actual release). This is exactly why progressive delivery matters — it lets you deploy frequently (the metric you want high) while controlling release (the risk you want low) independently.
Platform engineering is product management for infrastructure. A platform is an internal product whose customers are your own developers; its job is to reduce their cognitive load and remove toil by offering self-service golden paths — the well-supported, secure, observable default way to do a common thing (create a service, ship it, get a database, see its logs). “Golden path,” “paved road” and “well-lit path” are synonyms. The platform is opt-in by being the easiest option, not mandatory by decree — the moment it’s a mandate you’ve built a gate, not a path.
Build the platform from measured pain, run it as a product. The platform’s backlog comes from the DORA metric you’re losing on and from listening to developers, not from what the platform team finds fun to build. It has users, a roadmap, adoption metrics, on-call, docs and a feedback loop — or it becomes shelfware. This is the single biggest determinant of whether platform engineering succeeds or fails, and it’s an operating-model decision, not a tooling one.
The DORA four in one table
Pin down all four before the deep sections. This is the mental model side by side; the per-metric sections expand each with measurement detail:
| Metric | What it measures | Pair | Start event | Stop / count event | Honest definition gotcha |
|---|---|---|---|---|---|
| Deployment frequency | How often you deploy to prod | Throughput | — (it’s a count over time) | A successful production deploy | Don’t count CI runs or staging deploys |
| Lead time for changes | Commit → running in prod | Throughput | First commit of the change | That change live in production | Not from “ticket”; not to “merged” |
| Change failure rate | % of deploys causing a failure | Stability | A production deploy | It caused a degradation/incident/rollback | “Failure” must mean user-impacting, defined upfront |
| Time to restore service | Incident start → restored | Stability | User-impacting incident begins | Service restored to users | Detection time counts; “ticket closed” ≠ restored |
The performance bands (elite / high / medium / low)
DORA’s research clusters performers into four bands. The exact numbers shift year to year in the State of DevOps report, but the shape is stable and is what you should internalise — the gap between elite and low is orders of magnitude, not percentages. Use these as orientation, not gospel; your own trend over time matters far more than hitting a global band:
| Metric | Elite | High | Medium | Low |
|---|---|---|---|---|
| Deployment frequency | On-demand (multiple deploys/day) | Between once/day and once/week | Between once/week and once/month | Between once/month and once every 6 months |
| Lead time for changes | Less than one hour | Between one day and one week | Between one week and one month | Between one month and six months |
| Change failure rate | 0–15% | 16–30% (varies by report) | similar band | Higher / more variable |
| Time to restore service | Less than one hour | Less than one day | Between one day and one week | Between one week and one month |
How to read the bands without fooling yourself — the traps each one hides:
| Band-reading question | The trap | The honest reading |
|---|---|---|
| “We deploy 10×/day — we’re elite!” | Frequency alone is vanity | Only elite if change failure rate and restore time are also good |
| “Our lead time is 30 minutes” | Measured to merge, not to prod | Re-measure to running-in-production; it’s usually much longer |
| “Change failure rate is 2%” | Achieved by deploying rarely | Cross-check deployment frequency; rare + low CFR = stagnation |
| “MTTR is 20 minutes” | Clock starts at ticket, not at impact | Start at detection/impact; include the time you didn’t notice |
| “We’re medium and stuck” | Comparing to a global band | Compare to your own last quarter; trend beats absolute band |
Metric 1 — Deployment frequency
Deployment frequency is how often your team successfully releases code to production. It is the simplest metric to state and the easiest to fake, so the definition discipline matters most here. It is a count over a window (deploys per day/week), and the canonical “elite” expression is on-demand: whenever a change is ready, it ships, often many times a day, with no batching and no calendar.
Why it’s the headline metric: frequency is a proxy for batch size. Teams that deploy often are, by necessity, shipping small changes — and small changes are easier to review, test, reason about, and roll back. A team deploying once a month is shipping a giant batch of coupled changes whose blast radius on failure is huge and whose root cause on failure is a needle in a haystack. So “deploy more often” is really “make your batches small,” which is the root cause of most other improvements.
What counts and what doesn’t — get this wrong and every downstream number is polluted:
| Event | Counts as a deployment? | Why |
|---|---|---|
| Successful deploy of code to production | Yes | This is the definition |
| Deploy to staging / QA / pre-prod | No | Not user-reachable; inflates the number |
| A CI build that passed | No | A build is not a deploy |
A merge to main |
No (unless main auto-deploys to prod) | Merge ≠ release to users |
| Config/feature-flag flip with no code deploy | Judgment call | Count if it changes prod behaviour and you want release-frequency too |
| A failed/rolled-back production deploy | Count separately (it feeds change failure rate) | It happened, but it’s a failed deploy |
| Re-deploy of the same artifact (no change) | No | No new value reached users |
How to measure deployment frequency
The cleanest source is a deployments table you write a row to from the final, successful production-deploy step of every pipeline. This decouples the metric from any one CI tool and survives tool migrations. The minimal schema:
| Column | Type | Example | Why you need it |
|---|---|---|---|
deployment_id |
uuid | 7f3a… |
Idempotency / joins to incidents |
service |
text | checkout-api |
Per-service breakdown |
team |
text | payments |
Per-team rollup |
environment |
text | production |
Filter to prod only |
commit_sha |
text | a1b2c3d |
Join to VCS for lead time |
deployed_at |
timestamptz | 2026-06-23T09:14:02Z |
The count’s timestamp |
status |
text | succeeded / failed |
Frequency counts succeeded; CFR uses failed |
version |
text | 1.8.3 |
Correlate with incidents |
From that table, deployment frequency is a trivial aggregation. Daily deploys per service over the last 30 days:
-- Deployment frequency: successful production deploys per service per day (last 30 days)
SELECT
  service,
  date_trunc('day', deployed_at) AS day,
  count(*) AS deploys
FROM deployments
WHERE environment = 'production'
  AND status = 'succeeded'
  AND deployed_at >= now() - interval '30 days'
GROUP BY service, day
ORDER BY service, day;
If you’d rather emit a metric than query a table, increment a Prometheus counter from the deploy step and let your dashboard do the rate:
# Deploys per day, per service, over the last 30 days (counter incremented on each prod deploy)
sum by (service) (increase(deploy_total{environment="production", status="succeeded"}[30d])) / 30
If you have no deployments table yet, you can derive frequency from the CI/CD API. GitHub exposes Deployments and deployment statuses; Azure DevOps exposes pipeline runs and release deployments; GitLab exposes deployments per environment. Pull successful production deployments and count them:
# GitHub: count successful production deployments in a repo over a window
gh api -X GET "repos/acme/checkout-api/deployments?environment=production&per_page=100" \
  --jq '[.[] | select(.created_at > "2026-05-24")] | length'
The source options, with the trade-off of each:
| Source | How you get the events | Pros | Cons / gotcha |
|---|---|---|---|
| Dedicated deployments table | Insert a row from the deploy step | Tool-agnostic, exact, survives migrations | You must instrument every pipeline once |
| Prometheus deploy counter | increase() on a counter |
Lives with your other metrics; cheap dashboards | Counter resets; needs care over restarts |
| GitHub Deployments API | gh api .../deployments |
No extra plumbing if you already use Deployments | Only as accurate as your Deployments usage |
| Azure DevOps runs/releases | REST API / az pipelines |
Native to Azure pipelines | Distinguish stage success vs pipeline success |
| GitLab environments/deployments | REST/GraphQL API | Per-environment, native | “Deployment” semantics vary by project setup |
| Git tags (release tags) | Count tags matching a pattern | Dead simple if you tag every release | Only works if tagging is disciplined and prod-only |
Metric 2 — Lead time for changes
Lead time for changes is the time from a change being committed to that change running in production. It is the metric most often mis-measured, and the mis-measurement always flatters you. The two correct endpoints are first commit of the change and that commit live in production; everything between — review, CI, queueing, approvals, the deploy itself — is the value-stream latency this metric exposes.
Why the endpoints matter so much: starting the clock at “ticket created” measures how long work sat in your backlog (a planning concern, not a delivery one) and makes a fast-delivering team look slow because a ticket aged for two weeks before anyone picked it up. Stopping the clock at “merged to main” hides the often-large gap between merge and a real production release — the deploy queue, the change-approval board, the weekly release train. Lead time is the metric that surfaces your delivery pipeline’s latency, so both ends must be on the delivery pipeline: code in, value out.
Lead time decomposes into stages, and decomposing it is how you find the bottleneck — the whole point of measuring it. A typical breakdown and where each stage’s time hides:
| Stage of lead time | Clock from → to | Where the time goes | Platform/practice lever |
|---|---|---|---|
| Coding (pre-commit) | (not counted) | — | (out of scope by definition) |
| Review wait | First commit → PR approved | Reviewer latency, big PRs, timezone gaps | Small PRs, review SLAs, code owners |
| CI | PR opened → checks green | Slow/flaky tests, serial stages, no caching | Fast parallel tests, caching, golden-path CI |
| Merge → deploy queue | Merged → deploy starts | Release trains, manual approvals, CAB | Continuous deployment, automate approvals |
| Deploy | Deploy starts → live in prod | Slow rollout, manual steps, big artifacts | One-click/automated deploy, progressive rollout |
| (optional) release | Deployed → flag flipped on | Decoupled by feature flags | Progressive delivery (separate metric) |
How to measure lead time for changes
You join two facts: the first commit timestamp of the change (from your VCS) and the production deploy timestamp of the commit that contains it (from your deployments table). The simplest robust approximation many teams use: for each production deployment, take the commits newly included since the previous production deployment, and compute deployed_at - commit.authored_at for each; the median (or 50th/85th percentile) over a window is your lead time.
With a deployments table that records commit_sha, and a commits table (or a VCS API call) giving each commit’s authored_at, the median lead time per service:
-- Median lead time for changes (commit authored → deployed to prod), last 30 days, per service
WITH deploy_pairs AS (
  SELECT d.service,
         d.deployed_at,
         c.authored_at,
         EXTRACT(EPOCH FROM (d.deployed_at - c.authored_at)) / 3600.0 AS lead_hours
  FROM deployments d
  JOIN deployment_commits dc ON dc.deployment_id = d.deployment_id
  JOIN commits c            ON c.sha = dc.commit_sha
  WHERE d.environment = 'production'
    AND d.status = 'succeeded'
    AND d.deployed_at >= now() - interval '30 days'
)
SELECT service,
       percentile_cont(0.5)  WITHIN GROUP (ORDER BY lead_hours) AS p50_lead_hours,
       percentile_cont(0.85) WITHIN GROUP (ORDER BY lead_hours) AS p85_lead_hours
FROM deploy_pairs
GROUP BY service
ORDER BY p50_lead_hours DESC;
If your pipeline telemetry lands in a log/metrics store (e.g. an Azure DevOps or GitHub Actions export into a Log Analytics workspace), you can compute the same thing in KQL by joining a PipelineRun table (carrying commit and deploy times) and summarising percentiles:
// Lead time for changes from pipeline telemetry: commit time → successful prod deploy
PipelineRun
| where environment == "production" and result == "succeeded"
| where deployFinished > ago(30d)
| extend leadHours = datetime_diff('minute', deployFinished, commitAuthoredTime) / 60.0
| summarize p50=percentile(leadHours, 50), p85=percentile(leadHours, 85), deploys=count() by service
| order by p50 desc
Measurement choices that change what the number means — decide each deliberately:
| Choice | Option A | Option B | Recommendation |
|---|---|---|---|
| Start event | First commit of the change | PR opened | First commit (DORA-canonical) |
| End event | First prod deploy containing it | Merge to main | First prod deploy |
| Aggregation | Median (p50) | Mean | p50 + p85 (mean is skewed by outliers) |
| Per-commit vs per-PR | Each commit | Each PR/change | Per-change is more intuitive; per-commit is simpler |
| Window | 7 / 30 / 90 days | — | 30 days for a stable trend, 7 for fast feedback |
| Weekend/holiday handling | Wall-clock | Business hours only | Wall-clock (users don’t care about your calendar) |
A worked number: if a change is committed Monday 10:00, the PR waits a day for review (slow reviewer), CI is 25 minutes, it merges Tuesday 11:00, then waits for Thursday’s release train and deploys Thursday 14:00 — the lead time is ~76 hours, of which only 25 minutes was CI. The decomposition instantly tells you the levers are review latency and the release train, not your test speed — which you’d never have known from the single aggregate number.
Metric 3 — Change failure rate
Change failure rate (CFR) is the percentage of deployments to production that result in a degraded service requiring remediation — a rollback, a hotfix, a patch, or an incident. It is the first of the two stability metrics, and the one whose definition you must nail down before you start measuring, because “failure” is subjective unless you make it concrete.
The honest definition has two halves. First, “failure” means user-impacting degradation or an event that required unplanned remediation — not “a test failed in CI” (that’s pre-production and is good; it caught the problem), and not “we found a minor bug next sprint.” Second, it is a rate: failures divided by total deployments over the same window. A team that deploys 100 times and rolls back 5 has a 5% CFR; a team that deploys twice and rolls back once has 50% — frequency context is essential, which is why you read CFR next to deployment frequency, never alone.
What counts as a “failed change” — agree this with your team and write it down:
| Event after a deploy | Counts toward CFR? | Note |
|---|---|---|
| Rollback to the previous version | Yes | The canonical signal |
| Hotfix/patch deployed to fix the deploy | Yes | Remediation = failure |
| A production incident attributed to the deploy | Yes | Link incident → deployment |
| Feature flag turned off to stop user impact | Yes | Release-level failure |
| A test failed in CI (caught pre-prod) | No | This is the system working |
| A pre-existing bug surfaced, unrelated to the deploy | No | Not caused by this change |
| Planned rollback for a business reason | Judgment call | Usually no, if no degradation occurred |
How to measure change failure rate
You need two things you already have once you’ve built the deployments table: a count of production deployments, and a way to mark which deployments failed (caused remediation). The cleanest approach is to link your incident tracker (PagerDuty, Opsgenie, Jira incidents, an incidents table) to deployments — by service and time window, or better, by an explicit caused_by_deployment_id. Then CFR is failed deployments over total deployments:
-- Change failure rate per service (last 30 days):
-- a deploy is "failed" if it was rolled back OR an incident references it
WITH prod AS (
  SELECT * FROM deployments
  WHERE environment = 'production' AND status = 'succeeded'
    AND deployed_at >= now() - interval '30 days'
),
failed AS (
  SELECT DISTINCT p.deployment_id, p.service
  FROM prod p
  LEFT JOIN incidents i ON i.caused_by_deployment_id = p.deployment_id
  WHERE p.was_rolled_back = true OR i.id IS NOT NULL
)
SELECT p.service,
       count(*)                              AS total_deploys,
       count(f.deployment_id)                AS failed_deploys,
       round(100.0 * count(f.deployment_id) / count(*), 1) AS change_failure_rate_pct
FROM prod p
LEFT JOIN failed f ON f.deployment_id = p.deployment_id
GROUP BY p.service
ORDER BY change_failure_rate_pct DESC;
If incidents and deploys live in a metrics/log store, the KQL equivalent joins a Deployments table to an Incidents table on service within a short post-deploy window (a deploy that precedes an incident on the same service by less than, say, 60 minutes is a candidate cause):
// Change failure rate from telemetry: deploys joined to incidents within 60 min on the same service
let window = 30d;
let deploys = Deployments | where environment == "production" and result == "succeeded" and deployedAt > ago(window);
let fails = deploys
  | join kind=leftouter (Incidents | where startedAt > ago(window)) on service
  | where isnotempty(incidentId) and (startedAt - deployedAt) between (0min .. 60min)
  | distinct deploymentId, service;
deploys
| summarize total = count() by service
| join kind=leftouter (fails | summarize failed = count() by service) on service
| extend cfr_pct = round(100.0 * coalesce(failed, 0) / total, 1)
| project service, total, failed = coalesce(failed, 0), cfr_pct
| order by cfr_pct desc
The hard part is attribution — knowing which deploy caused which incident. The options, worst to best:
| Attribution method | How it works | Accuracy | Effort |
|---|---|---|---|
| Time-window heuristic | Incident within N minutes of a deploy on the same service | Low–medium (false positives) | Low |
| Manual tagging | Responder tags the incident with the deploy/version | Medium–high | Medium (process discipline) |
Explicit caused_by_deployment_id |
Incident record stores the deployment it was traced to | High | Medium (post-incident step) |
| Version correlation | Incident’s error telemetry carries service.version matching a deploy |
High | Medium (requires version in telemetry) |
| Automated rollback signal | An automated rollback is the failure event | High | Low (if you have automated rollback) |
The most reliable signal of all is automated rollback: if your progressive-delivery system rolls back a canary on a bad SLO, that rollback is an unambiguous, machine-recorded failed change — no human attribution needed. This is one more reason elite teams’ stability metrics are trustworthy: their tooling records the failures for them.
Metric 4 — Time to restore service
Time to restore service (often written MTTR, mean time to restore/recovery) is how long it takes to restore service after a user-impacting production failure. It is the second stability metric and answers the question that actually matters to users: when it breaks, how fast do you make it right? Crucially, the clock starts when the impact begins (or is detected), not when a ticket is opened or when an engineer happens to look — the time you didn’t notice is part of your restore time, and pretending otherwise hides your worst gap.
The endpoints: start at incident begins / is detected (user impact starts), stop at service restored (users are served correctly again — which may be before the full root-cause fix, because a rollback or failover restores service while the real fix lands later). Distinguish restore (users are OK again) from resolve (the underlying defect is fixed); DORA measures restore. A team that can roll back in two minutes has an elite restore time even if the proper fix takes two days.
Restore time decomposes, and the decomposition tells you where to invest:
| Phase of restore | Clock from → to | What dominates it | Lever to shrink it |
|---|---|---|---|
| Detection | Impact starts → alert fires | Missing/blind alerting, no SLOs | SLO-based alerting, synthetic checks |
| Acknowledgement | Alert fires → human responding | On-call paging, escalation gaps | Clear on-call, fast paging, runbooks |
| Diagnosis | Responding → cause localised | Poor observability, no traces | Logs/metrics/traces, deploy markers |
| Mitigation | Cause known → service restored | Manual rollback, no instant lever | One-click/automated rollback, failover |
| (later) resolution | Restored → defect fixed | (not part of MTTR) | Post-incident review |
How to measure time to restore service
The source is your incident tracker: each incident needs a started_at (impact began/detected) and a restored_at (service restored). MTTR is the central tendency of restored_at - started_at over a window — and you should report the median and p90, not just the mean, because one nightmarish incident skews the mean and hides your typical recovery:
-- Time to restore service: median and p90 over incidents in the last 90 days, per service
SELECT
  service,
  count(*) AS incidents,
  percentile_cont(0.5) WITHIN GROUP (
    ORDER BY EXTRACT(EPOCH FROM (restored_at - started_at)) / 60.0
  ) AS p50_restore_minutes,
  percentile_cont(0.9) WITHIN GROUP (
    ORDER BY EXTRACT(EPOCH FROM (restored_at - started_at)) / 60.0
  ) AS p90_restore_minutes
FROM incidents
WHERE started_at >= now() - interval '90 days'
  AND restored_at IS NOT NULL
GROUP BY service
ORDER BY p90_restore_minutes DESC;
A practical subtlety: where does started_at come from? If you set it to the moment a human created the incident ticket, you’ve erased detection time. Better is to derive it from the first breaching data point — the timestamp your SLO/alerting first saw the error budget burn — which you can pull from your monitoring system. Tying restore time to the SLO that defines “impact” makes it objective and removes the temptation to start the clock late.
The data-quality choices that decide whether your MTTR is honest:
| Choice | Tempting (flattering) option | Honest option |
|---|---|---|
started_at |
When the ticket was created | When impact began / SLO first breached |
restored_at |
When the post-mortem was filed | When users were served correctly again |
| Which incidents count | Only the ones we remembered to log | All user-impacting incidents (enforce logging) |
| Central tendency | Mean only | Median + p90 (mean hides the long tail) |
| Restore vs resolve | Time to full root-cause fix | Restore (rollback/failover counts) |
Reading the four together — and the guardrails
The reason DORA endures where other engineering metrics fail is that the four resist gaming as a set. Push deployment frequency up by shipping reckless big-bang changes and your change failure rate spikes. Drive change failure rate to zero by deploying once a quarter and your frequency and lead time collapse. Hit a great lead time by skipping tests and your CFR and restore time blow out. The set has internal tension that keeps any single number honest — which is exactly why you must always look at all four, and at the two pairs against each other.
The classic two-by-two — throughput against stability — and what each quadrant means:
| High stability (low CFR, fast restore) | Low stability (high CFR, slow restore) | |
|---|---|---|
| High throughput (frequent, fast) | Elite — small batches + automation + progressive delivery | Fragile / reckless — fast but breaking things; add tests, gates, rollback |
| Low throughput (rare, slow) | Cautious / stuck — safe by deploying rarely; reduce batch size, automate | Low performer — slow and fragile; start with the worst metric |
Even four metrics can be gamed locally, so production teams add guardrail metrics and the now-commonly-cited fifth metric, reliability (how well the service meets its SLOs / user expectations), to keep the optimisation honest:
| Risk if you over-optimise… | …you might harm | Guardrail metric to watch |
|---|---|---|
| Deployment frequency | Stability, code quality | Change failure rate, defect escape rate |
| Lead time | Test coverage, review rigour | CFR, % changes with tests, review depth |
| Change failure rate (drive to 0) | Throughput (deploy too rarely) | Deployment frequency, batch size |
| Time to restore (optimise rollback) | Root-cause fixing (mask recurring bugs) | Incident recurrence rate, defect resolution time |
| All four (per-individual) | Trust, collaboration | Never measure per-individual; team-level only |
| Speed at all costs | User happiness | Reliability / SLO attainment (the 5th metric) |
A note on how to collect this honestly: the gold standard is automated, system-derived metrics (events emitted by your pipeline, VCS and monitoring) rather than survey-based self-report. Surveys (the original DORA research method) are valid for benchmarking culture and for organisations with no instrumentation, but for a live operational dashboard you want the four computed from real events — that’s what the queries above do, and it’s what removes the temptation to round your own numbers up.
Instrumenting the pipeline end to end
Now make it real. The architecture is: every pipeline emits deployment events; your VCS provides commit times; your incident tracker provides incident start/restore; a small metrics store (a database table, or Prometheus + a log store) holds the events; and a dashboard computes the four metrics and trends them. You can build this yourself, or adopt an off-the-shelf collector.
The events you must emit, from where, and what each metric consumes:
| Event | Emitted by | Carries | Feeds which metric |
|---|---|---|---|
deployment.started |
CD job (prod stage) | service, env, commit_sha, version, time | (timing/decomposition) |
deployment.finished |
CD job (prod stage) | + status (succeeded/failed) | Deployment frequency, CFR |
commit |
VCS webhook / API | sha, authored_at, author, PR | Lead time |
pr.merged |
VCS webhook | sha, merged_at | Lead-time decomposition |
incident.opened |
Incident tool / alerting | service, started_at, severity | Time to restore, CFR |
incident.restored |
Incident tool | restored_at | Time to restore |
rollback |
CD job / progressive-delivery | deployment_id, time | CFR (unambiguous failure) |
Emitting the deploy event is one block at the end of your production deploy job. In GitHub Actions, posting to your own collector:
# .github/workflows/deploy.yml — final step of the production deploy job
      - name: Record deployment for DORA metrics
        if: always()                      # record success AND failure
        run: |
          curl -fsS -X POST "$DORA_COLLECTOR_URL/deployments" \
            -H "Authorization: Bearer ${{ secrets.DORA_TOKEN }}" \
            -H "Content-Type: application/json" \
            -d "$(jq -n \
                  --arg svc   'checkout-api' \
                  --arg env   'production' \
                  --arg sha   '${{ github.sha }}' \
                  --arg ver   '${{ github.ref_name }}' \
                  --arg status '${{ job.status }}' \
                  '{service:$svc, environment:$env, commit_sha:$sha, version:$ver, status:$status, deployed_at:(now|todateiso8601)}')"
The Azure DevOps equivalent, as a final pipeline step:
# azure-pipelines.yml — record the production deployment
  - task: Bash@3
    displayName: Record deployment for DORA metrics
    condition: always()
    inputs:
      targetType: inline
      script: |
        curl -fsS -X POST "$(DORA_COLLECTOR_URL)/deployments" \
          -H "Authorization: Bearer $(DORA_TOKEN)" \
          -H "Content-Type: application/json" \
          -d "{\"service\":\"checkout-api\",\"environment\":\"production\",\"commit_sha\":\"$(Build.SourceVersion)\",\"version\":\"$(Build.BuildNumber)\",\"status\":\"$(Agent.JobStatus)\",\"deployed_at\":\"$(date -u +%FT%TZ)\"}"
Build vs buy — the realistic options and when each fits:
| Approach | What it is | Best when | Watch-out |
|---|---|---|---|
| Roll your own (table + queries) | Deployments/incidents tables + SQL dashboards | You want full control and the schema above | You own the plumbing and upkeep |
| Prometheus + Grafana | Deploy counter + incident gauge + panels | You already run Prometheus/Grafana | Counter semantics; not great for per-change lead time |
| Four Keys (open source) | Google’s reference DORA pipeline (BigQuery + dashboards) | GCP-centric, want a reference build | Opinionated; some assembly |
| CD platform built-in (e.g. GitLab, Azure DevOps Analytics) | Native DORA dashboards | You’re all-in on one platform | Only sees that platform’s data |
| Backstage DORA plugin | DORA shown in the developer portal | You already run Backstage | Depends on a backing data source |
| Commercial (LinearB, Sleuth, Faros, Cortex, etc.) | Managed metric collection + insights | You want it now, low effort | Cost; data leaves your estate |
The non-negotiable principle whichever you pick: derive the metrics from real events, scope them to team/service, and never to an individual. The moment a manager ranks engineers by these numbers, the numbers die — people optimise the metric, not the outcome, and your honest scoreboard becomes theatre.
From measuring to engineering delivery: platform engineering
You now have four honest numbers and, almost always, one that’s clearly worst. Improving it for one team is a project. Improving it across forty teams — without forty separate efforts — is platform engineering: building an internal product that makes the fast, safe path the default path for every team.
The core idea is cognitive load reduction. A modern stream-aligned team is asked to own its service end to end — code, build, pipeline, infrastructure, security, observability, on-call. That’s an enormous surface, and most of it is undifferentiated heavy lifting identical across teams. Platform engineering extracts the shared, hard parts into self-service capabilities so a product team can focus on its actual product. The deliverable is a set of golden paths: paved, supported, secure-by-default routes for the common things — create a new service, ship it, give it a database, see its logs, rotate its secrets — that a developer can self-serve in minutes without filing a ticket or reading a wiki.
What belongs on the platform versus what stays with the team — the single most important judgment call, because getting it wrong gives you either a useless platform (too little) or a straitjacket (too much):
| Capability | Platform provides | Team owns | Rationale |
|---|---|---|---|
| New-service scaffolding | The template + scaffolder | Choosing to use it; filling in business logic | Shared shape, team’s content |
| CI/CD pipeline | Reusable pipeline templates | Their pipeline config (built from templates) | Shared mechanics, team’s stages |
| Infrastructure (DB, queue, cache) | Self-service modules + provisioning | Requesting + configuring theirs | Shared IaC, team’s resources |
| Observability | Default dashboards, log/trace wiring, SLO scaffolding | Their service’s SLOs and alerts | Shared instrumentation, team’s targets |
| Secrets management | The secrets store + access pattern | Their secrets and rotation | Shared mechanism, team’s data |
| Security/compliance | Baked-in scanning, policy, golden-path approvals | Fixing their findings | Shared guardrails, team’s code |
| Business logic | (nothing) | Everything | Never on the platform |
| Service-specific architecture | (nothing) | Everything | Team autonomy |
The trap on both ends, stated plainly:
| Failure mode | What it looks like | Why it happens | The fix |
|---|---|---|---|
| Platform too thin | Teams still re-solve infra; no adoption | Built abstractions nobody needed | Build from measured pain + user research |
| Platform too thick (golden cage) | Advanced teams blocked; escape hatches missing | Mandate over enablement | Make paths optional; provide escape hatches |
| Platform-as-gatekeeper | Self-service becomes a ticket queue | Run as ops/approval function, not product | Self-service APIs; product operating model |
| Platform-as-tech-museum | Cool tech, no users | Built what was fun, not what was needed | Adoption metrics; sunset unused capabilities |
The Internal Developer Platform (IDP)
An Internal Developer Platform is the productised layer through which developers self-serve those golden paths. It is not one tool; it’s a thin, opinionated integration over your existing infrastructure that gives developers a coherent, self-service interface and gives the platform team a place to encode standards. A useful way to reason about an IDP is by its planes (popularised by the “platform engineering reference architecture” mental model):
| Plane | What it does | Concrete examples |
|---|---|---|
| Developer control plane | The interface developers actually touch | Portal (Backstage), CLI, service templates, Git as the API |
| Integration & delivery plane | Glue that turns intent into action | CI/CD, GitOps controllers (Argo CD/Flux), image registry, secrets operator |
| Resource plane | The real infrastructure being provisioned | Kubernetes, managed DBs, queues, cloud accounts, networking |
| Monitoring & logging plane | Feedback on what’s running | Metrics, logs, traces, SLO/error-budget tooling |
| Security plane | Guardrails across the others | Policy-as-code (OPA/Kyverno), image scanning, secret management, RBAC |
The IDP’s job is to let a developer express intent (“I need a new payments worker with a Postgres database and standard observability”) and have the platform realise it through those planes — provisioning the infra, wiring the pipeline, registering the service in the catalog, attaching dashboards — without the developer touching the resource plane directly. The interface to that intent is typically one of:
| IDP interface style | How developers interact | Strength | When to choose it |
|---|---|---|---|
| Portal-driven (Backstage) | Web UI: browse catalog, run templates | Discoverable, great for many teams | Large orgs; non-expert users |
| Git-driven / GitOps | Commit a manifest; controllers reconcile | Auditable, declarative, no UI to maintain | Teams comfortable with Git as the API |
| CLI-driven | platform create service … |
Fast for power users; scriptable | Engineer-heavy orgs |
| API-driven | Call the platform’s API directly | Composable; build your own UX on top | When integrating into other tooling |
| Crossplane / control-plane | Kubernetes CRDs as the platform API | Cloud-native, reconciled, extensible | K8s-centric platforms |
Most mature platforms combine these — a Backstage portal for discovery and scaffolding, GitOps underneath for the actual reconciliation, and a CLI for power users — all hitting the same underlying capabilities.
Golden paths in practice
A golden path is only “golden” if it is genuinely the easiest option and it bakes in the standards you want by default. Concretely, the “create a new service” golden path should, from a single template invocation, produce: a repository with a sensible service skeleton, a working CI/CD pipeline (built from the shared templates), default observability (logs/metrics/traces wired, a starter dashboard, an SLO stub), secrets wired via the platform’s store, security scanning enabled, and the service registered in the software catalog. The developer fills in business logic; everything around it is already paved.
The canonical golden paths and what each removes:
| Golden path | What the developer does | What the platform does automatically | Toil it removes |
|---|---|---|---|
| Create a service | Run the template, name it, pick a type | Repo, pipeline, dashboards, SLO stub, catalog entry, secrets wiring | Days of copy-paste scaffolding |
| Ship a change | Merge to main | Build, test, scan, deploy via golden-path CD, record DORA event | Re-inventing the deploy pipeline |
| Get a database | Request via portal/manifest | Provision (IaC module), inject connection via secrets, register | Tickets + bespoke Terraform |
| Observe a service | (nothing extra) | Default dashboards, log/trace correlation, alert templates | Wiring observability from scratch |
| Rotate a secret | Update in the secrets store | Propagate to running workloads | Hand-rolled secret distribution |
| Roll back | One click / automated on SLO breach | Revert to previous version, record failure | Manual, slow, scary rollbacks |
The discipline that keeps a golden path healthy — it is a product feature, not a one-time scaffold:
- It must stay golden. If the template drifts from current best practice, teams that scaffolded last year are stranded. Version the templates and provide an update path.
- Escape hatches are mandatory. A team with a legitimate reason to leave the path must be able to, without a fight. The path is a default, not a wall — the moment it’s a wall, advanced teams route around the whole platform.
- Adoption is the success metric. A golden path nobody uses is a failed product. Track how many services were created via the template versus by hand, and treat low adoption as a product problem to investigate, not a compliance problem to enforce.
Backstage and the software catalog
Backstage — the open-source developer-portal framework Spotify created and donated to the CNCF — is the most common implementation of the developer control plane. It is not “the platform”; it’s the front door to the platform. Its three load-bearing features:
| Backstage feature | What it does | Why it matters |
|---|---|---|
| Software Catalog | A registry of all services/components/APIs/resources, each described by a catalog-info.yaml and an owner |
Answers “what do we have, who owns it, how do I find it?” — the end of tribal knowledge |
| Software Templates (Scaffolder) | Parameterised templates that generate a new repo/service from the golden path | Turns “create a service” into a form, not a three-week odyssey |
| TechDocs | Docs-as-code rendered in the portal next to each component | Docs live with the code and are actually discoverable |
The catalog is anchored by a small descriptor committed to each repo. A minimal catalog-info.yaml for a service:
apiVersion: backstage.io/v1alpha1
kind: Component
metadata:
  name: checkout-api
  description: Checkout and payment orchestration service
  annotations:
    github.com/project-slug: acme/checkout-api
    backstage.io/techdocs-ref: dir:.
spec:
  type: service
  lifecycle: production
  owner: team-payments         # resolves to a Group entity in the catalog
  system: commerce
  dependsOn:
    - resource:postgres-checkout
    - component:identity-api
A software template (scaffolder) that is the “create a service” golden path — collect inputs, fetch a skeleton, push a repo, register it:
apiVersion: scaffolder.backstage.io/v1beta3
kind: Template
metadata:
  name: golden-path-service
  title: New production service (golden path)
spec:
  parameters:
    - title: Service details
      required: [name, owner]
      properties:
        name:  { type: string, description: Service name (kebab-case) }
        owner: { type: string, ui:field: OwnerPicker }
  steps:
    - id: fetch
      name: Fetch skeleton
      action: fetch:template
      input:
        url: ./skeleton            # repo skeleton: pipeline, Dockerfile, SLO stub, catalog-info
        values: { name: '${{ parameters.name }}', owner: '${{ parameters.owner }}' }
    - id: publish
      name: Create repository
      action: publish:github
      input:
        repoUrl: github.com?owner=acme&repo=${{ parameters.name }}
        defaultBranch: main
    - id: register
      name: Register in catalog
      action: catalog:register
      input:
        repoContentsUrl: ${{ steps.publish.output.repoContentsUrl }}
        catalogInfoPath: /catalog-info.yaml
Where Backstage fits among portal options — it’s the default, not the only choice:
| Portal option | Type | Pros | Cons |
|---|---|---|---|
| Backstage | Open-source framework (CNCF) | Hugely extensible, big plugin ecosystem, vendor-neutral | You build and run it; non-trivial to operate |
| Port | SaaS IDP portal | Fast to stand up, low ops | Cost; less code-level control |
| Cortex | SaaS (catalog + scorecards) | Strong service maturity scorecards | Cost; opinionated |
| OpsLevel | SaaS (catalog + standards) | Good for service ownership/standards | Cost |
| Cloud-native (Crossplane + CLI/GitOps) | Build-your-own control plane | Declarative, K8s-native, no portal to run | More plumbing; no UI unless you add one |
| Roll-your-own portal | Internal app | Exactly your needs | Highest build/maintenance cost |
A blunt caution: Backstage is not your platform strategy. Standing up a portal without golden paths behind it gives you a pretty catalog of services and no removed toil. Build the paved roads first; the portal is how developers discover and trigger them.
Team Topologies: the operating model that makes it work
The reason most platform efforts fail is organisational, not technical — so the org model deserves equal billing. Team Topologies (Skelton & Pais) gives the language. It defines four team types and three interaction modes, and a platform team only works if it sits in the right relationship to the rest.
The four team types:
| Team type | Purpose | Example | Relationship to the platform |
|---|---|---|---|
| Stream-aligned | Owns a slice of business value end to end | The payments team, the checkout team | The platform’s customers |
| Platform | Provides self-service internal products that reduce others’ cognitive load | The IDP / golden-path team | Runs the platform as a product |
| Enabling | Helps stream-aligned teams adopt new skills/practices, then leaves | An SRE-coaching team teaching SLOs | Boosts adoption; not a permanent dependency |
| Complicated-subsystem | Owns a part needing deep specialist expertise | A real-time pricing engine, ML platform | May consume or be consumed by the platform |
The three interaction modes, and which the platform should default to:
| Interaction mode | What it means | When the platform uses it |
|---|---|---|
| X-as-a-Service | Consume a capability with minimal collaboration | The default — golden paths are self-service |
| Collaboration | Two teams work closely for a time to figure something out | Early, when co-designing a new golden path with a pilot team |
| Facilitating | One team helps another improve (enabling-style) | When helping a team adopt the platform or unblock a gap |
The decisive principle: a platform team should interact with stream-aligned teams primarily as X-as-a-Service. If the dominant mode is collaboration (the platform team has to get involved every time a product team ships) you haven’t built a platform — you’ve built a bottleneck wearing a platform’s name badge. The platform’s whole value is that product teams don’t need to talk to it to get the common things done.
How a platform team avoids becoming the bottleneck it was meant to remove — these are the practices, stated as rules:
- Run it as a product: named product owner, a roadmap driven by user pain and the worst DORA metric, adoption metrics, and a public backlog.
- Self-service over tickets: the default interface is an API/portal/template, not “file a request and wait.” A ticket queue is the failure mode.
- Treat developers as customers: user research, satisfaction surveys, office hours, and a feedback loop — measure platform NPS/adoption, not just uptime.
- Optional, not mandatory: golden paths win by being the easiest path; escape hatches are first-class. Mandates breed shadow platforms.
- On-call for your platform: if the platform is in the critical path of every team’s delivery, it needs production-grade reliability and an on-call rota.
- Reduce cognitive load, measurably: the test of every capability is “did this make a stream-aligned team’s life simpler?” — if not, cut it.
Architecture at a glance
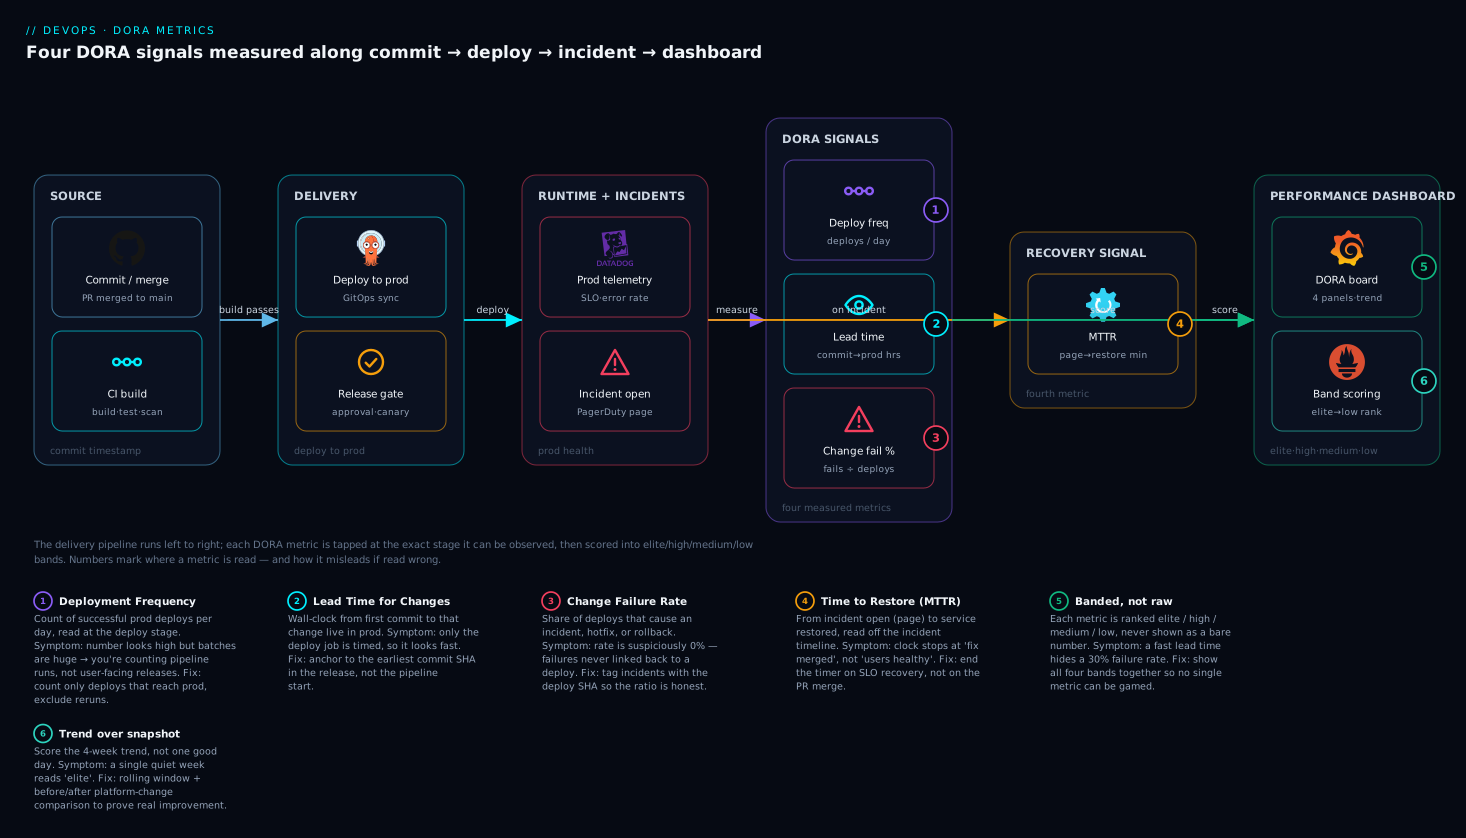
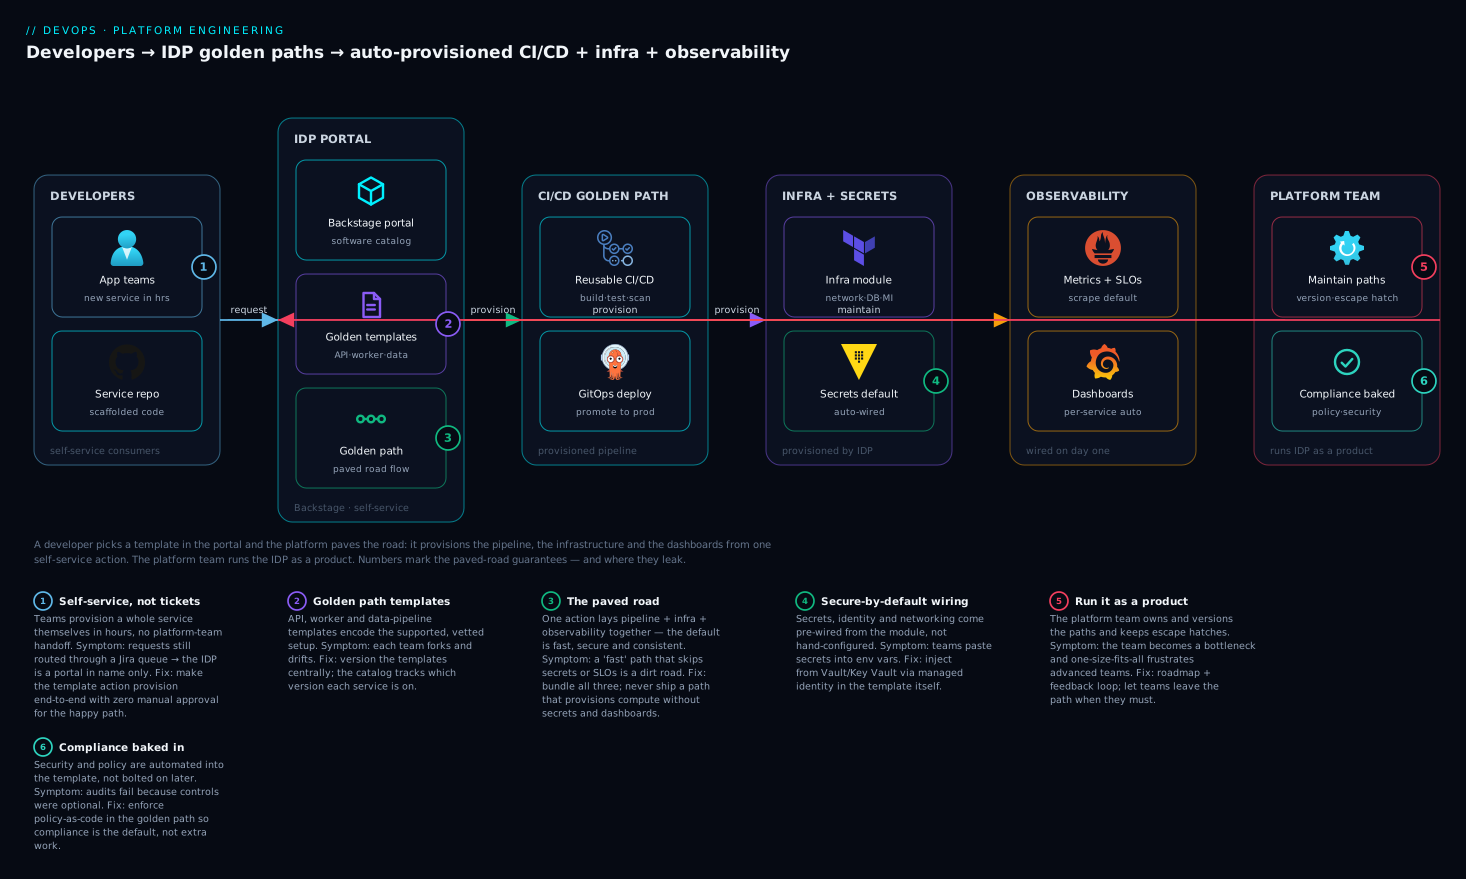
Two diagrams tell the whole story: how the four metrics are derived (the scoreboard) and how the platform delivers golden paths (the engine that moves the scoreboard).
The first diagram traces DORA measurement end to end. Read it left to right: developer commits flow into version control, which timestamps each commit (the start of lead time); changes move through CI (build, test, scan — where quality gates catch failures before production, protecting change failure rate) and into CD, whose successful production deploy is the event that feeds deployment frequency and stops the lead-time clock. In production, observability and SLOs watch the running service; when a deploy degrades the service, an incident opens (its start-to-restore span is time to restore, and its link back to the deploy is change failure rate). Every one of these events streams into a metrics store, and a dashboard renders the four numbers and their trend. The shared insight the diagram encodes: the metrics are not opinions, they are computed from the events your delivery system already produces — commit times, deploy events, incident spans.
The second diagram shows the platform engineering engine that those metrics drive investment into. A stream-aligned team enters through the developer control plane — a Backstage portal, a CLI, or a Git manifest — and invokes a golden path (create a service, get a database, ship a change). That intent flows into the integration and delivery plane (CI/CD templates, GitOps controllers, the image registry, the secrets operator), which realises it against the resource plane (Kubernetes, managed databases, queues, cloud accounts), with the security plane (policy-as-code, scanning, RBAC) enforced across every path and the observability plane wiring default dashboards and SLOs. The output is a fully scaffolded, secured, observed service the team owns — produced in minutes, not weeks. The footer insight: the platform team operates this as X-as-a-Service, so the stream-aligned team self-serves without a ticket, and the DORA metrics from the first diagram are how the platform team proves the engine is working.
Real-world scenario
Meridian Logistics runs a B2B shipping platform: about 38 engineering teams, ~140 microservices, mostly on Kubernetes across two regions, with a four-person nascent “DevOps tools” group. The CTO had just been asked by the board whether a year of “DevOps transformation” had paid off, and had no number to give. Onboarding a new service took two to three weeks; the variance between teams was enormous — one team deployed twelve times a day, another deployed once every six weeks and treated each release as a controlled detonation.
Phase 1 — measure (weeks 1–6). The tools group resisted the urge to build a platform and instead instrumented DORA. They created a deployments table and added a single record-deployment step to the shared deploy job most teams already used; for the holdout teams they backfilled from the GitHub Deployments API. They linked their incident tool (Opsgenie) to deployments by service-and-version, and computed all four metrics per team with the SQL above, rendered in Grafana. The picture was stark: organisation-wide median lead time was 9 days, deployment frequency was bimodal (a cluster of elite teams and a long tail of monthly deployers), change failure rate averaged 23%, and time to restore had a brutal p90 of 6 hours driven by poor observability on the slow-moving teams. Critically, the decomposition of lead time showed the dominant cost was not CI (median 14 minutes) but review wait (median 2.1 days) and a manual change-approval board that met twice a week (median 3 days waiting for the board). The board now had its number — and the tools group had its target.
Phase 2 — engineer the bottleneck (months 2–7). The data said the biggest lever was the change-approval board and review latency, plus the long tail of teams with bespoke, fragile pipelines. So the platform team built a golden path: a Backstage software template that scaffolded a new service with a standard pipeline, default dashboards, an SLO stub, secrets wiring and a catalog-info.yaml; a set of reusable CD templates with canary deployment and automated rollback baked in (which made change failures self-recording); and they worked with the security and risk teams to replace the change-approval board with automated policy gates in the golden-path pipeline (tests, scans, and a canary that auto-rolls-back on SLO breach were the approval). They ran the first three pilots as collaboration, then flipped to X-as-a-Service for everyone else. They explicitly kept the path optional and documented escape hatches, and tracked adoption as the platform’s headline KPI.
Phase 3 — prove it (months 8–10). Adoption hit 70% of services on the golden path within a quarter. The DORA numbers moved exactly where the data had predicted: median lead time fell from 9 days to 7 hours (eliminating the approval board and shrinking review wait via smaller PRs encouraged by the template), deployment frequency for the long-tail teams rose from monthly to several times a week, change failure rate dropped from 23% to 11% (canary + automated rollback caught bad changes before broad impact), and time to restore p90 fell from 6 hours to 22 minutes (default observability + one-click/automated rollback). New-service onboarding went from ~3 weeks to ~90 minutes. The platform team’s existence was justified not by a slide but by a before/after on four instrumented metrics. The lesson the CTO repeated: “We didn’t get faster by telling teams to go faster. We measured where the time was actually going, then built the platform that gave it back.”
The transformation as a before/after, because the deltas are the story:
| Metric | Before (org median) | After (org median) | What moved it |
|---|---|---|---|
| Lead time for changes | 9 days | 7 hours | Killed the approval board; smaller PRs via templates |
| Deployment frequency (long-tail teams) | ~monthly | several/week | Golden-path CD; one-click deploy |
| Change failure rate | 23% | 11% | Canary + automated rollback; quality gates |
| Time to restore (p90) | 6 hours | 22 minutes | Default observability; instant rollback |
| New-service onboarding | ~3 weeks | ~90 minutes | Scaffolder golden path |
| Platform adoption | 0% | 70% in a quarter | Run as a product; optional, easiest path |
Advantages and disadvantages
The DORA-plus-platform approach is powerful and has real failure modes. Weigh both honestly:
| Advantages | Disadvantages / risks |
|---|---|
| Four metrics that correlate with outcomes and resist gaming as a set | The metrics can be gamed or weaponised if used per-individual |
| Localises the bottleneck (lead-time decomposition points at the real cost) | Honest measurement needs instrumentation effort and clean event data |
| A shared definition of “fast and safe” leadership and engineers both trust | Mis-defined endpoints (ticket→merge) produce flattering, useless numbers |
| Platform makes the safe path the easy path — speed and stability rise together | A platform built before measuring pain becomes shelfware |
| Cognitive-load reduction frees stream-aligned teams to build product | A too-thick platform (golden cage) blocks advanced teams |
| Onboarding collapses from weeks to minutes; consistency by default | Run as a gatekeeper/ticket queue, the platform becomes the bottleneck |
| The platform’s value is provable with the same DORA metrics | Platform is an ongoing investment (product, on-call, roadmap) — not a one-off |
| Standards (security, observability) are baked in, not bolted on | Adoption is a product problem; mandates breed shadow platforms |
When each matters: DORA metrics matter the moment leadership needs to reason about delivery and you have more than a couple of teams; they matter most when you’re about to invest in tooling or process and need a before/after. Platform engineering matters once the cost of every team re-solving infrastructure exceeds the cost of building and running shared paths — typically past five-to-ten teams. Below that scale, a lightweight set of shared templates and good measurement may be all you need; a full IDP with a portal can be premature.
Hands-on lab
Stand up a minimal but real DORA measurement: a deployments table, a couple of recorded deploys, an incident, and queries that compute all four metrics. Free-tier-friendly — local Postgres in Docker; delete at the end. No cloud account needed.
Step 1 — Run a local Postgres.
docker run -d --name dora-lab -e POSTGRES_PASSWORD=lab -p 5432:5432 postgres:16
sleep 5   # let it come up
docker exec -i dora-lab psql -U postgres -c "SELECT 'ready';"
Expected: a row containing ready.
Step 2 — Create the schema (deployments, deployment_commits, commits, incidents).
docker exec -i dora-lab psql -U postgres <<'SQL'
CREATE TABLE deployments (
  deployment_id uuid PRIMARY KEY DEFAULT gen_random_uuid(),
  service text, team text, environment text, commit_sha text,
  version text, status text, was_rolled_back boolean DEFAULT false,
  deployed_at timestamptz);
CREATE TABLE commits (sha text PRIMARY KEY, authored_at timestamptz);
CREATE TABLE deployment_commits (deployment_id uuid, commit_sha text);
CREATE TABLE incidents (
  id serial PRIMARY KEY, service text, severity text,
  started_at timestamptz, restored_at timestamptz,
  caused_by_deployment_id uuid);
SELECT 'schema created';
SQL
Step 3 — Seed realistic events (two services, several deploys over a week, one failed deploy with an incident).
docker exec -i dora-lab psql -U postgres <<'SQL'
-- commits (authored times)
INSERT INTO commits VALUES
 ('c1', now() - interval '6 days 2 hours'),
 ('c2', now() - interval '4 days 5 hours'),
 ('c3', now() - interval '2 days 1 hour'),
 ('c4', now() - interval '1 day 3 hours'),
 ('c5', now() - interval '5 hours');
-- deployments (production, mostly succeeded; one rolled back)
WITH d AS (
 INSERT INTO deployments (service,team,environment,commit_sha,version,status,was_rolled_back,deployed_at)
 VALUES
  ('checkout-api','payments','production','c1','1.0.0','succeeded',false, now() - interval '6 days'),
  ('checkout-api','payments','production','c2','1.1.0','succeeded',false, now() - interval '4 days'),
  ('checkout-api','payments','production','c3','1.2.0','succeeded',true,  now() - interval '2 days'),
  ('checkout-api','payments','production','c4','1.2.1','succeeded',false, now() - interval '1 day'),
  ('search-api','discovery','production','c5','3.4.0','succeeded',false, now() - interval '4 hours')
 RETURNING deployment_id, commit_sha)
INSERT INTO deployment_commits SELECT deployment_id, commit_sha FROM d;
-- one incident caused by the rolled-back 1.2.0 deploy
INSERT INTO incidents (service,severity,started_at,restored_at,caused_by_deployment_id)
SELECT 'checkout-api','high', now() - interval '2 days' + interval '6 minutes',
       now() - interval '2 days' + interval '23 minutes', deployment_id
FROM deployments WHERE version='1.2.0';
SELECT 'seeded';
SQL
Step 4 — Deployment frequency (per service, last 30 days).
docker exec -i dora-lab psql -U postgres -c "
SELECT service, count(*) AS deploys,
       round(count(*)::numeric / 30, 2) AS deploys_per_day
FROM deployments
WHERE environment='production' AND status='succeeded'
  AND deployed_at >= now() - interval '30 days'
GROUP BY service ORDER BY deploys DESC;"
Expected: checkout-api with 4 deploys, search-api with 1.
Step 5 — Lead time for changes (median, per service).
docker exec -i dora-lab psql -U postgres -c "
WITH p AS (
 SELECT d.service, EXTRACT(EPOCH FROM (d.deployed_at - c.authored_at))/3600.0 AS lead_h
 FROM deployments d
 JOIN deployment_commits dc ON dc.deployment_id=d.deployment_id
 JOIN commits c ON c.sha=dc.commit_sha
 WHERE d.environment='production' AND d.status='succeeded')
SELECT service, round(percentile_cont(0.5) WITHIN GROUP (ORDER BY lead_h)::numeric,1) AS p50_lead_hours
FROM p GROUP BY service;"
Expected: small positive hour values (each deploy lagged its commit by a few hours to a day).
Step 6 — Change failure rate (per service).
docker exec -i dora-lab psql -U postgres -c "
WITH prod AS (
 SELECT * FROM deployments WHERE environment='production' AND status='succeeded'),
failed AS (
 SELECT DISTINCT p.deployment_id FROM prod p
 LEFT JOIN incidents i ON i.caused_by_deployment_id=p.deployment_id
 WHERE p.was_rolled_back OR i.id IS NOT NULL)
SELECT p.service, count(*) total,
       count(f.deployment_id) failed,
       round(100.0*count(f.deployment_id)/count(*),1) cfr_pct
FROM prod p LEFT JOIN failed f ON f.deployment_id=p.deployment_id
GROUP BY p.service ORDER BY cfr_pct DESC;"
Expected: checkout-api 4 deploys, 1 failed, 25% CFR; search-api 0% CFR.
Step 7 — Time to restore (median minutes).
docker exec -i dora-lab psql -U postgres -c "
SELECT service, count(*) incidents,
       round(percentile_cont(0.5) WITHIN GROUP (
         ORDER BY EXTRACT(EPOCH FROM (restored_at-started_at))/60.0)::numeric,1) p50_restore_min
FROM incidents WHERE restored_at IS NOT NULL
GROUP BY service;"
Expected: checkout-api, 1 incident, 17.0 minutes restore.
Validation checklist. You created the event tables, recorded real deploy/commit/incident events, and computed all four DORA metrics with the exact production queries — proving the metrics are nothing more than aggregations over events your delivery system emits. What each step demonstrated:
| Step | What you did | What it proves |
|---|---|---|
| 2–3 | Modeled deploys, commits, incidents | The four metrics need only these event sources |
| 4 | Counted prod deploys | Deployment frequency = a filtered count |
| 5 | Joined commit→deploy times | Lead time = a duration between two real events |
| 6 | Linked rollbacks/incidents to deploys | CFR = failed/total, with honest attribution |
| 7 | Spanned incident start→restore | MTTR = a percentile over incident durations |
Teardown.
docker rm -f dora-lab
Cost note. Entirely local; the only “cost” is a Docker container you removed. In production the same schema lives in a managed Postgres (a few hundred rupees a month) or your existing data warehouse.
Common mistakes & troubleshooting
The failure modes that quietly poison a DORA-plus-platform program, as a symptom→cause→confirm→fix playbook:
| # | Symptom | Root cause | Confirm | Fix |
|---|---|---|---|---|
| 1 | Lead time looks “elite” but delivery feels slow | Clock stops at merge, not prod | Check the end event in your query/tool | Re-measure to first production deploy |
| 2 | Lead time absurdly long, mostly “waiting” | Clock starts at ticket created | Inspect the start event | Start at first commit of the change |
| 3 | Deployment frequency suspiciously high | Counting CI runs / staging deploys | Filter your event source by environment |
Count only successful production deploys |
| 4 | Change failure rate near 0%, but incidents happen | “Failure” defined too narrowly or not attributed | Audit how failures are linked to deploys | Define user-impacting failure; link incidents→deploys |
| 5 | MTTR looks great, users say outages drag on | Clock starts at ticket, not impact | Compare started_at to first SLO breach |
Start MTTR at detection/impact, not ticket |
| 6 | Metrics get gamed; trust collapses | Used to rank individuals | Ask how the numbers are reported up | Scope to team/service only; never per-person |
| 7 | Platform built, nobody uses it | Built before measuring pain / user research | Check adoption %; ask teams what they needed | Build from the worst DORA metric + user research |
| 8 | Self-service is really a ticket queue | Platform run as ops/gatekeeper | Map the request→fulfil path for a new service | Provide self-service APIs/templates; product model |
| 9 | Advanced teams route around the platform | Golden cage; no escape hatches | Count services off the path and why | Make paths optional; document escape hatches |
| 10 | Golden path scaffolds outdated practice | Templates not versioned/maintained | Diff a year-old scaffold vs current best practice | Version templates; provide an update path |
| 11 | Platform team is in every team’s deploy | Dominant mode is collaboration, not XaaS | Observe how often platform is pulled in to ship | Move to X-as-a-Service; remove the dependency |
| 12 | Numbers improve but users no happier | Optimised throughput, ignored reliability | Check SLO attainment alongside the four | Add the reliability/SLO guardrail metric |
| 13 | CFR rises right after “deploy more” push | Frequency up without tests/canary | Correlate CFR trend with frequency change | Add quality gates + canary/automated rollback |
| 14 | Metrics differ wildly between two tools | Two tools, two definitions of “deploy”/“failure” | Compare each tool’s event definitions | Standardise on one event source + agreed defs |
The three that waste the most time, expanded:
1 & 2 — wrong lead-time endpoints. This is the single most common error and it always flatters or maligns you. The fix is non-negotiable: clock starts at the first commit of the change, stops at that change running in production. If a tool won’t let you set those endpoints, compute it yourself from VCS + the deployments table. Then decompose it — the aggregate is useless for action; the stage breakdown (review wait vs CI vs deploy queue) is where the lever is.
4 — change failure rate that lies. If CFR is near zero while real incidents occur, you either defined “failure” too narrowly or you’re not attributing incidents to deploys. Agree upfront, in writing, that a failure is any user-impacting degradation requiring remediation (rollback, hotfix, flag-off, incident), then link incidents to the deploy that caused them — ideally via an explicit caused_by_deployment_id set during the post-incident step, or automatically via canary rollback.
7 & 8 — the platform nobody wanted. A platform built from the team’s own ideas of “what would be cool,” before measuring where teams actually hurt, becomes shelfware; one run as an approval/ticket function becomes a bottleneck. The cure for both is the same operating-model shift: build from the measured worst metric plus real user research, and ship self-service capabilities run as a product, defaulting to X-as-a-Service.
Best practices
- Measure all four, always together; read the two pairs against each other. Never celebrate deployment frequency without change failure rate, and never celebrate a low CFR without checking it wasn’t bought by deploying rarely.
- Get the endpoints right or don’t bother. Lead time: first commit → running in prod. MTTR: impact begins → service restored. A metric with wrong endpoints is worse than no metric — it misleads with confidence.
- Derive metrics from real events, not surveys, for operational dashboards. Emit deploy/commit/incident events; compute the four as aggregations. Reserve surveys for culture benchmarking.
- Scope to team/service, never to individuals. This is the line that keeps the metrics honest. Cross it and the numbers become surveillance and die.
- Add guardrails and the reliability (5th) metric. Track defect-escape and SLO attainment so optimising one DORA metric doesn’t silently wreck another.
- Use the metric to find the bottleneck, then build the platform capability that moves it. Decompose lead time; attack the dominant stage. Don’t build a platform feature no metric asked for.
- Run the platform as a product. Product owner, roadmap from measured pain, adoption metrics, on-call, docs, feedback loop. Adoption — not uptime alone — is the headline KPI.
- Make golden paths the easiest path, not a mandate. Win by being paved and supported; provide first-class escape hatches; treat low adoption as a product problem, not a compliance one.
- Bake standards in by default. Security scanning, observability, SLO stubs and secrets wiring should come from the template, so doing the right thing requires no extra effort.
- Keep golden paths current. Version templates; provide an update path; a stale golden path strands every team that scaffolded from it.
- Default the platform’s interaction to X-as-a-Service. If product teams must collaborate with the platform team to ship, you’ve built a bottleneck. Self-service is the whole point.
- Reduce cognitive load as the north star. Every platform capability must demonstrably make a stream-aligned team’s life simpler — if it doesn’t, cut it.
Security notes
- The platform is a force multiplier for security — use it. Golden paths are the single best place to bake in secure-by-default: image scanning, dependency scanning, SBOM generation, policy-as-code gates, and secret management wired from the template. Standardising the path standardises the security posture across every team at once.
- Treat DORA event data as sensitive metadata. Deploy times, commit authors and incident records reveal your release cadence and your weak spots. Restrict access, and scrub anything that could become a target list. Never expose per-individual breakdowns.
- Secrets never live in templates or the catalog. The scaffolder wires services to the platform’s secrets store (Vault, cloud secret manager) via workload identity; it must never bake a secret into a generated repo or a
catalog-info.yaml. - Least privilege for the platform’s own automation. The scaffolder and provisioning controllers are powerful (they create repos, infra, and access). Scope their credentials tightly, use short-lived/workload identities, and audit what the platform creates.
- Policy-as-code as a guardrail, not a gate. Enforce standards (no public buckets, required labels, approved base images) with OPA/Kyverno in the golden-path pipeline so compliance is automatic and self-service — replacing slow manual approval boards (which, recall, are often the biggest lead-time cost) with fast, codified checks.
- Make the secure path the golden path. If security requires leaving the paved road, teams will route around it. The discipline: the easiest way to ship must also be the most secure way — then security scales without a gate.
- Lock down the developer portal. Backstage and IDP portals expose your entire service map, ownership, and often action triggers (scaffold, deploy). Require SSO, enforce RBAC on actions, and don’t expose it to the public internet.
Cost & sizing
What drives the cost of this program, and how to size it sanely:
- DORA measurement is cheap; the value dwarfs the cost. A deployments/incidents table in a managed Postgres or your existing warehouse, plus Grafana, is a few hundred to a couple-thousand rupees a month. The expensive mistake is not measuring and therefore investing blindly.
- Commercial DORA tools (LinearB, Sleuth, Faros, Cortex, etc.) save build effort and add insights, billed per developer/seat. Worth it when you want it now and lack the plumbing; weigh recurring per-seat cost against a one-time internal build you then own.
- The platform team is the real investment — typically 3–8 engineers run as a product team. That is a deliberate, ongoing cost, justified by the toil it removes across dozens of teams. The break-even is straightforward: if a platform team of N saves M teams each weeks of onboarding and ongoing toil, the multiplier is large past ~10 consuming teams.
- Backstage is “free” software with a real operational cost. Running and customising it is a non-trivial engineering effort (plugins, upkeep, on-call). SaaS portals (Port, Cortex) trade a subscription for far less ops — often the right call for smaller orgs.
- Right-size the platform to your scale. Below ~5–10 teams, shared templates + good measurement may beat a full IDP; a portal can be premature. Past that, the cognitive-load and consistency savings compound.
A rough sizing picture:
| Investment | What you pay for | Rough scale | What it buys |
|---|---|---|---|
| DORA measurement (self-built) | Managed DB + Grafana | ~₹500–2,000/month | An honest, automated scoreboard |
| DORA (commercial) | Per-seat SaaS | per developer/month | Fast setup + insights, no build |
| Platform team | 3–8 engineers (product team) | salaried, ongoing | Golden paths across dozens of teams |
| Backstage (self-run) | Engineering time to run/customise | ~0.5–2 FTE ongoing | A developer portal you fully control |
| SaaS IDP portal | Subscription | per-seat/tier | Portal with minimal ops |
| Observability defaults | Logs/metrics/traces ingestion | per-GB / per-host | Lower MTTR by default |
The framing for leadership: the cost is a measurement stack plus a product team; the return is a provable improvement across all four DORA metrics and weeks-to-minutes onboarding — and the same metrics are how you demonstrate the return. Don’t fund the platform without funding the measurement that proves it worked.
Interview & exam questions
1. Name the four DORA metrics and which pair each belongs to. Deployment frequency and lead time for changes are the throughput (velocity) pair; change failure rate and time to restore service are the stability pair. You read all four together — the throughput pair tells you how fast/much, the stability pair how safe/resilient — because any single one in isolation can be gamed.
2. From what events do you measure lead time for changes, and what are the two most common mistakes? From first commit of the change to that change running in production. The two classic errors: starting at “ticket created” (which measures backlog age, not delivery) and stopping at “merged to main” (which hides the merge-to-prod gap — deploy queues, approval boards, release trains). Both must sit on the delivery pipeline.
3. Why is high deployment frequency meaningless on its own? Because frequency is a proxy for batch size, but a team could deploy often and recklessly. Without checking change failure rate and time to restore, a 10×/day cadence with a 40% failure rate looks “elite” but is a fire. The metrics resist gaming only as a set.
4. How do you define a “failure” for change failure rate, and how do you attribute it? A failure is any user-impacting degradation requiring unplanned remediation — rollback, hotfix, feature-flag-off, or an incident — not a test failing in CI (that’s the system working). Attribute it by linking the incident to the deploy: best via an explicit caused_by_deployment_id or an automated canary rollback (which self-records), and least reliably via a time-window heuristic.
5. Where does the clock start for time to restore service, and why does it matter? At impact/detection — when users were first affected (often the first SLO breach), not when a ticket was created. Starting late hides detection time, your worst gap. The clock stops at restored (users served correctly again), which a rollback or failover can achieve before the root-cause resolution.
6. What is platform engineering, and how does it relate to DORA metrics? It’s building an internal product (an IDP with golden paths) that reduces developers’ cognitive load and removes shared toil, making the fast/safe path the default across many teams. DORA metrics tell you which bottleneck to attack and whether the platform worked — you build the platform capability that moves the worst metric, then prove it with the before/after.
7. What is a golden path (paved road), and what must be true for it to succeed? A well-supported, secure-by-default, self-service route for a common task (create a service, ship it, get a DB). It succeeds only if it’s genuinely the easiest option, bakes in standards by default, stays current (versioned templates), and provides escape hatches — it’s an opt-in default, never a mandate, or advanced teams route around it.
8. In Team Topologies, what are the four team types and which interaction mode should a platform team default to? Stream-aligned, platform, enabling, complicated-subsystem. A platform team should default to X-as-a-Service — stream-aligned teams self-serve without needing to collaborate. If the dominant mode is collaboration (the platform team is pulled into every release), you’ve built a bottleneck, not a platform.
9. What are Backstage’s three core features, and is Backstage “the platform”? Software Catalog (registry of services/owners), Software Templates/Scaffolder (golden-path service creation), and TechDocs (docs-as-code in the portal). Backstage is the developer control plane — the front door — not the platform itself; without golden paths behind it you have a catalog and no removed toil.
10. Why should DORA metrics never be measured per individual? Because they describe the delivery system, not a person, and using them to rank individuals causes immediate gaming (people optimise the metric, not the outcome) and erodes trust. They are valid and honest only at the team/service level over time.
11. What is the commonly cited “fifth” DORA metric, and why add guardrails? Reliability (how well the service meets its SLOs / user expectations). You add it and other guardrails (defect-escape rate, batch size) so that over-optimising one of the four — e.g. pushing deployment frequency — doesn’t silently wreck another (e.g. spike the change failure rate) or leave users no happier.
12. How does progressive delivery let you raise deployment frequency without raising risk? By decoupling deploy from release: you deploy the code to production frequently (the metric you want high) but gate the actual exposure to users behind feature flags or a canary (the risk you want controlled). You ship continuously while releasing carefully — and an automated canary rollback even self-records change failures.
These map to platform-engineer and DevOps/SRE interview tracks and to the practices behind the DORA / Accelerate body of knowledge: the four metrics and their definitions test delivery-performance measurement literacy; lead-time endpoints and decomposition test value-stream mapping; CFR definition and attribution test incident-to-deploy linking; platform engineering and golden paths test IDP design; Team Topologies and interaction modes test org design for flow; and progressive delivery with guardrails tests the decouple-deploy-from-release discipline. Engineering-leadership interviews lean on the org-design and operating-model questions (6, 8, 11); senior IC interviews lean on the measurement and attribution questions (1–5, 12).
Quick check
- A team proudly reports “lead time: 25 minutes.” What single follow-up question most likely deflates it, and what’s the correct end event?
- Deployment frequency is 12×/day and everyone’s thrilled. Which two metrics must you check before calling the team elite, and why?
- A deploy goes out, an SLO breaches six minutes later, an engineer rolls back fourteen minutes after that, and files the post-mortem two days later. What is the team’s time-to-restore for this incident, and which timestamp is the wrong one to use as the start?
- Your platform team finds itself pulled into a video call every time any product team wants to ship a new service. In Team Topologies terms, what has gone wrong and what mode should it be?
- True or false: the right fix for a rising change failure rate after a “deploy more often” initiative is to deploy less often. Explain.
Answers
- “To production, or to merge?” — a 25-minute lead time almost always stops the clock at merge to main, hiding the merge-to-prod gap (deploy queues, approval boards, release trains). The correct end event is the change running in production; re-measured, it’s usually far longer, and decomposing it reveals where the real time goes.
- Change failure rate and time to restore service — the stability pair. Twelve deploys a day with a high failure rate or slow recovery is reckless, not elite; throughput is only impressive alongside good stability. DORA’s metrics resist gaming only as a set.
- Restore time ≈ 20 minutes (impact at +6 min from deploy, restored by the rollback at +20 min). The wrong start is when the post-mortem was filed (or when a ticket was created); the clock starts at impact/detection (the SLO breach), and stops at restored (the rollback), not at root-cause resolution two days later.
- The platform’s dominant interaction mode has become Collaboration when it should be X-as-a-Service — meaning it’s a bottleneck, not a platform. The fix is self-service golden paths (template + automated pipeline) so product teams ship without talking to the platform team.
- False. Deploying less often trades one problem (instability) for another (low throughput) and treats the symptom. The real fix is to keep frequency high and add the safety the push skipped: quality gates, automated tests, and canary/blue-green with automated rollback so frequent deploys are also safe. Speed and stability rise together with the right practices.
Glossary
- DORA — DevOps Research and Assessment; the research program (behind Accelerate and the State of DevOps reports) that defined the four delivery-performance metrics.
- Deployment frequency — how often you successfully deploy code to production; a count over time; “on-demand” is the elite expression.
- Lead time for changes — duration from first commit of a change to that change running in production; the value-stream latency of your delivery pipeline.
- Change failure rate (CFR) — the percentage of production deployments that cause a user-impacting degradation requiring remediation (rollback, hotfix, flag-off, incident).
- Time to restore service (MTTR) — duration from a user-impacting failure beginning/being detected to service being restored (which a rollback/failover can achieve before root-cause resolution).
- Throughput pair — deployment frequency + lead time (velocity).
- Stability pair — change failure rate + time to restore (safety/resilience).
- Reliability (the “fifth metric”) — how well a service meets its SLOs / user expectations; a guardrail against over-optimising the four.
- Platform engineering — the discipline of building an internal product (an IDP) that reduces developer cognitive load and removes shared toil via self-service golden paths.
- Internal Developer Platform (IDP) — the productised, self-service layer (control / integration / resource / observability / security planes) through which developers consume golden paths.
- Golden path (paved road / well-lit path) — a well-supported, secure-by-default, self-service route for a common task; an opt-in default, not a mandate.
- Cognitive load — the total mental burden on a team; the thing a platform exists to reduce so stream-aligned teams can focus on product.
- Backstage — the open-source (CNCF) developer-portal framework providing a Software Catalog, Software Templates (scaffolder) and TechDocs; the developer control plane, not the whole platform.
- Software Catalog — a registry of all services/components/APIs/resources and their owners (each described by
catalog-info.yaml). - Software Template / Scaffolder — a parameterised generator that creates a new service from a golden path.
- Team Topologies — the org model defining four team types (stream-aligned, platform, enabling, complicated-subsystem) and three interaction modes (X-as-a-Service, collaboration, facilitating).
- Stream-aligned team — a team owning a slice of business value end to end; the platform’s customer.
- X-as-a-Service — the interaction mode where a capability is consumed with minimal collaboration; a platform team’s default.
- Progressive delivery — releasing changes gradually (canary, feature flags) to decouple deploy from release, enabling high deployment frequency with controlled risk.
- Quality gate — an automated pass/fail check (tests, coverage, scans, policy) in the pipeline that blocks bad changes before production, protecting change failure rate.
Next steps
You can now measure delivery with four honest numbers and build the platform that moves them. Build outward:
- Foundation: CI/CD Pipelines Explained: From Code Commit to Production — the pipeline that emits every deployment event your metrics depend on.
- Related: DevOps Observability: Logs, Metrics, Traces and SLOs — the SLOs that define “impact” and make time-to-restore objective.
- Related: Progressive Delivery and Feature Flags: Release Without Fear — decouple deploy from release so frequency rises without risk.
- Related: Deployment Strategies: Blue-Green, Canary and Rolling Updates — the canary + automated rollback that self-records change failures and slashes restore time.
- Related: GitOps with Argo CD and Flux: Deliver from Git — the reconciliation engine underneath a real Internal Developer Platform.
- Related: Infrastructure as Code: Terraform, Pulumi, CDK and Cloud-Native Options — the IaC modules a golden path provisions for self-service infrastructure.