At 03:40 your phone buzzes: checkout latency is climbing, a few customers are seeing 500s, and nobody pushed anything. On most platforms this is the start of a long night spent SSHing into VMs, grepping log files, and guessing which of forty microservices is the culprit. On Google Cloud it should be a ten-minute incident — because the metrics, logs, traces and profiles you need were already collected, correlated by project, service and revision, and waiting in one console. The difference between those two nights is not luck. It is whether you set up Cloud Monitoring and the Operations Suite (the product family Google still half-jokingly calls “Stackdriver”) before the incident, not during it.
This article is the build-it-properly guide. The Operations Suite is not one product — it is Cloud Monitoring (metrics, dashboards, uptime checks, alerting, SLOs), Cloud Logging (structured logs, queries, sinks, log-based metrics), Cloud Trace (distributed latency traces), Cloud Profiler (continuous CPU and heap profiling), and Error Reporting (aggregated exceptions). They share one telemetry pipeline, one IAM surface and one console, which is exactly why GCP observability is powerful and exactly why it can quietly cost you a fortune if you ingest everything blindly. The hard part was never collecting data — GCP collects most of it for free, automatically. The hard part is turning that firehose into a handful of dashboards you trust, alerts that fire only when a human must act, and SLOs that tell you whether you are actually meeting the promise you made to users.
By the end you will be able to wire the Ops Agent onto a VM, write a metric threshold and a burn-rate SLO alert that does not page at 3 a.m. for nothing, query metrics in both MQL and PromQL, build an uptime check with a matching alert, turn a noisy log line into a billable-event counter with a log-based metric, route logs to BigQuery with a sink, and read a trace waterfall to find the one slow dependency. Every step has real gcloud, real Terraform, and real config — and a stack of reference tables you can keep open mid-incident.
What problem this solves
Distributed systems fail in distributed ways. A single user request fans out across a load balancer, three or four Cloud Run services, a Cloud SQL primary, a Pub/Sub topic and a downstream API — and when it gets slow or errors, the failure is rarely where the symptom shows up. Without centralized observability you are reduced to the worst debugging loop there is: notice the symptom (usually because a customer told you), guess a service, SSH in, tail -f a log, guess again. Mean-time-to-resolution measured in hours, and a team that is permanently reactive.
What breaks without this setup is not the platform — it is your ability to see the platform. Three failure patterns recur. First, you learn about outages from customers, because nothing was watching the public endpoint or the error rate. Second, you cannot localize a problem, because metrics, logs and traces live in different tools (or no tool) and nothing correlates them, so a “the app is slow” report turns into a four-engineer guessing session. Third — the subtle one — you drown in your own noise: alerts fire constantly for things nobody acts on, the on-call engineer starts ignoring the pager, and the one alert that mattered gets lost in the flood. That last failure is more dangerous than having no alerts at all.
Who hits this: every team running anything non-trivial on GCP. It bites hardest on teams that “turned on logging” and got a surprise five-figure bill, teams running many services with no shared dashboard, and teams whose alerting is a pile of static thresholds (CPU > 80%) that page on transient spikes and stay silent through real user-facing outages. The fix is not “collect more” — GCP already collects plenty. The fix is to be deliberate: define what “healthy” means as an SLO, alert on the error budget burn rate, sample and exclude the logs you will never read, and correlate the three signals so any incident collapses to one place to look.
To frame the whole field before the deep dive, here is what each pillar of the Operations Suite collects, who emits it, and the first place you look when a specific kind of incident starts:
| Pillar | What it collects | How data arrives | First incident it answers |
|---|---|---|---|
| Cloud Monitoring | Time-series metrics, dashboards, uptime checks, alert policies, SLOs | Auto from GCP services; Ops Agent; custom/OTLP; Managed Prometheus | “Is anything past a threshold or burning budget?” |
| Cloud Logging | Structured/text log entries, audit logs, query, sinks, log-based metrics | Auto from GCP services; Ops Agent; client libs; gcloud logging write |
“What did the service actually say when it failed?” |
| Cloud Trace | Distributed latency spans across services | Auto on some products; OpenTelemetry/SDK instrumentation | “Which hop in this slow request is the slow one?” |
| Cloud Profiler | Continuous CPU and heap (and more) profiles | Profiler agent/library in the app | “Which function is burning the CPU?” |
| Error Reporting | Deduplicated, grouped exceptions and stack traces | Parsed automatically from logs; reporting API | “What’s the top new exception and is it spiking?” |
Learning objectives
By the end of this article you can:
- Explain how Cloud Monitoring, Logging, Trace, Profiler and Error Reporting fit into one telemetry pipeline, and what a metrics scope does across multiple projects.
- Install and configure the Ops Agent on Compute Engine to ship host metrics and application logs, and pick it over the legacy agents.
- Read the metric model — metric type, monitored resource, labels, kind and value type — and use it to write precise queries.
- Query metrics in both MQL (Monitoring Query Language) and PromQL (via Managed Service for Prometheus), and know when each wins.
- Build uptime checks (public and private), and an alerting policy with the right condition, duration, and notification channels.
- Define an SLO on a service and alert on error-budget burn rate (fast and slow windows) so you page on real degradation, not noise.
- Create log-based metrics (counter and distribution), route logs with sinks to BigQuery, Cloud Storage and Pub/Sub, and control log cost with exclusions and bucket retention.
- Design dashboards that a stranger can read during an incident, and map the whole stack to Professional Cloud Architect and Cloud DevOps Engineer exam topics.
Prerequisites & where this fits
You should be comfortable with the GCP basics: a project is the billing and IAM boundary for resources, and most observability data is scoped to a project. You should know how to run gcloud (in Cloud Shell or locally), read JSON/YAML output, and grant an IAM role. Familiarity with HTTP status codes, basic Linux process concepts, and the idea of a time-series metric (a named number sampled over time, tagged with labels) will make everything here land faster. You do not need prior Stackdriver experience.
This sits in the Observability & Operations track and is downstream of the platform fundamentals. It assumes you understand the GCP Resource Hierarchy (because metrics scopes and log sinks operate across that hierarchy) and Google Cloud IAM (because every agent, sink and alert needs the right role). It pairs naturally with whatever you are running: Cloud Run and GKE both feed this pipeline automatically, and when something is denied rather than slow, the GCP Permission-Denied decision tree is the companion playbook. The CLI muscle memory comes from the gcloud CLI Quickstart.
A quick map of which IAM role lets a person (or service account) do which observability job, so you grant least privilege and not Owner:
| Task | Predefined role | Role ID | Notes |
|---|---|---|---|
| View dashboards, metrics, alerts | Monitoring Viewer | roles/monitoring.viewer |
Read-only; good default for most engineers |
| Create alerts, dashboards, uptime checks, SLOs | Monitoring Editor | roles/monitoring.editor |
The day-to-day “I build monitoring” role |
| Manage everything in Monitoring incl. metrics scope | Monitoring Admin | roles/monitoring.admin |
Add/remove projects from a scope |
| Write custom metrics from an app/agent | Monitoring Metric Writer | roles/monitoring.metricWriter |
Grant to the VM/Cloud Run service account |
| Read logs | Logs Viewer | roles/logging.viewer |
Excludes data-access audit logs |
| Read all logs incl. private/data-access | Private Logs Viewer | roles/logging.privateLogViewer |
Sensitive; restrict tightly |
| Write log entries | Logs Writer | roles/logging.logWriter |
Grant to agents/workloads emitting logs |
| Create sinks, buckets, log-based metrics | Logging Admin | roles/logging.admin |
Configures the logging plumbing |
| Write trace spans | Cloud Trace Agent | roles/cloudtrace.agent |
Grant to the instrumented workload’s SA |
Core concepts
Six mental models make every later task obvious. Get these and the console stops feeling like a maze.
The metric, not the chart, is the unit. Cloud Monitoring stores time series: a stream of timestamped values for one metric type (e.g. compute.googleapis.com/instance/cpu/utilization) attached to one monitored resource (e.g. a specific gce_instance), further split by labels (zone, instance_id, your own labels). A chart is just a query over those time series. When you “can’t find a metric,” you are almost always missing the right resource type or a label filter — not a missing metric.
Everything has a scope, and scopes can span projects. A metrics scope (formerly “Workspace”) is the lens through which Monitoring sees metrics. A scope has a scoping project and can include other projects, so one pane of glass can watch a whole fleet. Logs, by contrast, default to per-project, but you can aggregate them upward with a sink that points at a log bucket in another project. Knowing whether you are looking at one project or many is the first question in any “why don’t I see it” moment.
GCP collects most of this for free, automatically. Google-managed services emit system metrics and logs with zero setup: Compute Engine CPU and network, Cloud Run request count and latencies, Cloud SQL connections, load-balancer 5xx rates, and so on. Cloud Trace is automatic on Cloud Run, App Engine and via the load balancer for a sample of requests. You only install an agent when you need inside-the-guest signals — process memory, disk, application log files — that the hypervisor cannot see.
Logs and metrics are two shapes of the same truth, and you can convert between them. A log-based metric turns “count of log lines matching this filter” into a time series you can chart and alert on (a counter metric), or extracts a number from each matching line into a distribution (a distribution metric). This is how you alert on something that is only ever expressed in a log message — a specific stack trace, a “payment declined” event, a slow-query warning.
Alerting has two philosophies, and the modern one is burn rate. The old way: static thresholds (error_rate > 1% for 5 minutes). It pages on transient spikes and stays silent through slow bleeds. The modern way: define an SLO (e.g. 99.9% of requests succeed over 28 days), which implies an error budget (0.1% may fail), and alert on the burn rate — how fast you are spending that budget. A fast burn over a short window pages immediately; a slow burn over a long window opens a ticket. You alert on user pain, not on a number that may not matter.
The three signals correlate by labels, so collect them with consistent labels. A metric spike, the log lines from that window, and the slow trace are all tagged with the same project_id, service/revision (Cloud Run), cluster/namespace/pod (GKE) or instance_id (GCE). Consistent resource labels are what let you jump from “latency chart is red” to “here are the exact logs and the exact slow trace” in two clicks. Inconsistent or missing labels are why some teams’ “observability” is three disconnected tools.
The vocabulary in one table
Before the deep sections, pin down every moving part. The glossary repeats these for lookup; this is the mental model side by side:
| Term | One-line definition | Where it lives | Why it matters |
|---|---|---|---|
| Metric type | The named kind of measurement | Monitoring metric descriptor | What you select to chart/alert |
| Monitored resource | The thing being measured (VM, service, bucket) | Attached to each time series | Scopes a metric to one entity |
| Label | Key/value tag on a time series | On resource or metric | Filter and group-by dimension |
| Metrics scope | The set of projects Monitoring can see | Scoping project | Multi-project single pane |
| Ops Agent | Unified telemetry agent for VMs | On the guest OS | Ships host metrics + app logs |
| Uptime check | Periodic probe of an endpoint | Monitoring, global pollers | External “is it up” signal |
| Alerting policy | Condition(s) + notification channels | Monitoring | Turns a breach into a page |
| Notification channel | Where an alert is delivered | Monitoring | Email/Slack/PagerDuty/etc. |
| SLO | Target reliability over a window | Monitoring (on a service) | Defines “good”; implies budget |
| Error budget | The allowed amount of failure | Derived from the SLO | What burn-rate alerts watch |
| Log-based metric | A metric derived from logs | Logging → Monitoring | Alert on things only in logs |
| Sink | A route exporting logs to a destination | Logging | Long-term storage / analytics |
| Log bucket | Where Logging stores entries | Logging | Retention + cost live here |
| MQL | Monitoring Query Language | Metrics Explorer / API | Powerful ratio/window queries |
| PromQL | Prometheus query language | Managed Service for Prometheus | Standard for k8s/Prometheus users |
The metric model — read it once, query forever
Every Cloud Monitoring time series is identified by three things together: a metric type, a monitored resource type, and a set of labels on each. Add two more attributes — metric kind and value type — and you can read any metric descriptor and write a correct query the first time. This is the single most useful thing to internalize, because most “I can’t find / can’t aggregate the metric” problems are a misunderstanding of one of these five fields.
| Attribute | What it answers | Example value | Why it matters |
|---|---|---|---|
| Metric type | What is being measured | run.googleapis.com/request_count |
The series name you select |
| Monitored resource type | What entity it belongs to | cloud_run_revision |
Determines which labels exist |
| Resource labels | Which specific entity | service_name, revision_name, location |
Filter/group to one thing |
| Metric labels | Sub-dimensions of the metric | response_code_class="5xx" |
Slice without separate metrics |
| Metric kind | How values accumulate | GAUGE, DELTA, CUMULATIVE |
Dictates align/rate handling |
| Value type | The data shape | INT64, DOUBLE, DISTRIBUTION |
Distributions → percentiles |
Metric kind trips people up, so be explicit:
| Metric kind | Meaning | Typical example | How you usually query it |
|---|---|---|---|
| GAUGE | A value sampled at a point in time | CPU utilization, memory used | Align with mean/max over a window |
| DELTA | Change over the sample interval | Request count per minute | Sum/rate to get per-second or totals |
| CUMULATIVE | A running total since a start point | Bytes sent (monotonic counter) | rate/align rate to get per-second |
A DISTRIBUTION value type (used by latency metrics like run.googleapis.com/request_latencies) holds a histogram per point, which is how Monitoring gives you p50/p95/p99 without you pre-aggregating. You pick the percentile at query time with an aligner, not at collection time.
List what is actually available in your project rather than guessing metric names:
# List metric descriptors for Cloud Run (filter to the service you care about)
gcloud monitoring metrics-descriptors list \
  --filter='metric.type=starts_with("run.googleapis.com/")' \
  --format='value(type)'

# Inspect one descriptor in full — kind, value type, labels
gcloud monitoring metrics-descriptors describe \
  run.googleapis.com/request_latencies \
  --format=yaml
Custom metrics and OpenTelemetry (OTLP)
When the built-in metrics don’t cover a business signal — orders per minute, queue depth, cache hit ratio — you write a custom metric under the custom.googleapis.com/ (or workload.googleapis.com/ via the Ops Agent/OTLP) namespace. You can write directly with the Monitoring API/client libraries, or — increasingly the recommended path — emit OpenTelemetry and export via OTLP to Google Cloud. The same OTLP pipeline can carry metrics, traces and logs, which is why new instrumentation should start there rather than three separate vendor SDKs.
| Way to get metrics in | Best for | Namespace | Notes |
|---|---|---|---|
| Auto (GCP services) | Anything Google-managed | *.googleapis.com/ |
Free, zero setup |
| Ops Agent | VM host + app metrics | agent.googleapis.com/, workload.googleapis.com/ |
One agent, config-driven |
| Custom metric API / client lib | Bespoke business metrics | custom.googleapis.com/ |
You manage descriptors + writes |
| OpenTelemetry → OTLP exporter | New, portable instrumentation | workload.googleapis.com/ |
One pipeline for metrics/traces/logs |
| Managed Service for Prometheus | Existing Prometheus/k8s exporters | Prometheus model | Query with PromQL; keep your exporters |
The Ops Agent — getting inside-the-guest signals
The hypervisor sees a VM’s CPU, disk and network from the outside, but it cannot see memory used by your process, disk usage inside the filesystem, or the contents of /var/log/myapp/app.log. For that you install an agent on the guest. Google now ships one agent — the Ops Agent — that collects both metrics and logs, replacing the two older “legacy Monitoring agent” and “legacy Logging agent” daemons. New deployments should use the Ops Agent; the legacy agents are deprecated.
| Capability | Ops Agent | Legacy Monitoring agent | Legacy Logging agent |
|---|---|---|---|
| Metrics | Yes | Yes | No |
| Logs | Yes | No | Yes |
| One daemon for both | Yes | No (two agents) | No (two agents) |
| Config model | Single YAML, receivers/processors/pipelines | collectd-based | fluentd-based |
| Built on | OpenTelemetry + Fluent Bit | collectd | fluentd |
| Status | Recommended | Deprecated | Deprecated |
Install it (Debian/Ubuntu/RHEL/SUSE/Windows are supported via the same script). The instance’s service account needs roles/monitoring.metricWriter and roles/logging.logWriter:
# Install the Ops Agent on a running VM (run on the instance)
curl -sSO https://dl.google.com/cloudagents/add-google-cloud-ops-agent.sh
sudo bash add-google-cloud-ops-agent.sh --also-install

# Confirm it's running
sudo systemctl status google-cloud-ops-agent"*"
Fleet-wide, install and keep agents current with the Ops Agent policy via the VM Manager (or bake it into your image). The agent’s behavior is one YAML file at /etc/google-cloud-ops-agent/config.yaml. Here is a config that tails an application log and parses it as JSON, plus enables host metrics:
# /etc/google-cloud-ops-agent/config.yaml
logging:
  receivers:
    myapp:
      type: files
      include_paths: [/var/log/myapp/app.log]
  processors:
    parse_json:
      type: parse_json          # turn JSON log lines into structured fields
  service:
    pipelines:
      myapp_pipeline:
        receivers: [myapp]
        processors: [parse_json]
metrics:
  receivers:
    hostmetrics:
      type: hostmetrics
      collection_interval: 60s
  service:
    pipelines:
      host_pipeline:
        receivers: [hostmetrics]
After editing the config, restart the agent: sudo systemctl restart google-cloud-ops-agent. The host metrics then appear under agent.googleapis.com/ (e.g. agent.googleapis.com/memory/percent_used), and your parsed log shows up in Logs Explorer with each JSON field as a queryable column.
| Common Ops Agent metric | Metric type | What it tells you |
|---|---|---|
| Memory used % | agent.googleapis.com/memory/percent_used |
Real in-guest memory pressure |
| Disk used % | agent.googleapis.com/disk/percent_used |
Filesystem fill (the thing that pages you) |
| Swap used | agent.googleapis.com/swap/percent_used |
Memory exhaustion warning sign |
| CPU load | agent.googleapis.com/cpu/load_1m |
Saturation beyond raw utilization |
| Process count | agent.googleapis.com/processes/count_by_state |
Zombie/stuck process detection |
Querying metrics: MQL vs PromQL
Cloud Monitoring speaks two query languages, and which you reach for depends on where you came from. MQL (Monitoring Query Language) is Google’s native, table-pipeline language — extremely good at ratios, joins between metrics, and time-window math. PromQL arrives via Google Cloud Managed Service for Prometheus, so if your team already writes Prometheus queries and runs exporters, you keep that muscle memory and your existing alerting rules. Both run in Metrics Explorer; both can back an alerting policy.
| Dimension | MQL | PromQL (Managed Prometheus) |
|---|---|---|
| Origin | Google-native | Prometheus ecosystem |
| Best for | Ratios, metric joins, window functions | k8s workloads, existing exporters/rules |
| Data model | GCP time series (resource + metric labels) | Prometheus samples (labels) |
| Where it runs | Metrics Explorer, alerting, API | Metrics Explorer, PromQL API, Grafana |
| Reuse existing rules | No | Yes — bring your .rules.yaml |
| Learning curve from scratch | Moderate | Moderate (familiar if you know Prom) |
A worked example: the 5xx error ratio for a Cloud Run service. In MQL you fetch the metric, split by response-code class, and divide the bad over the total:
# MQL — fraction of Cloud Run requests that are 5xx, per service, over 5m windows
fetch cloud_run_revision
| metric 'run.googleapis.com/request_count'
| filter (resource.service_name == 'checkout')
| align rate(5m)
| group_by [metric.response_code_class],
    [value_count: sum(value.request_count)]
| ratio  # 5xx slice / total — paired with a divide; commonly expressed as:
In practice the canonical MQL error-ratio pattern uses an explicit outer_join/div of the 5xx series over the all-codes series. The point for this article: MQL can compute the ratio itself, which is exactly what a good alert condition wants — alert on “fraction of requests failing,” not “absolute count of failures,” because absolute counts scale with traffic and produce false alarms.
The same intent in PromQL, against Managed Service for Prometheus, reads the way any Prometheus user expects:
# PromQL — 5xx ratio for the checkout service over 5 minutes
sum(rate(run_googleapis_com:request_count{service_name="checkout", response_code_class="5xx"}[5m]))
/
sum(rate(run_googleapis_com:request_count{service_name="checkout"}[5m]))
Rule of thumb: if your org already standardized on Prometheus and Grafana, use Managed Service for Prometheus and PromQL so you keep one language across clouds; if you are GCP-native and want the richest ratio/window math without running exporters, use MQL.
Uptime checks — the external “is it up” signal
Internal metrics tell you the service thinks it’s healthy. An uptime check tells you whether the outside world can actually reach it. Cloud Monitoring runs uptime checks from multiple global locations on an interval, asserting on status code and (optionally) response content. Pair every uptime check with an alerting policy so a failure pages you — an uptime check with no alert is a dashboard nobody watches.
| Field | Options / values | Notes |
|---|---|---|
| Target type | URL (public), GCE instance, Cloud Run, App Engine, LB, Elastic IP | Public HTTP(S) is the common case |
| Protocol | HTTP, HTTPS, TCP | TCP for non-HTTP ports |
| Check frequency | 1, 5, 10, 15 minutes | 1 min = fastest detection, more checks |
| Regions | Global, USA, Europe, Asia-Pacific, etc. | Multiple regions reduce false positives |
| Timeout | Up to 60 s | Tune to your slow-but-ok latency |
| Content matching | Contains / not-contains / regex | Catch “200 OK but wrong page” |
| Auth / headers | Basic auth, custom headers | Probe authenticated endpoints |
| SSL cert expiry | Alert N days before expiry | Catches forgotten cert renewals |
| Private checks | Via PSC / internal targets | Probe internal-only services |
Create a public uptime check and confirm it:
# Create an HTTPS uptime check that asserts the home page returns 200 and contains a marker
gcloud monitoring uptime create "checkout-home" \
  --resource-type=uptime-url \
  --resource-labels=host=shop.example.com,project_id=$PROJECT_ID \
  --path="/health" \
  --port=443 \
  --protocol=https \
  --period=1 \
  --timeout=10 \
  --matcher-content="ok" --matcher-type=contains-string

# List existing checks
gcloud monitoring uptime list-configs --format='table(displayName, httpCheck.path)'
In Terraform, the same check plus a content matcher:
resource "google_monitoring_uptime_check_config" "checkout_home" {
  display_name = "checkout-home"
  timeout      = "10s"
  period       = "60s"            # 1-minute checks

  http_check {
    path         = "/health"
    port         = 443
    use_ssl      = true
    validate_ssl = true           # also fail if the cert is invalid
  }

  monitored_resource {
    type = "uptime_url"
    labels = {
      project_id = var.project_id
      host       = "shop.example.com"
    }
  }

  content_matchers {
    content = "ok"
    matcher = "CONTAINS_STRING"
  }
}
A subtle but important point: a single global uptime check can flap if one polling region has a transient network issue. The check is reported failed only when a configured number of regions see the failure, which is why multi-region checks are far less noisy than single-region ones. Alert on the uptime check’s check_passed metric being false across regions, not on a single probe.
Alerting policies — turning a breach into a page
An alerting policy is one or more conditions plus the notification channels that get told when those conditions are met. The art is entirely in the condition: the right metric, the right comparison, and — crucially — the right duration (how long the breach must persist before it counts). A threshold with no duration pages on every one-minute spike; a threshold with a five-minute duration pages only on a sustained problem.
| Condition knob | What it controls | Typical setting | Failure mode if wrong |
|---|---|---|---|
| Metric / filter | Which time series | The specific resource + label filter | Wrong series → never fires / always fires |
| Aligner | Per-series time bucketing | rate, mean, percentile |
Counter without rate → nonsense values |
| Reducer (group-by) | Combine across series | sum/mean across instances |
Per-instance noise vs fleet view |
| Comparison | The threshold test | > 0.01 (1% errors) |
Absolute count → traffic-dependent noise |
| Duration | How long before it triggers | 5–10 minutes | 0 min → pages on every transient spike |
| Retest / auto-close | When the incident closes | Auto-close after N minutes healthy | Stuck-open incidents |
| Notification channels | Where it goes | PagerDuty for sev1, Slack for sev3 | Page fatigue or missed alerts |
| Severity / labels | Routing + docs | Severity + a runbook link | On-call wastes time without a runbook |
Set up a notification channel first (you cannot route an alert without one), then create a policy. A Slack or PagerDuty channel is usually wired in the console once; here is email via CLI and the policy from a YAML/JSON spec:
# Create an email notification channel
gcloud beta monitoring channels create \
  --display-name="oncall-email" \
  --type=email \
  --channel-labels=email_address=oncall@example.com

# Grab its ID for the policy
CHANNEL=$(gcloud beta monitoring channels list \
  --filter='displayName="oncall-email"' --format='value(name)')
A metric-threshold policy that fires when Cloud Run 5xx ratio stays above 2% for 5 minutes, defined in Terraform (the most maintainable way to manage many policies):
resource "google_monitoring_alert_policy" "run_5xx" {
  display_name = "checkout 5xx > 2% (5m)"
  combiner     = "OR"

  conditions {
    display_name = "5xx ratio high"
    condition_threshold {
      filter = <<-EOT
        resource.type = "cloud_run_revision"
        AND resource.labels.service_name = "checkout"
        AND metric.type = "run.googleapis.com/request_count"
        AND metric.labels.response_code_class = "5xx"
      EOT
      comparison      = "COMPARISON_GT"
      threshold_value = 0.02
      duration        = "300s"        # must persist 5 minutes
      aggregations {
        alignment_period   = "60s"
        per_series_aligner = "ALIGN_RATE"
      }
      trigger { count = 1 }
    }
  }

  notification_channels = [var.oncall_channel_id]
  alert_strategy {
    auto_close = "1800s"              # close 30 min after recovery
  }
  documentation {
    content   = "Checkout is returning 5xx. Runbook: https://wiki/runbooks/checkout-5xx"
    mime_type = "text/markdown"
  }
}
| Condition type | Use when | Example |
|---|---|---|
| Metric threshold | A value crosses a line for a duration | CPU > 85% for 10 min |
| Metric absence | A metric stops arriving | No heartbeat metric for 5 min → silent failure |
| Forecast (predictive) | A trend will cross a line soon | Disk will fill within 4 hours |
| Rate of change | A value moves too fast | Error rate doubled in 2 min |
| Log match (log alert) | A specific log line appears | A “FATAL” entry → page immediately |
| MQL / PromQL condition | Anything expressible as a query | A computed ratio or join |
| SLO burn rate | Error budget burning too fast | The next section — the recommended one |
SLOs and burn-rate alerting — pages that mean something
This is where good observability separates from box-checking. A static threshold answers “is this number high?” An SLO answers the question that actually matters: “are we keeping the promise we made to users?” You define a Service-Level Indicator (SLI) — a measurable proxy for happiness, like the fraction of requests that succeed under 300 ms — and an SLO target on it, like 99.9% over a rolling 28 days. The math then hands you an error budget: with a 99.9% target, 0.1% of requests are allowed to fail. Reliability is not “never fail”; it is “fail less than the budget.”
| Term | Definition | Example |
|---|---|---|
| SLI | The measured signal | % of requests with status 2xx and latency < 300 ms |
| SLO | The target for the SLI over a window | 99.9% over 28 rolling days |
| Error budget | 100% − SLO, the permitted failure | 0.1% of requests over 28 days |
| Burn rate | How fast you’re spending the budget | 1× = on pace to exactly exhaust it; 10× = 10× too fast |
| Compliance period | The window the SLO is measured over | Rolling 28 days (or calendar month) |
The reason burn-rate alerting beats thresholds: a 99.9%/28-day budget tolerates roughly 40 minutes of total downtime per 28 days. If you burn at 1×, you’ll use exactly the budget by the end of the window — fine. If you burn at 14.4×, you’ll exhaust a month’s budget in 2 hours — that is an emergency and should page now. The trick is to alert on a fast-burn (high rate over a short window → page) and a slow-burn (lower rate over a long window → ticket), so you catch both the sudden outage and the slow bleed without paging on every blip.
| Alert tier | Burn rate | Short window | Long window | Action |
|---|---|---|---|---|
| Fast burn (page) | ~14.4× | 1 hour | 5 minutes (confirmation) | Page on-call now |
| Medium burn (page) | ~6× | 6 hours | 30 minutes | Page during the day |
| Slow burn (ticket) | ~3× | 24 hours | 2 hours | File a ticket; fix this sprint |
| Slow burn (ticket) | ~1× | 3 days | 6 hours | Investigate; budget trending bad |
Create an availability SLO and a burn-rate alert with gcloud. First the SLO on a service (here a Cloud Run service registered in Monitoring):
# Create a request-based availability SLO: 99.9% good over a 28-day rolling window
gcloud monitoring slos create \
  --service=checkout \
  --slo-id=availability-999 \
  --display-name="Checkout availability 99.9%/28d" \
  --goal=0.999 \
  --rolling-period=28d \
  --request-based-good-total-ratio \
  --good-service-filter='metric.type="run.googleapis.com/request_count" metric.labels.response_code_class!="5xx"' \
  --total-service-filter='metric.type="run.googleapis.com/request_count"'
Then a fast-burn alerting policy on that SLO’s burn rate (the console’s “Create SLO alert” wizard generates exactly this — fast and slow windows wired together):
resource "google_monitoring_alert_policy" "slo_fast_burn" {
  display_name = "Checkout SLO fast burn (14.4x / 1h)"
  combiner     = "AND"   # both the long and short window must agree

  conditions {
    display_name = "1h burn > 14.4x"
    condition_threshold {
      filter          = "select_slo_burn_rate(\"${google_monitoring_slo.availability.name}\", \"3600s\")"
      comparison      = "COMPARISON_GT"
      threshold_value = 14.4
      duration        = "0s"
      aggregations { alignment_period = "300s"; per_series_aligner = "ALIGN_MEAN" }
    }
  }
  conditions {
    display_name = "5m burn > 14.4x (fast confirmation)"
    condition_threshold {
      filter          = "select_slo_burn_rate(\"${google_monitoring_slo.availability.name}\", \"300s\")"
      comparison      = "COMPARISON_GT"
      threshold_value = 14.4
      duration        = "0s"
      aggregations { alignment_period = "60s"; per_series_aligner = "ALIGN_MEAN" }
    }
  }
  notification_channels = [var.oncall_channel_id]
}
The combination — a long window to establish the trend and a short window to confirm it is still happening — is what stops a burn-rate alert from firing on a single bad minute and from staying stuck open after recovery. This is the single most valuable alerting pattern in the whole platform; if you build only one alert per service, build this.
Cloud Logging — queries, sinks, and log-based metrics
Cloud Logging ingests log entries from GCP services, the Ops Agent, and your application (via client libraries or gcloud logging write), stores them in log buckets, and lets you query them with the Logging query language. Two operational facts dominate everything you do here: logs cost money to ingest and retain, and logs can become metrics.
Querying and the log entry shape
Every entry has a resource (the monitored resource that emitted it), a severity, a timestamp, a logName, and a payload (textPayload for plain text, jsonPayload for structured). Structured JSON logs are vastly more useful — you can filter on fields. Query in Logs Explorer or via CLI:
# All ERROR+ entries from the checkout Cloud Run service in the last hour
gcloud logging read \
  'resource.type="cloud_run_revision"
   AND resource.labels.service_name="checkout"
   AND severity>=ERROR
   AND timestamp>="2026-06-23T00:00:00Z"' \
  --limit=50 --format=json

# Write a structured test log entry
gcloud logging write my-test-log \
  '{"event":"payment_declined","amount":4999,"user":"u123"}' \
  --payload-type=json --severity=WARNING
| Log type | Where it comes from | Default retention | Cost note |
|---|---|---|---|
| Platform logs | GCP services (LB, Cloud SQL, etc.) | 30 days (_Default bucket) |
Ingestion billed beyond free tier |
| User/app logs | Your code, Ops Agent | 30 days (_Default) |
The volume you most control |
| Admin Activity audit | Who changed what (always on) | 400 days (_Required) |
Free; cannot disable or shorten |
| Data Access audit | Who read/queried data | Off by default (except BigQuery) | Can be huge; enable selectively |
| System Event audit | GCP-initiated admin actions | 400 days (_Required) |
Free |
| Access Transparency | Google staff access to your data | 400 days | Available on eligible support tiers |
Sinks — routing logs to where they live longest and cheapest
A sink matches entries with a filter and routes them to a destination: another log bucket, BigQuery (for SQL analytics), Cloud Storage (cheap long-term archive), or Pub/Sub (stream to a SIEM or external system). Two built-in sinks (_Required, _Default) already exist; you add your own for analytics and retention.
| Sink destination | Best for | Query model | Cost shape |
|---|---|---|---|
| Log bucket | Searchable retention in Logging | Logging query language | Storage by volume + retention days |
| BigQuery | SQL analytics, dashboards, joins | SQL | Storage + query (bytes scanned) |
| Cloud Storage | Cheap long-term/compliance archive | None (re-ingest to query) | Cheapest per GB; object storage |
| Pub/Sub | Stream to SIEM/Splunk/3rd party | Consumer-defined | Per-message; real-time fan-out |
Create a sink that ships security-relevant logs to BigQuery for long-term analysis, then grant the sink’s writer identity permission to write to the dataset (the step people forget — the sink is created disabled-in-effect until its service account can write):
# Route all admin-activity audit logs to a BigQuery dataset
gcloud logging sinks create audit-to-bq \
  bigquery.googleapis.com/projects/$PROJECT_ID/datasets/security_logs \
  --log-filter='logName:"cloudaudit.googleapis.com%2Factivity"'

# The command prints a writerIdentity service account — grant it BigQuery write
SINK_SA=$(gcloud logging sinks describe audit-to-bq --format='value(writerIdentity)')
gcloud projects add-iam-policy-binding $PROJECT_ID \
  --member="$SINK_SA" --role="roles/bigquery.dataEditor"
resource "google_logging_project_sink" "audit_to_bq" {
  name        = "audit-to-bq"
  destination = "bigquery.googleapis.com/projects/${var.project_id}/datasets/security_logs"
  filter      = "logName:\"cloudaudit.googleapis.com%2Factivity\""
  unique_writer_identity = true
}

resource "google_project_iam_member" "sink_writer" {
  project = var.project_id
  role    = "roles/bigquery.dataEditor"
  member  = google_logging_project_sink.audit_to_bq.writer_identity
}
Controlling log cost — exclusions and retention
The fastest way to a surprise bill is ingesting verbose logs nobody reads (health-check 200s, debug chatter, load-balancer success lines). You cut cost two ways: an exclusion filter on a sink (drop matching entries before they’re stored/billed in that bucket) and shorter retention on buckets you don’t need for 30+ days. Audit _Required logs cannot be excluded or shortened — that’s the floor.
| Cost lever | What it does | Where | Caution |
|---|---|---|---|
| Exclusion filter | Stop storing matching entries | On a sink/bucket | Excluded logs are gone — don’t drop audit |
| Bucket retention | Days entries are kept | Per log bucket | Longer = more storage cost |
| Sample then exclude | Keep 1%, drop 99% of noisy success | Exclusion with sample() |
Keep enough to debug |
| Route to GCS not Logging | Archive cheaply, skip Logging storage | Sink to Cloud Storage | Not searchable without re-ingest |
| Disable Data Access logs | Avoid huge read-audit volume | Audit config | You lose “who read what” |
# Stop billing/storing load-balancer 200s in the default bucket (keep a 1% sample)
gcloud logging sinks update _Default \
  --add-exclusion=name=drop-lb-200s,filter='resource.type="http_load_balancer" AND httpRequest.status=200 AND NOT sample(insertId, 0.01)'

# Shorten a custom bucket's retention to 7 days
gcloud logging buckets update my-debug-bucket --location=global --retention-days=7
Log-based metrics — alert on what only logs know
Some signals exist only as log lines: a specific stack trace, a “circuit breaker open” message, a “payment declined” event. A log-based metric turns “count of entries matching a filter” into a chartable, alertable time series. There are two kinds: a counter (how many matching entries) and a distribution (extract a numeric field from each match into a histogram, giving you percentiles of, say, a logged latency).
| Log-based metric type | What it produces | Use for | Example filter/value |
|---|---|---|---|
| Counter | Count of matching entries over time | Rate of a specific event | jsonPayload.event="payment_declined" |
| Distribution | Histogram from an extracted number | Percentiles of a logged value | Value = jsonPayload.latency_ms |
| Boolean (via counter) | Presence/absence of a condition | “Did the FATAL line appear?” | severity=CRITICAL |
| With labels | The above, split by a field | Per-tenant/per-region counts | Label = jsonPayload.region |
# Counter: number of payment-declined events, labeled by reason
gcloud logging metrics create payment_declined \
  --description="Count of declined payments" \
  --log-filter='resource.type="cloud_run_revision" AND jsonPayload.event="payment_declined"'

# Then alert on it like any metric:
#   logging.googleapis.com/user/payment_declined  (rate > threshold)
resource "google_logging_metric" "payment_declined" {
  name   = "payment_declined"
  filter = "resource.type=\"cloud_run_revision\" AND jsonPayload.event=\"payment_declined\""
  metric_descriptor {
    metric_kind = "DELTA"
    value_type  = "INT64"
    labels { key = "reason"; value_type = "STRING" }
  }
  label_extractors = {
    "reason" = "EXTRACT(jsonPayload.reason)"
  }
}
The counter then lives at logging.googleapis.com/user/payment_declined and is alertable exactly like a platform metric — which is how you page when declines spike, even though “declined” was never a metric, only a log line.
Cloud Trace and Cloud Profiler — latency and CPU at the function level
When a request is slow, a metric tells you that it’s slow; Cloud Trace tells you where. A trace is a tree of spans, each span a timed unit of work (an HTTP handler, a DB call, an RPC to another service), tagged with the same labels as your metrics and logs. Read the waterfall and the long bar is your culprit — the slow dependency, the N+1 query, the lock contention.
| Aspect | Cloud Trace | Cloud Profiler |
|---|---|---|
| Answers | “Which hop in this request is slow?” | “Which function is burning CPU/memory?” |
| Data | Distributed spans / latency waterfalls | Statistical CPU/heap/contention profiles |
| Auto on | Cloud Run, App Engine, LB (sampled) | No — add the profiler agent/library |
| Instrumentation | OpenTelemetry / OTLP, or auto | Profiler library in the app |
| Overhead | Sampled, low | Continuous, low (statistical sampling) |
| Cost driver | Spans ingested | Effectively free for the profiling itself |
Trace is automatic for a sampled fraction of requests on Cloud Run, App Engine and through the external load balancer. For full control and for non-auto services, instrument with OpenTelemetry and export via OTLP — the same pipeline you use for metrics and logs. The service account needs roles/cloudtrace.agent.
Cloud Profiler runs a tiny statistical profiler in your application that continuously samples CPU (and heap, contention, threads depending on language) and ships profiles to the console, where a flame graph shows which functions dominate. It is low overhead by design and effectively free — there is no good reason not to run it on a production service whose CPU bill you’d like to cut. Languages supported include Go, Java, Python and Node.js.
| Signal | Tool | Typical “aha” |
|---|---|---|
| Slow endpoint, unknown cause | Trace waterfall | One downstream call is 800 ms of a 900 ms request |
| High CPU bill, unknown cause | Profiler flame graph | JSON serialization is 40% of CPU |
| Errors clustered by type | Error Reporting | One new exception after a deploy, spiking |
| Latency p99 rising over days | Monitoring + Trace | Memory leak → GC pauses, confirmed in Profiler |
Error Reporting sits on top of Logging: it parses stack traces out of your error logs automatically, deduplicates them into groups, counts occurrences, and tells you which exception is new or spiking and which release introduced it. You don’t configure much — log your errors with stack traces and Error Reporting groups them for you, with a link straight to the offending logs and (if instrumented) traces.
Architecture at a glance
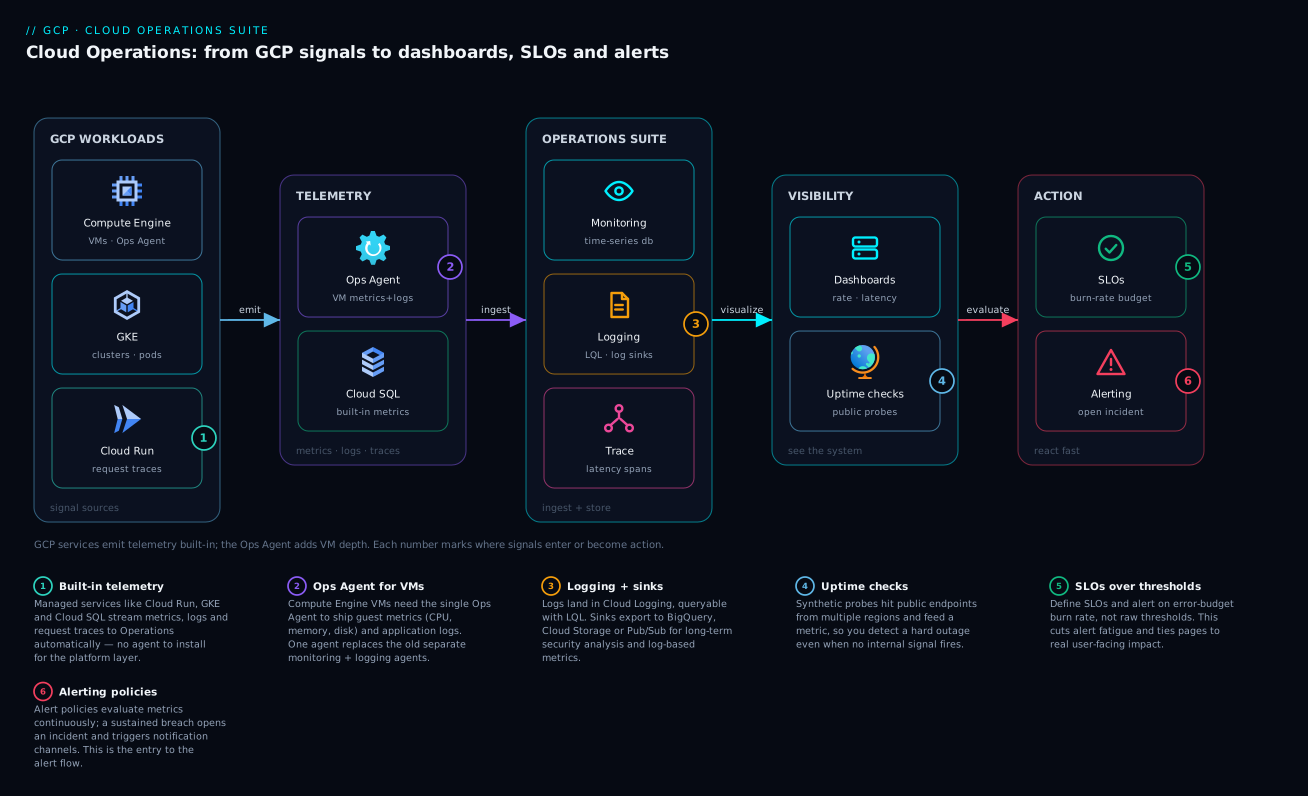
The Operations Suite is one pipeline with many sources and many readers. On the left, telemetry is produced: Google-managed services (Cloud Run, GKE, Compute Engine, Cloud SQL, load balancers) emit system metrics and logs automatically; VMs run the Ops Agent to add in-guest metrics and application log files; applications emit custom metrics, traces and structured logs via client libraries or OpenTelemetry/OTLP. All of it flows into the center: Cloud Monitoring stores time-series metrics (scoped through a metrics scope that can span projects), Cloud Logging stores log entries in log buckets, and Cloud Trace stores spans. On the right, humans and systems consume it: dashboards and Metrics Explorer (MQL/PromQL) for charts, uptime checks and alerting policies that evaluate conditions and SLO burn rate and fan out to notification channels (email, Slack, PagerDuty), log-based metrics that loop log matches back into the metrics store, and sinks that route logs onward to BigQuery, Cloud Storage and Pub/Sub. Follow any incident left-to-right: a source emits, the store correlates by shared labels, and a reader (a dashboard, an alert, a query) turns it into action.
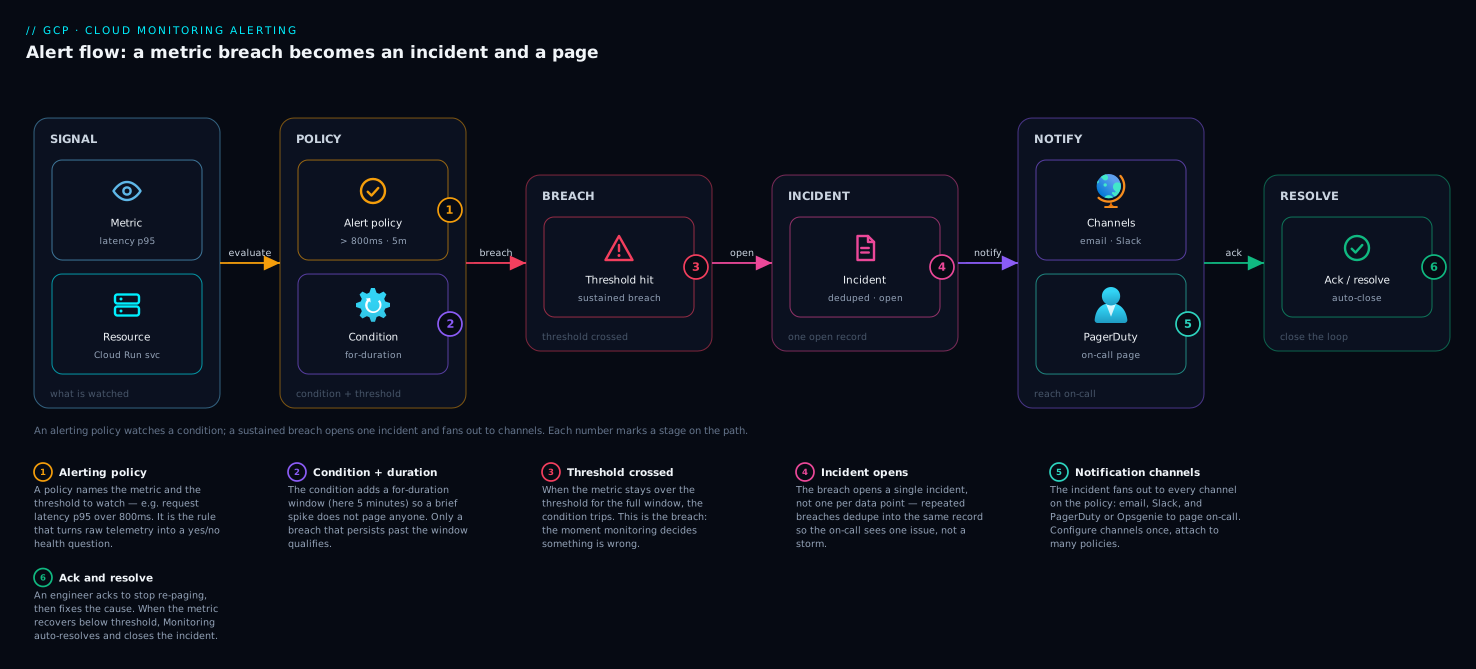
The alert path deserves its own walk-through, because it is where the value is realized. A metric (or a computed SLO burn rate, or a log-based metric) is continuously evaluated against an alerting policy’s condition. When the condition holds for its configured duration, the policy opens an incident and pushes it to every attached notification channel — the on-call engineer’s pager, a Slack channel, a ticketing webhook. The incident carries the documentation/runbook link you attached, so the responder lands with context instead of a bare “something is wrong.” When the metric recovers and stays healthy past the auto-close window, the incident closes itself. The diagram traces a metric breach from time series → condition → incident → notification → human, which is the entire reason you collected anything in the first place.
Real-world scenario
Northwind Retail ran a checkout platform on GCP: an external HTTPS load balancer in front of three Cloud Run services (web, checkout, inventory), a Cloud SQL for PostgreSQL primary, and a Pub/Sub topic feeding an order-processing worker on GKE. They had “monitoring” in the sense that the GCP console showed graphs, but no dashboards they trusted, no SLOs, and exactly one alert: CPU > 90% on the Cloud SQL instance, which had fired so often during nightly batch jobs that everyone muted it. Customers were their alerting system.
The breaking incident: a Friday-evening deploy of checkout shipped a change that created a new database connection per request instead of using the pool. At low traffic it was invisible. As evening peak built, connections to Cloud SQL climbed, the primary hit its connection limit, new requests started failing with 500s, and p99 latency on checkout went from 240 ms to 9 seconds. The first anyone heard of it was a customer tweet 35 minutes in. Two engineers spent 50 minutes guessing — was it the load balancer? Pub/Sub backlog? GKE? — before someone opened the Cloud SQL connections metric and saw the cliff.
The post-incident rebuild is the lesson. They defined an SLO for checkout: 99.9% of requests succeed (non-5xx) under 500 ms over 28 days, which gave them an error budget of roughly 40 minutes/28 days and, more importantly, a fast-burn alert (14.4× over 1 hour, confirmed at 5 minutes) wired to PagerDuty. They added an uptime check from three regions on /health of the public endpoint, alerting on multi-region failure. They added a metric-threshold alert on Cloud SQL database/postgresql/num_backends at 80% of the connection limit — the leading indicator of exactly the failure they’d just had. They built one incident dashboard for checkout: request rate, 5xx ratio, p50/p95/p99 latency (from the request_latencies distribution), Cloud SQL connections, and Pub/Sub oldest_unacked_message_age side by side. They turned on Cloud Profiler on the worker and Cloud Trace (already automatic on Cloud Run) so a slow request shows its slow span. Finally they cut the noise: an exclusion dropping load-balancer 200s (which had been a third of their log bill) while keeping a 1% sample, and a sink shipping admin-activity audit logs to BigQuery for the security team.
The next regression — a slow N+1 query introduced three weeks later — paged the on-call engineer at the 6-minute mark via the fast-burn alert, while the budget was barely touched. The dashboard showed checkout latency climbing with flat error rate, a trace showed 14 sequential identical queries in one request, and it was rolled back in 11 minutes — before a single customer noticed. Same class of bug, two incidents: one a 90-minute public outage discovered by Twitter, the other an 11-minute non-event discovered by a burn-rate alert. The platform didn’t change. The observability did.
Advantages and disadvantages
| Advantages | Disadvantages |
|---|---|
| Integrated — metrics, logs, traces, profiles in one console, correlated by shared labels | Cost can balloon on high log/trace ingest if you don’t exclude and sample |
| Most data is collected automatically and free from GCP services | Per-project default for logs means multi-project visibility needs deliberate scopes/sinks |
| SLO + burn-rate alerting is first-class — page on user pain, not noise | The metric model (kind/value-type/labels) has a learning curve; easy to mis-query at first |
| Two query languages (MQL and PromQL) — keep Prometheus skills or go GCP-native | MQL is GCP-only; portability favors PromQL/OpenTelemetry, which need more setup |
| Ops Agent unifies host metrics + app logs in one daemon and one YAML | Custom dashboards and good alerts take real design effort up front |
| Profiler is effectively free and continuously running | Some advanced trace/Prometheus features carry ingestion charges to watch |
Terraform/gcloud make all of it reproducible as code |
Audit Data Access logs can be enormous; enabling them carelessly is a bill and a privacy surface |
When does the integration matter most? On multi-service architectures where a request crosses Cloud Run, Cloud SQL and Pub/Sub — the shared-label correlation collapses a four-tool investigation into one. When does the cost risk bite hardest? On chatty services that log every request at INFO and never set an exclusion; that is the most common surprise-bill story on GCP, and it is entirely preventable.
Hands-on lab
This lab is free-tier-friendly and takes about 20 minutes. You will deploy a tiny Cloud Run service, watch its metrics and logs flow in automatically, add an uptime check, create a log-based metric and an alert, and tear it all down. Replace PROJECT_ID and region as needed.
Step 1 — Set your project and enable the APIs.
export PROJECT_ID="$(gcloud config get-value project)"
export REGION="asia-south1"   # Mumbai; pick yours
gcloud services enable run.googleapis.com monitoring.googleapis.com \
  logging.googleapis.com cloudtrace.googleapis.com
Expected: each API reports Operation finished successfully (or is already enabled).
Step 2 — Deploy a sample service that logs structured JSON. Use Google’s hello container; it emits request logs automatically.
gcloud run deploy obs-demo \
  --image=us-docker.pkg.dev/cloudrun/container/hello \
  --region=$REGION --allow-unauthenticated
Expected: a Service URL like https://obs-demo-xxxx-el.a.run.app. Save it: export URL=$(gcloud run services describe obs-demo --region=$REGION --format='value(status.url)').
Step 3 — Generate traffic and confirm metrics arrive.
for i in $(seq 1 30); do curl -s -o /dev/null "$URL"; done
# Metrics take a minute or two; then read the request count
gcloud monitoring time-series list \
  --filter='metric.type="run.googleapis.com/request_count" AND resource.labels.service_name="obs-demo"' \
  --format='value(points[0].value.int64Value)' 2>/dev/null | head
Expected: after 1–2 minutes, non-zero request counts. (Metric data is not instantaneous.)
Step 4 — Read the logs that arrived automatically.
gcloud logging read \
  'resource.type="cloud_run_revision" AND resource.labels.service_name="obs-demo"' \
  --limit=5 --format='value(timestamp, httpRequest.requestMethod, httpRequest.status)'
Expected: recent rows showing GET 200. No agent was installed — Cloud Run logs are automatic.
Step 5 — Create an uptime check on the service URL.
HOST=$(echo "$URL" | sed 's#https://##')
gcloud monitoring uptime create "obs-demo-uptime" \
  --resource-type=uptime-url \
  --resource-labels=host=$HOST,project_id=$PROJECT_ID \
  --path="/" --port=443 --protocol=https --period=1 --timeout=10
gcloud monitoring uptime list-configs --format='table(displayName)'
Expected: the check appears in the list. Within minutes it begins reporting check_passed.
Step 6 — Create a log-based metric for 4xx/5xx responses, and an email channel + alert.
# Counter of non-2xx responses
gcloud logging metrics create obs_demo_errors \
  --description="Non-2xx responses to obs-demo" \
  --log-filter='resource.type="cloud_run_revision" AND resource.labels.service_name="obs-demo" AND httpRequest.status>=400'

# Email channel
gcloud beta monitoring channels create --display-name="lab-email" \
  --type=email --channel-labels=email_address=$(gcloud config get-value account)
Expected: the metric logging.googleapis.com/user/obs_demo_errors now exists; the channel is created. Build the threshold alert on that metric in the console (Alerting → Create policy → select the user metric) or via a Terraform policy as shown earlier.
Step 7 — Validate. Hit a non-existent path a few times to generate 404s, wait ~2 minutes, and confirm the log-based metric increments:
for i in $(seq 1 10); do curl -s -o /dev/null "$URL/nope-$i"; done
gcloud logging read \
  'resource.type="cloud_run_revision" AND resource.labels.service_name="obs-demo" AND httpRequest.status=404' \
  --limit=3 --format='value(timestamp, httpRequest.status)'
Expected: 404 rows appear, and the obs_demo_errors metric (in Metrics Explorer) shows a bump.
Step 8 — Teardown. Remove everything so you incur nothing:
gcloud run services delete obs-demo --region=$REGION --quiet
gcloud logging metrics delete obs_demo_errors --quiet
# Delete the uptime check and channel by their IDs:
gcloud monitoring uptime delete \
  "$(gcloud monitoring uptime list-configs --filter='displayName=obs-demo-uptime' --format='value(name)')" --quiet
gcloud beta monitoring channels delete \
  "$(gcloud beta monitoring channels list --filter='displayName=lab-email' --format='value(name)')" --quiet
Expected: each resource confirms deletion. Cloud Run scales to zero anyway, but deleting is tidy.
Common mistakes & troubleshooting
The differentiator. Each row is a real failure mode: symptom → root cause → how to confirm → fix.
| # | Symptom | Root cause | How to confirm | Fix |
|---|---|---|---|---|
| 1 | “My VM’s memory/disk metric isn’t in Monitoring” | No agent installed; hypervisor can’t see in-guest | systemctl status google-cloud-ops-agent shows not-installed |
Install the Ops Agent; grant SA monitoring.metricWriter |
| 2 | Agent installed but no metrics/logs | Instance SA lacks metricWriter/logWriter |
Check SA roles; agent log /var/log/google-cloud-ops-agent/ shows 403 |
Grant the two writer roles to the instance SA |
| 3 | Log-based counter is always zero | Filter doesn’t match (wrong field/label) | Run the same filter in Logs Explorer — zero results | Fix the filter; structured jsonPayload.x vs textPayload |
| 4 | Alert never fires though metric is high | Counter metric without ALIGN_RATE; or wrong filter |
Preview the condition in the policy editor — flat/empty line | Use ALIGN_RATE for counters; verify the series in Metrics Explorer |
| 5 | Alert fires constantly (page fatigue) | Duration 0 / threshold on absolute count | Incidents open and close every minute | Add a 5–10 min duration; alert on a ratio, not a raw count |
| 6 | Sink created but no data in BigQuery | Sink writer SA lacks bigquery.dataEditor on the dataset |
gcloud logging sinks describe → check writerIdentity binding |
Grant the writer identity write access to the destination |
| 7 | Uptime check flaps red/green | Single region transient; timeout too low | Check shows alternating regions; latency near timeout | Use multiple regions; raise timeout; alert on multi-region fail |
| 8 | “No metrics from another project” in my dashboard | That project isn’t in the metrics scope | Monitoring → Settings → Metrics scope list | Add the project to the scoping project’s metrics scope |
| 9 | SLO shows 100% but users complain | SLI measures the wrong thing (e.g. LB 200 ≠ correct response) | Compare SLI definition to actual user journey | Redefine the SLI to a real good-request signal (status + latency) |
| 10 | Log bill spiked | Verbose success logs (health checks, LB 200s) ingested | Logging → Logs storage shows top contributors | Add an exclusion (sample 1%); route archive to GCS |
| 11 | Trace shows no spans for my service | Not auto-instrumented and no OTLP exporter | Trace list empty for the service | Add OpenTelemetry/OTLP; grant SA cloudtrace.agent |
| 12 | Alert opened but nobody was notified | Policy has no notification channel attached | Policy detail shows zero channels | Attach a channel; test it via “Send test notification” |
| 13 | Custom metric write returns 403 | SA lacks monitoring.metricWriter |
API error PERMISSION_DENIED on timeSeries.create |
Grant monitoring.metricWriter to the writer SA |
| 14 | Metric exists but percentiles look wrong | Treating a DISTRIBUTION as a GAUGE | Descriptor valueType: DISTRIBUTION |
Use a percentile aligner (e.g. ALIGN_PERCENTILE_99) |
| 15 | Two services’ metrics collide on a dashboard | Filtering on metric type but not resource labels | Series multiply unexpectedly | Add resource.labels.service_name= to the filter |
A few diagnostic shortcuts for the most common of these:
| If you see… | It’s probably… | Do this |
|---|---|---|
| A flat/empty preview in the alert editor | Wrong aligner or filter | Build the query in Metrics Explorer first, then paste |
| 403 in the agent log | Missing writer IAM role on the instance SA | Add monitoring.metricWriter + logging.logWriter |
| Sink “succeeded” but empty destination | Writer identity not granted on the destination | Bind the printed writerIdentity with the destination’s editor role |
| SLO green during a real outage | SLI proxy is too lenient | Tie the SLI to status code AND latency of the real path |
| Surprise Logging bill | Unexcluded high-volume success logs | Exclude with sample(); shorten non-critical bucket retention |
Best practices
- Define SLOs before alerts. Decide what “good” means per user-facing service, then alert on burn rate (fast + slow windows). Static thresholds are a supplement, not the foundation.
- Alert on ratios and user pain, not raw counts. “2% of requests are 5xx” is traffic-independent; “40 errors” is not and will false-alarm as you grow.
- Every alert gets a notification channel and a runbook link. An alert with no channel is invisible; an alert with no runbook wastes the responder’s first ten minutes.
- Pair every uptime check with a multi-region alert. Probe from several regions and alert only on multi-region failure to avoid flapping on one bad pop.
- Standardize structured (JSON) logging so you can filter on fields and build log-based metrics.
textPayloadis a dead end for anything you want to alert on. - Control log cost on day one. Exclude (and 1%-sample) high-volume success logs; route compliance archives to Cloud Storage; keep only audit
_Requiredlogs at long retention. - Use one metrics scope for the fleet so on-call sees every project from one pane, but keep log sinks deliberate so you don’t duplicate ingest cost.
- Prefer the Ops Agent over the legacy agents, and deploy it via image bake or VM-Manager policy so the fleet stays current.
- Instrument new code with OpenTelemetry/OTLP — one pipeline for metrics, traces and logs, and portability if you ever leave GCP.
- Build one incident dashboard per critical service — request rate, error ratio, p50/p95/p99 latency, key dependency saturation — that a stranger can read at 3 a.m.
- Run Cloud Profiler in production. It’s effectively free and continuously, and it’s the fastest path to cutting a CPU bill.
- Manage all of it as code (Terraform/
gcloud) so policies, SLOs, dashboards and sinks are reviewable and reproducible, not click-ops that drift.
Security notes
- Least privilege for agents and writers. A VM or Cloud Run service account that only emits telemetry needs exactly
roles/monitoring.metricWriter,roles/logging.logWriterand (if tracing)roles/cloudtrace.agent— neverEditor/Owner. Refer to GCP IAM and least privilege for the service-account pattern. - Audit logs are your security record. Admin Activity audit logs are always on and immutable for 400 days; Data Access logs (who read what) are off by default — enable them selectively for sensitive services, and sink them to BigQuery or a SIEM via Pub/Sub for retention and analysis.
- Logs leak secrets. Treat log content as sensitive: never log full tokens, passwords or PII; use exclusion filters and field redaction. The
roles/logging.privateLogViewerrole (which exposes data-access logs) should be granted to very few. - Protect the sink destinations. A sink writing to BigQuery or Cloud Storage uses a writer identity — bind it with the minimum role on exactly that destination, and protect the destination bucket/dataset (no public access, CMEK if required).
- Use a separate, locked-down logging/monitoring project in larger orgs (an aggregated log sink at the org/folder level) so security logs live outside the projects they audit and survive a project compromise.
- Notification channels are an exfiltration surface if misused — webhooks send incident data outward. Restrict who can create channels (
roles/monitoring.admin) and review them.
Cost & sizing
GCP observability is “free until it isn’t.” Most metrics are free (Google system metrics and a generous custom-metric allowance), uptime checks and dashboards cost nothing meaningful, and Profiler is free. The two line items that actually move the bill are log ingestion/storage and, to a lesser degree, trace/Managed-Prometheus ingestion. The discipline is to ingest deliberately.
| Cost driver | What’s free / cheap | What costs | How to control |
|---|---|---|---|
| System metrics | All Google-service metrics | — | Nothing to do |
| Custom metrics | A monthly allowance per project | Beyond the allowance, per metric-month | Don’t explode label cardinality |
| Log ingestion | A monthly free allotment per project; audit _Required free |
Per GiB beyond the free allotment | Exclude + sample noisy success logs |
| Log storage/retention | 30 days in _Default included |
Longer retention, extra buckets | Shorten retention; archive to GCS |
| Uptime checks | Generous free allowance | Very high check volume | Sensible frequency (1–5 min) |
| Trace ingestion | A monthly free span allowance | Spans beyond the allowance | Sample; don’t trace 100% of high-QPS |
| Managed Prometheus | — | Per sample ingested | Drop unused series; scrape sensibly |
| Profiler | Effectively free | — | Run it everywhere |
Rough planning numbers (always confirm against the current GCP pricing page — these move): log ingestion is billed per GiB after a free allotment per project per month, so a service logging every request at INFO can quietly push tens of GiB/month and a real bill; excluding load-balancer 200s alone often cuts a third of that. For an Indian startup running, say, a handful of Cloud Run services, a disciplined setup (system metrics free, a few custom metrics, logs sampled and excluded, audit logs to BigQuery) commonly lands the observability bill in the low thousands of rupees per month — and an undisciplined one (everything logged, nothing excluded, long retention) can be 10× that for no extra insight. The cheapest observability improvement you can make is almost always an exclusion filter, not more dashboards.
| Right-sizing move | When | Effect |
|---|---|---|
| Exclude + 1%-sample success logs | Always, day one | Biggest single log-cost cut |
| Shorten retention on debug/non-audit buckets | Logs you don’t need 30 days | Lower storage cost |
| Archive compliance logs to Cloud Storage | Long-retention, rarely queried | Cheapest per GB |
| Cap custom-metric label cardinality | Per-user/per-request labels creeping in | Avoids metric-month explosion |
| Sample traces on high-QPS services | >1000 req/s services | Keeps span ingest bounded |
| Move multi-project view to one metrics scope | Many projects | One pane, no extra ingest cost |
Interview & exam questions
-
What is the difference between Cloud Monitoring and Cloud Logging? Monitoring stores and queries time-series metrics (and runs uptime checks, alerts, SLOs); Logging stores and queries log entries and routes them via sinks. They share a console and IAM, and you can convert logs to metrics with log-based metrics. Maps to PCA and Cloud DevOps Engineer.
-
What does a metrics scope do, and why does it matter? It defines the set of projects Cloud Monitoring can see through one scoping project, enabling a single pane of glass across a multi-project fleet. Without adding a project to the scope, its metrics won’t appear in that scope’s dashboards.
-
When do you need the Ops Agent versus relying on automatic collection? GCP collects system metrics and logs from managed services automatically; you install the Ops Agent on VMs to get in-guest signals the hypervisor can’t see — process memory, filesystem usage, application log files.
-
Explain an SLO, an error budget, and burn rate. An SLO is a reliability target on an SLI over a window (e.g. 99.9%/28d). The error budget is the allowed failure (0.1%). Burn rate is how fast you’re spending that budget; you alert when a fast-burn (high rate, short window) indicates you’ll exhaust the budget quickly.
-
Why alert on a ratio rather than an absolute error count? An absolute count (e.g. “40 errors”) scales with traffic and produces false alarms as you grow or quiet false-negatives at night; a ratio (“2% of requests fail”) is traffic-independent and reflects user pain consistently.
-
What’s the difference between a counter and a distribution log-based metric? A counter counts matching log entries (rate of an event); a distribution extracts a numeric field from each match into a histogram, giving you percentiles of a logged value (e.g. p99 of a logged latency).
-
How do you export logs for long-term analysis, and what’s the gotcha? Create a sink to BigQuery/Cloud Storage/Pub/Sub; the gotcha is you must grant the sink’s writer identity permission on the destination, or the sink silently writes nothing.
-
MQL or PromQL — how do you choose? PromQL (via Managed Service for Prometheus) if your team already uses Prometheus/Grafana and exporters and wants portability; MQL if you’re GCP-native and want rich ratio/join/window math without running exporters. Both back alerts.
-
Why might an SLO read 100% while users are unhappy? The SLI measures the wrong thing — e.g. counting load-balancer 200s as “good” when the body is an error page, or ignoring latency. Fix by tying the SLI to status and latency of the real user journey.
-
How do you cut a runaway Cloud Logging bill? Add exclusion filters (drop and/or 1%-sample high-volume success logs like LB 200s), shorten retention on non-audit buckets, and archive compliance logs to Cloud Storage. Audit
_Requiredlogs are free and can’t be reduced. -
What’s the fastest way to find which function is burning CPU on a service? Run Cloud Profiler (continuous, low-overhead, effectively free) and read the flame graph; it pinpoints the dominant functions without code changes beyond adding the library.
-
A request is slow but error-free — which tool localizes the slow hop? Cloud Trace — read the span waterfall; the longest span (a slow downstream call, an N+1 query) is the culprit. Metrics tell you it’s slow; traces tell you where.
Quick check
- Your VM shows CPU in Monitoring but not memory-used-percent. What’s missing, and which two IAM roles fix the agent path?
- You want an alert that fires when 99.9%-availability is being burned 14.4× too fast over an hour — what is this alert pattern called, and why two windows?
- A log-based counter you created reads zero even though the events are happening. What are the two most likely causes?
- You created a sink to BigQuery and see no rows. What did you forget?
- Which signal — metric, log, or trace — do you reach for first when a request is slow but returns 200, and why?
Answers
- The Ops Agent isn’t installed (the hypervisor can’t see in-guest memory). The instance service account needs
roles/monitoring.metricWriterandroles/logging.logWriter. - Fast-burn SLO alerting. You use a long window (1 hour) to establish the burn trend and a short window (5 minutes) to confirm it’s still happening, so you neither fire on a single bad minute nor stay stuck open after recovery.
- The filter doesn’t match (wrong field —
jsonPayload.xvstextPayload, or a typo), or you’re charting a counter withoutALIGN_RATEso it looks flat. Test the exact filter in Logs Explorer first. - You forgot to grant the sink’s writer identity (
writerIdentity) write permission on the destination dataset (roles/bigquery.dataEditor). The sink writes nothing until then. - Cloud Trace. A 200 means no error to find in logs and the metric only says “slow”; the trace waterfall shows exactly which span (downstream call, query) consumed the time.
Glossary
- Cloud Monitoring — GCP’s metrics, dashboards, uptime checks, alerting and SLO service.
- Cloud Logging — GCP’s log ingestion, query, storage (buckets), sinks and log-based metrics service.
- Cloud Trace — Distributed tracing: latency waterfalls of spans across services.
- Cloud Profiler — Continuous, low-overhead CPU/heap profiling, shown as flame graphs.
- Error Reporting — Automatic grouping/deduplication of exceptions parsed from error logs.
- Ops Agent — The unified (metrics + logs) telemetry agent for Compute Engine VMs; replaces the legacy agents.
- Metrics scope — The set of projects a Monitoring scoping project can see; enables multi-project views.
- Monitored resource — The entity a time series belongs to (e.g.
gce_instance,cloud_run_revision). - Metric kind — How a metric’s values accumulate: GAUGE, DELTA, or CUMULATIVE.
- MQL — Monitoring Query Language; GCP-native, pipeline-style, strong at ratios and joins.
- PromQL — Prometheus Query Language, available via Managed Service for Prometheus.
- Uptime check — A periodic external probe of an endpoint from multiple global regions.
- Alerting policy — One or more conditions plus notification channels that open an incident on breach.
- Notification channel — A delivery target for alerts: email, Slack, PagerDuty, webhook, SMS, etc.
- SLI / SLO / error budget — The measured indicator, its target over a window, and the permitted failure (100% − SLO).
- Burn rate — How fast the error budget is being consumed; the basis for modern alerting.
- Log-based metric — A metric derived from log entries (counter or distribution).
- Sink — A rule routing matching logs to BigQuery, Cloud Storage, Pub/Sub, or another log bucket.
- Log bucket — The container where Logging stores entries; retention and cost live here.
- Exclusion filter — A rule that drops matching log entries before storage/billing.
Next steps
- Cloud Run Explained: Serverless Containers That Scale to Zero — the most common workload feeding this pipeline, with metrics and traces automatic.
- GKE Autopilot vs Standard: Which Mode Should You Use? — Kubernetes workloads pair Cloud Monitoring with Managed Service for Prometheus and PromQL.
- GCP ‘Permission Denied’? The IAM Troubleshooting Decision Tree — the companion playbook for when telemetry is blocked by IAM, not broken.
- GCP IAM and Service Accounts: Least Privilege — get the agent, sink and writer roles exactly right.
- BigQuery for Data Analytics — where your log sinks land for SQL-grade analysis and long-term security analytics.