Quick take: Progressive delivery shrinks blast radius by shipping in observable increments and letting production metrics decide promote-or-rollback. GitOps makes Git the single source of truth and reconciles the cluster to it continuously. The interesting engineering is where they meet: a controller that changes traffic weights in the cluster while a reconciler insists the cluster must equal Git. Get the handshake wrong and your rollback fights your reconciler; get it right and a bad release is corrected by math, in seconds, with a full audit trail in
git log.
At 19:42 on a Black-Friday eve, ShipFast pushes a new checkout service. The pull request bumps one image tag from :1.8.3 to :1.9.0; a reviewer approves; the merge lands on main. Nobody runs kubectl apply. Nobody SSHes anywhere. Argo CD notices the Git commit, syncs the change into the production cluster, and hands the new ReplicaSet to Argo Rollouts, which does not replace the old version. Instead it routes 5% of live checkout traffic to :1.9.0, waits, and asks Prometheus: what is the new version’s error rate and p95 latency, right now, on real users? The answer comes back — error rate 2.1% against a 0.3% baseline — and an AnalysisRun marks the step Failed. Rollouts shifts traffic back to :1.8.3 in under a minute, and the on-call engineer gets a Slack message naming the exact failing metric. Roughly 1 in 20 checkout sessions saw a degraded experience for ninety seconds, instead of every customer for an hour. The next morning, git revert of the offending commit makes the rollback permanent and reviewable — the cluster, Git, and the dashboard now agree.
This is the article about that handshake. Not “what is a canary” (that is Deployment Strategies: Blue-Green, Canary and Rolling Updates) and not “what is GitOps” (that is GitOps with Argo CD and Flux). This is the integration: how Argo Rollouts’ strategies (canary, blueGreen) compose with Argo CD/Flux reconciliation; how AnalysisTemplates and metric providers turn a dashboard query into an automated promote/abort gate; how traffic is actually shifted (SMI, Istio, NGINX, Gateway API, ALB, AWS App Mesh); how automated rollback interacts with selfHeal, prune, and the argo-rollouts resource-health extension so the two controllers don’t deadlock; and how all of it scales to many clusters via ApplicationSets. Every mechanism comes with real Rollout/AnalysisTemplate/Application YAML, the exact kubectl-argo-rollouts command to drive and observe it, and a table you can scan mid-incident. By the end you can design a release system where Git is the intent, the controller is the executor, metrics are the judge, and humans only show up to approve a PR or read a postmortem.
What problem this solves
Two disciplines each solve half a problem and create a new one at their seam.
Progressive delivery alone gives you canary and blue-green with metric-gated promotion — but if the desired state lives in a CI job that imperatively kubectl applys, you have no single source of truth, no audit trail of what is actually deployed, and a rollback that means “re-run the old pipeline and hope.” Drift creeps in: someone hotfixes the cluster, the next deploy clobbers it, and nobody can say what is running where.
GitOps alone gives you Git as the source of truth and continuous reconciliation — but a vanilla Deployment reconciled by Argo CD does a RollingUpdate: it replaces pods with no traffic analysis, no automated metric gate, and a rollback that is just “revert the commit and wait for a full rolling replace.” There is no 5%-then-measure; the blast radius is the whole service the moment the new pods pass their readiness probe.
The integration solves the union. Git holds the intent (image: checkout:1.9.0, strategy: canary, the analysis thresholds). Argo CD/Flux reconciles that intent into the cluster. Argo Rollouts — a drop-in replacement for Deployment — owns the rollout mechanics: it creates the canary ReplicaSet, manipulates traffic weights through a mesh or ingress, runs AnalysisRuns against your metrics, and promotes or aborts. The new seam-problem — “a traffic-shifting controller mutating the live cluster while a reconciler insists the cluster equals Git” — is exactly what this article teaches you to wire correctly.
Who hits this: any team running Kubernetes with real user traffic and SLOs that wants releases to be boring. It bites hardest when you bolt progressive delivery onto GitOps naively — the reconciler fights the rollout, selfHeal reverts a paused canary, prune deletes the analysis resources, or a git revert mid-canary leaves the controller and Git disagreeing about which version is “stable.”
Here is the whole field in one frame — the three release strategies this article integrates with GitOps, what each costs, and the one question that picks it:
| Strategy | Mechanism | Extra capacity | Rollback speed | Metric-gated? | The question it answers |
|---|---|---|---|---|---|
| Rolling update | Replace pods batch by batch | ~0 (surge only) | Slow (roll back forward) | No (native) | “Low-risk stateless change, no analysis needed?” |
| Canary | Shift a small traffic % to the new version, measure, ramp | +1 canary stack (small) | Fast (set weight 0) | Yes | “Will real users be harmed? Measure before full exposure.” |
| Blue-green | Stand up full new stack, flip 100% atomically | +100% (double) | Instant (flip back) | Yes (pre-promotion) | “Need an instant, all-or-nothing cutover with a tested green?” |
And the GitOps layer those strategies plug into:
| GitOps role | Tool(s) | What it owns | What it must NOT own |
|---|---|---|---|
| Source of truth | Git (repo + commit) | Desired image, strategy, thresholds | The live traffic weight mid-canary |
| Reconciler | Argo CD / Flux | Apply Git → cluster; detect/correct drift | The promote/abort decision |
| Rollout controller | Argo Rollouts (or Flagger) | Canary/blue-green mechanics, traffic, analysis | Long-term desired state (that’s Git) |
| Judge | Prometheus / Datadog / Job / web | Pass-or-fail on real metrics | Anything humans should approve in a PR |
Learning objectives
By the end of this article you can:
- Explain the division of responsibility between Argo CD/Flux (reconcile Git → cluster) and Argo Rollouts (own canary/blue-green mechanics, traffic, analysis) — and why blurring it causes the reconciler to fight the rollout.
- Write a real
Rolloutwith acanarystrategy (setWeight/pausesteps,trafficRouting, inline and background analysis) and ablueGreenstrategy (activeService/previewService, pre- and post-promotion analysis,autoPromotionEnabled). - Author
AnalysisTemplates against the four metric-provider classes — Prometheus, Datadog/CloudWatch/New Relic, Kubernetes Job, and web/Graphite/InfluxDB — withsuccessCondition,failureLimit,count,interval, and templated args. - Wire automated rollback: how an
AnalysisRunfailure aborts the rollout, howprogressDeadlineSecondsandabortScaleDownDelaySecondsbehave, and how to make abort permanent via agit revertwithout a controller/Git standoff. - Configure traffic management through SMI, Istio, NGINX, the Gateway API plugin, AWS ALB, and App Mesh — and pick the right one for your data plane.
- Make Argo CD and Rollouts coexist: the resource-health Lua extension,
selfHeal/prunesettings,RespectIgnoreDifferences, and theargocd.argoproj.io/compare-optionsand rollout-specific annotations that stop reconciliation from clobbering an in-flight canary. - Scale the pattern to multi-cluster with
ApplicationSetgenerators (list, cluster, Git, matrix) and progressive syncs/rollouts across waves. - Use the strategy decision matrix to choose rolling vs canary vs blue-green per workload, and read the failure-mode tables during an incident.
Prerequisites & where this fits
You should already be fluent with Kubernetes core objects (Deployment, ReplicaSet, Service, Ingress), kubectl, and Helm or Kustomize for templating manifests. You should understand GitOps as a model — pull-based reconciliation, desired state in Git — at the level of the GitOps with Argo CD and Flux article, and the three deployment strategies as concepts from Deployment Strategies: Blue-Green, Canary and Rolling Updates. You need a metrics backend (Prometheus is assumed; Datadog/CloudWatch are covered) and an SLO mindset — the DevOps Observability: Logs, Metrics, Traces and SLOs article is the upstream dependency, because a canary is only as trustworthy as the query that judges it.
This sits in the Delivery track as the capstone integration. It assumes the pipeline that builds and pushes the image and bumps the tag in Git — the CI half — from CI/CD Pipelines Explained, and it pairs with Progressive Delivery and Feature Flags (flags are the in-process complement to infra-level traffic shifting). It feeds the metrics in DORA Metrics and Platform Engineering: done right, this is how you push change-failure rate down and deployment frequency up at the same time.
A map of who owns what at the seam, so you escalate to the right person mid-incident:
| Layer | What lives here | Who usually owns it | Failure it can cause |
|---|---|---|---|
| Git repo (config) | Image tag, strategy, thresholds | App + platform | Wrong tag merged; missing analysis |
| Argo CD / Flux | Sync, drift detection, self-heal | Platform / SRE | selfHeal reverts a paused canary |
| Argo Rollouts | Canary mechanics, traffic, analysis | Platform / SRE | Stuck Paused/Degraded; bad metric query |
| Traffic plane (mesh/ingress) | Weight enforcement | Network / platform | Weights not applied → no real split |
| Metrics backend | Prometheus/Datadog data | Observability | Empty result → analysis Inconclusive |
| The service itself | The code being shipped | App / dev team | Genuine regression the canary catches |
Core concepts
Six mental models make every later mechanism obvious.
Git is the intent; the controller is the executor; metrics are the judge. In a vanilla GitOps loop the desired state in Git is the running state — reconciliation is the whole story. Progressive delivery inserts an executor between “Git changed” and “the cluster fully reflects it.” When you merge image: checkout:1.9.0, Git’s intent is “get to 1.9.0, via canary, if the metrics allow.” Argo CD makes the new ReplicaSet exist; Argo Rollouts decides how fast traffic moves there and whether it moves at all. The cluster passes through intermediate states (5%, 25%, 50%) that are not in Git and are correct to not be in Git — a crucial point that drives half the coexistence configuration later.
A Rollout is a Deployment with a strategy and an opinion about traffic. Argo Rollouts ships a CRD, Rollout, that is a near drop-in replacement for Deployment (replicas, selector, template, revisionHistoryLimit all carry over). What it adds is spec.strategy.canary or spec.strategy.blueGreen, plus the machinery to manage two ReplicaSets (stable and canary/preview) and to point Services or a traffic router at them in changing proportions. You migrate by converting a Deployment to a Rollout (or by referencing an existing Deployment via workloadRef), and pointing your CI/GitOps at the Rollout instead.
Canary is “measure on a slice”; blue-green is “tested cutover.” A canary runs the new version on a small, growing share of live traffic and uses analysis to decide each ramp. A blue-green stands up the full new stack (green) alongside the live one (blue), optionally runs pre-promotion analysis against a preview Service that real users never hit, then flips 100% atomically by re-labeling the active Service. Canary minimizes blast radius and exposes the new version to real diversity of traffic; blue-green minimizes time in a mixed state and gives an instant flip-back, at the cost of double capacity.
Analysis is the judge, and it has three timings. An AnalysisTemplate is a reusable spec of metrics (each with a provider, a query, a successCondition, and counting rules). A Rollout can run analysis inline as a canary step (gate this ramp), in the background (run continuously across the whole canary and abort the moment a metric fails), or as pre/post-promotion (blue-green: test the preview before the flip, verify after). The same template is reused with different args. A metric that breaches its failureLimit fails the AnalysisRun, which aborts the rollout.
Traffic shifting is delegated to your data plane. Argo Rollouts does not move packets; it instructs a traffic provider to weight requests. Without trafficRouting, it approximates a canary by replica count (e.g., 1 canary pod + 9 stable ≈ 10%) — coarse and tied to scaling. With trafficRouting (SMI, Istio VirtualService, NGINX canary annotations, Gateway API HTTPRoute, AWS ALB TargetGroup weights, App Mesh), it sets precise weights independent of replica counts. Your mesh/ingress choice dictates which provider you configure.
Rollback is a state transition, not a redeploy. When analysis fails (or you run kubectl argo-rollouts abort), the Rollout enters Aborted: traffic returns to the stable ReplicaSet (weight 0 to canary). This is fast because the stable ReplicaSet still exists. But an aborted Rollout’s Git still says 1.9.0 — so the durable fix is to git revert the tag bump, which both reconciles the cluster to the known-good intent and records the rollback in history. The interplay between “controller aborted” and “Git reverted” is the subtlest part of the whole integration, and gets its own section.
The vocabulary in one table
Pin every moving part before the deep sections. The glossary repeats these for lookup; here is the mental model side by side:
| Term | One-line definition | Where it lives | Why it matters here |
|---|---|---|---|
Rollout |
Deployment-like CRD with a strategy |
Argo Rollouts CRD | The object CI/GitOps targets |
| Stable ReplicaSet | The known-good version serving most/all traffic | Managed by Rollouts | Rollback target; survives an abort |
| Canary ReplicaSet | The new version under test | Managed by Rollouts | Gets the small traffic slice |
AnalysisTemplate |
Reusable metric-gate spec | CRD (namespaced) or Cluster-scoped | The reusable “judge” |
AnalysisRun |
One execution of a template | Created per analysis | The actual pass/fail verdict |
| Metric provider | Prometheus/Datadog/Job/web/… | Inside a metric | Where the judge reads numbers |
trafficRouting |
The mesh/ingress integration | strategy.canary.trafficRouting |
Precise weights vs replica-count |
setWeight / pause |
Canary steps (ramp / wait) | strategy.canary.steps |
The choreography of a canary |
activeService/previewService |
Blue-green Service handles | strategy.blueGreen |
What flips on promotion |
Application (Argo CD) |
A unit of GitOps sync | Argo CD CRD | Binds a Git path to a cluster |
ApplicationSet |
Templated Applications by generator | Argo CD CRD | Multi-cluster fan-out |
selfHeal / prune |
Auto-revert drift / delete extras | Argo CD sync policy | Can fight a rollout if misconfigured |
| Abort | Rollout state: traffic back to stable | Rollout status | The fast, non-durable rollback |
Division of responsibility: who owns what
The whole integration rests on a clean split. Argo CD/Flux reconciles declared resources from Git into the cluster and reports drift. Argo Rollouts owns the lifecycle of a versioned change — creating ReplicaSets, moving traffic, running analysis, promoting or aborting. When you blur the line, you get a controller war.
Concretely: Git declares a Rollout whose spec.template points at image: checkout:1.9.0 and whose spec.strategy describes the canary. Argo CD’s job ends at “the Rollout object in the cluster equals the one in Git.” It must not try to also own the intermediate traffic state, the current step index, or the AnalysisRun results — those are runtime status the Rollouts controller writes. The table below is the contract; memorize the right column, because every coexistence bug is something on the right leaking onto something Argo CD thinks it owns.
| Concern | Owner | Source of truth | What the other controller does |
|---|---|---|---|
| Image tag / desired version | Git → Argo CD | Git commit | Rollouts reads it as the canary target |
| Strategy & steps (canary/bg) | Git → Argo CD | Git (Rollout.spec) |
Rollouts executes them |
| Analysis thresholds | Git → Argo CD | Git (AnalysisTemplate) |
Rollouts runs them as AnalysisRuns |
| Current step / pause state | Rollouts | Rollout status |
Argo CD must ignore it |
| Live traffic weight | Rollouts | Mesh/ingress object it manages | Argo CD must ignore weight churn |
| Stable vs canary ReplicaSet | Rollouts | Created by Rollouts | Argo CD sees them as managed children |
| Promote / abort decision | Rollouts (analysis) or human | Rollout status.abort |
Argo CD reflects, never decides |
| Durable rollback (revert) | Git → Argo CD | New Git commit (git revert) |
Rollouts re-runs as a new release |
Two failure modes follow directly from this table, and they are the most common “GitOps + progressive delivery” bugs:
| Anti-pattern | What happens | Correct configuration |
|---|---|---|
Argo CD selfHeal: true treats a paused canary’s traffic split as “drift” |
It re-applies Git, resetting the mesh weights mid-canary | Let Rollouts own traffic objects; add ignoreDifferences / the resource-health extension so CD doesn’t fight runtime status |
Argo CD prune: true deletes AnalysisRun/Experiment resources Rollouts created |
Analysis history vanishes; rollout may error | Mark Rollouts-created resources as non-pruned, or scope the Application to declared resources only |
CI imperatively kubectl argo-rollouts set image and Git holds the old tag |
CD reverts the image on next sync; rollout flaps | Bump the tag in Git; never set image imperatively in a GitOps repo |
| Reconcile during a blue-green preview re-labels the active Service early | Premature flip; users hit untested green | Let Rollouts own the Service selector labels; CD ignores the selector field |
The canary Rollout: steps, weights, pauses
The canary is choreography: a sequence of setWeight (move this percent to the canary) and pause (wait — for a duration, or indefinitely for human/analysis judgment) steps, optionally interleaved with analysis steps. Here is a real, production-shaped canary that ramps 5% → 25% → 50% → 100% with pauses and an inline analysis gate:
apiVersion: argoproj.io/v1alpha1
kind: Rollout
metadata:
  name: checkout
  namespace: shop
spec:
  replicas: 10
  revisionHistoryLimit: 3
  selector:
    matchLabels: { app: checkout }
  template:
    metadata:
      labels: { app: checkout }
    spec:
      containers:
        - name: checkout
          image: registry.shipfast.io/checkout:1.9.0   # ← the only line CI/Git bumps
          ports: [{ containerPort: 8080 }]
          readinessProbe:
            httpGet: { path: /healthz, port: 8080 }
            initialDelaySeconds: 5
  strategy:
    canary:
      canaryService: checkout-canary      # Service selecting ONLY the canary RS
      stableService: checkout-stable      # Service selecting ONLY the stable RS
      trafficRouting:
        nginx:
          stableIngress: checkout         # the controller forks a -canary Ingress
      steps:
        - setWeight: 5
        - pause: { duration: 5m }         # bake at 5% for 5 minutes
        - analysis:                       # inline gate before ramping further
            templates:
              - templateName: success-rate
            args:
              - name: service-name
                value: checkout-canary.shop.svc.cluster.local
        - setWeight: 25
        - pause: { duration: 5m }
        - setWeight: 50
        - pause: {}                       # indefinite — wait for human promote OR analysis
        - setWeight: 100
The step list is the entire behavior. Note the two Services (canaryService/stableService) and the trafficRouting block — together they let the controller send a precise weight to the canary regardless of replica count. The pause: {} with no duration halts until a human runs kubectl argo-rollouts promote checkout (or until background analysis aborts). Every step type and its semantics:
| Step | Syntax | Effect | Common use |
|---|---|---|---|
setWeight |
- setWeight: 25 |
Route 25% of traffic to canary | The ramp itself |
pause (timed) |
- pause: { duration: 5m } |
Hold the current weight for a duration | Bake time to gather metrics |
pause (manual) |
- pause: {} |
Hold indefinitely until promote |
Human gate before a big jump |
analysis (inline) |
- analysis: { templates: [...] } |
Run an AnalysisRun; fail → abort |
Hard metric gate at a step |
setCanaryScale |
- setCanaryScale: { weight: 25 } |
Decouple canary replica count from weight | Save cost when traffic ≪ replicas |
experiment |
- experiment: { ... } |
Spin ephemeral RS(s) for A/B baseline | Compare canary vs baseline directly |
plugin |
- plugin: { name: ... } |
Call a step plugin (e.g., notifications, custom) | Extension hooks |
Two parameters at the canary level govern safety beyond the steps:
| Field | What it controls | Default | When to set it |
|---|---|---|---|
maxSurge / maxUnavailable |
Pod churn during ramps (like RollingUpdate) | 25% / 0 |
Tighten for capacity-sensitive services |
analysis.startingStep |
Which step background analysis begins at | step 0 | Start background analysis after warm-up |
abortScaleDownDelaySeconds |
How long the canary RS lingers after abort | 30s | Raise to inspect a failed canary before it scales down |
dynamicStableScale |
Scale stable down as canary scales up | false | Save capacity on long canaries (needs traffic routing) |
minPodsPerReplicaSet |
Floor on pods per RS during low weights | 1 | Avoid 0-pod canaries at tiny weights |
Drive and observe it with the plugin (kubectl argo-rollouts), which is the operational front door:
# Watch the rollout choreography live (weights, steps, analysis, RS health)
kubectl argo-rollouts get rollout checkout -n shop --watch

# Promote past an indefinite pause (the human gate)
kubectl argo-rollouts promote checkout -n shop

# Promote skipping ALL remaining steps (jump straight to 100% — use sparingly)
kubectl argo-rollouts promote checkout -n shop --full

# Abort: traffic back to stable immediately (the fast rollback)
kubectl argo-rollouts abort checkout -n shop

# Retry an aborted rollout (start the canary over from the same image)
kubectl argo-rollouts retry rollout checkout -n shop
The rollout’s phase is the single most important status to read mid-deploy. Each phase, what it means, and your move:
| Phase | Meaning | Healthy? | Your action |
|---|---|---|---|
Progressing |
Ramping / analysis in flight | Yes | Watch; let it cook |
Paused |
At a pause step (manual or duration) |
Yes | promote when ready (manual pause) |
Healthy |
Fully promoted, 100% on new version | Yes | Done |
Degraded |
Failed: analysis aborted or progress deadline hit | No | Investigate; usually git revert |
Aborted |
Traffic returned to stable after abort | Recovering | Decide: retry (fixed?) or revert |
The blue-green Rollout: active, preview, and the flip
Blue-green keeps two full stacks and flips between them atomically by re-labeling the active Service. Argo Rollouts models this with an activeService (what users hit) and an optional previewService (what you and your pre-promotion analysis hit). A real blue-green with pre- and post-promotion gates:
apiVersion: argoproj.io/v1alpha1
kind: Rollout
metadata:
  name: payments
  namespace: shop
spec:
  replicas: 8
  selector:
    matchLabels: { app: payments }
  template:
    metadata:
      labels: { app: payments }
    spec:
      containers:
        - name: payments
          image: registry.shipfast.io/payments:3.4.0
          ports: [{ containerPort: 8080 }]
  strategy:
    blueGreen:
      activeService: payments-active       # production traffic
      previewService: payments-preview     # green, pre-flip — real users never hit it
      autoPromotionEnabled: false          # require an explicit promote (or analysis pass)
      scaleDownDelaySeconds: 300           # keep old (blue) up 5m after flip for instant rollback
      prePromotionAnalysis:                # run BEFORE the flip, against previewService
        templates: [{ templateName: smoke-and-slo }]
        args:
          - { name: service-name, value: payments-preview.shop.svc.cluster.local }
      postPromotionAnalysis:               # run AFTER the flip, against the now-active green
        templates: [{ templateName: success-rate }]
        args:
          - { name: service-name, value: payments-active.shop.svc.cluster.local }
The lifecycle: a new image creates the green ReplicaSet; previewService points at green; pre-promotion analysis runs against the preview (smoke tests, an SLO check on synthetic traffic). If it passes and you promote (or autoPromotionEnabled: true), the controller re-labels activeService to green — an instant 100% cutover. scaleDownDelaySeconds keeps blue alive for a window so a flip-back is instant; post-promotion analysis verifies real traffic on green and can auto-abort (flip back) if it fails. The knobs:
| Field | What it does | Default | Trade-off |
|---|---|---|---|
activeService |
Service selecting the live version | required | The thing that “flips” |
previewService |
Service selecting the new version pre-flip | optional | Lets you test green safely |
autoPromotionEnabled |
Flip automatically once green is ready/analysis passes | true |
false = human gate before cutover |
autoPromotionSeconds |
Auto-flip after N seconds in preview | unset | Time-boxed soak before flip |
prePromotionAnalysis |
Gate the flip on metrics/smoke | none | Catch bad green before users |
postPromotionAnalysis |
Verify after the flip; abort → flip back | none | Safety net on real traffic |
scaleDownDelaySeconds |
Keep blue alive after flip | 30s | Higher = faster rollback, more cost |
previewReplicaCount |
Run green at reduced scale pre-flip | full | Save cost during soak |
Canary vs blue-green, decided on the axes that actually matter in production:
| Axis | Canary | Blue-green |
|---|---|---|
| Extra capacity | Small (+canary slice) | Full double (blue + green) |
| Blast radius during release | Bounded to the weight (5%→…) | Zero until flip, then 100% |
| Time in a mixed-version state | Long (minutes of ramp) | ~Zero (atomic flip) |
| Rollback speed | Fast (weight → 0) | Instant (flip the label back) |
| Real-traffic validation pre-full | Yes, continuously | Only via preview/synthetic pre-flip |
| Best for | Stateless services with good metrics | Cutovers needing all-or-nothing, fast flip |
| Database-coupled changes | Risky (two versions live at once) | Risky (still two schemas briefly) |
| Cost profile | Cheap | Expensive (double during release) |
AnalysisTemplates and metric providers: the judge
An AnalysisTemplate is where a dashboard query becomes an automated gate. It declares one or more metrics, each with a provider, a query, a successCondition (a boolean over the result), and counting rules (interval, count, failureLimit, inconclusiveLimit). The canonical Prometheus success-rate template, parameterized by service name:
apiVersion: argoproj.io/v1alpha1
kind: AnalysisTemplate
metadata:
  name: success-rate
  namespace: shop
spec:
  args:
    - name: service-name          # passed in from the Rollout's analysis step
  metrics:
    - name: success-rate
      interval: 1m                # sample every minute
      count: 5                    # take 5 measurements (≈5m of evidence)
      successCondition: result[0] >= 0.95    # ≥95% success required
      failureLimit: 2             # 2 failing measurements → fail the run → abort
      provider:
        prometheus:
          address: http://prometheus.monitoring.svc.cluster.local:9090
          query: |
            sum(rate(http_requests_total{
              service="{{args.service-name}}", code!~"5.."}[2m]))
            /
            sum(rate(http_requests_total{
              service="{{args.service-name}}"}[2m]))
The counting semantics are the part people get wrong. count is how many measurements to take; interval is the gap between them; failureLimit is how many may fail before the whole run fails; inconclusiveLimit how many may be inconclusive. A measurement is Failed if successCondition is false, Inconclusive if a failureCondition (if set) is true but success isn’t, or if the query returns nothing. The fields that govern verdict and duration:
| Field | Meaning | Default | Gotcha |
|---|---|---|---|
successCondition |
Expr that must be true to pass a measurement | — | Use result[0] for single-series queries |
failureCondition |
Expr that, if true, fails immediately | — | Set for hard ceilings (e.g., error rate > 5%) |
failureLimit |
Failing measurements tolerated before run fails | 0 | 0 means one failure aborts |
inconclusiveLimit |
Inconclusive measurements tolerated | 0 | Empty Prometheus result = inconclusive |
count |
Number of measurements | 1 (or until rollout ends for background) | Omit in background analysis to run continuously |
interval |
Time between measurements | required if count > 1 |
Total time ≈ count × interval |
consecutiveErrorLimit |
Provider errors (not metric failures) tolerated | 4 | Distinguishes “query broke” from “metric bad” |
A subtle but critical distinction — failed metric vs errored provider vs inconclusive — because they lead to different rollout outcomes:
| Outcome | Cause | Effect on AnalysisRun |
Effect on rollout |
|---|---|---|---|
| Successful | successCondition true ≥ required |
Successful |
Promote continues |
| Failed | Failing measurements exceed failureLimit |
Failed |
Abort (rollback) |
| Inconclusive | Inconclusive measurements exceed limit, or empty results | Inconclusive |
Pause (needs human; does not promote) |
| Error | Provider unreachable beyond consecutiveErrorLimit |
Error |
Abort (treated as failure) |
The metric-provider classes
Argo Rollouts ships many providers; they fall into four practical classes. Pick by where your SLO data lives.
| Provider | Class | What it queries | When to use |
|---|---|---|---|
prometheus |
Time-series | PromQL against Prometheus/Thanos/Mimir | The default for Kubernetes-native metrics |
datadog |
SaaS metrics | Datadog metric query (v1/v2 API) | Datadog shops; APM-driven SLOs |
cloudWatch |
SaaS metrics | CloudWatch metric math | AWS-native services (ALB, Lambda) |
newRelic |
SaaS metrics | NRQL | New Relic shops |
wavefront |
SaaS metrics | Wavefront query | Wavefront/Operations for Apps shops |
job |
Kubernetes Job | Exit code of a Pod (0 = pass) | Smoke/integration tests, custom logic |
web |
HTTP | JSON from any HTTP endpoint + JSONPath | Custom score services, third-party SLO APIs |
graphite / influxdb |
Time-series | Graphite/Flux queries | Legacy metric stacks |
kayenta |
Automated canary analysis | Spinnaker Kayenta (Mann-Whitney) | Sophisticated statistical canary scoring |
skywalking |
APM | SkyWalking query | SkyWalking observability |
A Datadog template (note the API/app-key Secret reference and the v2 formula):
apiVersion: argoproj.io/v1alpha1
kind: AnalysisTemplate
metadata: { name: datadog-error-rate, namespace: shop }
spec:
  args: [{ name: service-name }]
  metrics:
    - name: error-rate
      interval: 1m
      count: 5
      successCondition: result < 0.05            # <5% errors
      failureLimit: 1
      provider:
        datadog:
          apiVersion: v2
          interval: 5m
          query: |
            sum:trace.http.request.errors{service:{{args.service-name}}}.as_count()
            /
            sum:trace.http.request.hits{service:{{args.service-name}}}.as_count()
A Kubernetes Job template runs an arbitrary smoke/integration suite; the Pod’s exit code is the verdict (0 = pass):
apiVersion: argoproj.io/v1alpha1
kind: AnalysisTemplate
metadata: { name: smoke-and-slo, namespace: shop }
spec:
  args: [{ name: service-name }]
  metrics:
    - name: smoke
      provider:
        job:
          spec:
            backoffLimit: 0
            template:
              spec:
                restartPolicy: Never
                containers:
                  - name: smoke
                    image: registry.shipfast.io/smoke-runner:2.1
                    command: ["/run", "--target", "{{args.service-name}}"]
A web provider scores against any HTTP+JSON endpoint via JSONPath — useful for a bespoke “deployment score” service:
    - name: score
      successCondition: "result >= 90"
      provider:
        web:
          url: https://score.shipfast.io/api/v1/canary/{{args.service-name}}
          timeoutSeconds: 20
          jsonPath: "{$.score}"
          headers:
            - { key: Authorization, value: "Bearer {{args.token}}" }
How the three analysis timings wire into a Rollout — the same templates, three placements:
| Timing | Where declared | Runs when | Failure effect | Typical metric |
|---|---|---|---|---|
| Inline (canary step) | steps[].analysis |
At that step, blocks ramp | Abort | Success rate gate before 25% |
| Background (canary) | strategy.canary.analysis |
Continuously across the canary | Abort the instant it fails | p95 latency, error rate (no count) |
| Pre-promotion (bg) | blueGreen.prePromotionAnalysis |
Before the flip | Block the flip | Smoke suite on preview |
| Post-promotion (bg) | blueGreen.postPromotionAnalysis |
After the flip | Flip back | SLO on live green |
Background analysis is the safety net you should almost always add to a canary — it watches the whole ramp, not just the moment of a step:
  strategy:
    canary:
      analysis:                      # background: runs the entire canary
        templates: [{ templateName: success-rate }]
        startingStep: 2              # begin after the 5% warm-up steps
        args:
          - { name: service-name, value: checkout-canary.shop.svc.cluster.local }
      steps:
        - setWeight: 5
        - pause: { duration: 2m }
        - setWeight: 25
        # ... background analysis can abort at ANY point past startingStep
Automated rollback and the Git interplay
This is the heart of the integration and the part most teams wire incorrectly. There are two different rollbacks, and they must be sequenced.
Rollback #1 — the controller abort (fast, runtime). When an AnalysisRun fails, or you run kubectl argo-rollouts abort, the Rollout sets status.abort: true, moves to Aborted, and the traffic router sends 100% back to the stable ReplicaSet (canary weight → 0). This is seconds, because the stable ReplicaSet is still running. The canary ReplicaSet lingers for abortScaleDownDelaySeconds (default 30s) so you can inspect it, then scales down. Crucially, Git still says 1.9.0 — the Rollout’s spec.template (which Argo CD reconciles from Git) is unchanged. The abort is a status, not a spec change.
Rollback #2 — the Git revert (durable, declarative). To make the rollback permanent and to restore Git-as-source-of-truth agreement, you git revert (or otherwise change Git back to 1.8.3). Argo CD reconciles the reverted Rollout, the controller sees a “new” desired version equal to the old stable, and it converges — usually instantly, since stable is already serving. Now Git, cluster, and dashboards agree.
The danger is the gap between #1 and #2. While the Rollout is Aborted but Git still says 1.9.0, two things can go wrong:
| Hazard in the abort→revert gap | Why it happens | Mitigation |
|---|---|---|
Argo CD selfHeal “fixes” the abort |
CD sees runtime status differ from Git and re-syncs | Don’t have CD reconcile status; abort is status, not spec — ensure ignoreDifferences covers Rollout status, which CD ignores by default |
A retry re-runs the same bad image |
kubectl argo-rollouts retry restarts the canary at the Git tag (still 1.9.0) |
Only retry after a fix; otherwise git revert first |
| Next unrelated sync re-progresses the rollout | Any change to the Rollout spec resets abort | Revert promptly; treat Aborted as “needs a Git decision now” |
undoRollout diverges from Git |
kubectl argo-rollouts undo rolls the cluster back, but Git still says new |
Prefer git revert; use undo only as a break-glass, then reconcile Git |
The correct operational sequence, as a runbook table:
| Step | Command / action | Result | GitOps state |
|---|---|---|---|
| 1. Analysis fails (or manual) | (automatic) or kubectl argo-rollouts abort checkout -n shop |
Traffic → stable in seconds; phase Aborted |
Git still = new tag |
| 2. Confirm stable is serving | kubectl argo-rollouts get rollout checkout -n shop |
Stable RS 100%, canary scaling down | — |
| 3. Decide: fix-forward or revert | Read the failing metric / logs | Diagnosis | — |
| 4a. Revert (most cases) | git revert <bad-commit> → merge |
CD syncs old tag; Rollout converges to stable | Git = cluster (agree) |
| 4b. Fix-forward (if quick) | New commit with :1.9.1 |
CD syncs; new canary starts | Git = new fixed tag |
| 5. Verify | Dashboards + git log |
Postmortem-ready audit trail | Consistent |
Two more controls shape automated rollback. progressDeadlineSeconds makes the Rollout go Degraded if it hasn’t progressed in that window — a backstop against a canary that hangs (e.g., a pause that never gets promoted, or pods that never become ready). And progressDeadlineAbort (when set) auto-aborts on that deadline. The progress/abort controls:
| Field | What it does | Default | Recommendation |
|---|---|---|---|
progressDeadlineSeconds |
Mark Degraded if no progress in N seconds |
600 | Raise for long, deliberate canaries; lower for fast services |
progressDeadlineAbort |
Auto-abort (not just degrade) on deadline | false | true if you want hands-off rollback on stalls |
abortScaleDownDelaySeconds |
Keep canary RS after abort for inspection | 30 | Raise (e.g., 600) to debug a failed canary |
restartAt |
Force a restart of all pods (drain bad state) | unset | Break-glass for stuck pods |
Notifications close the loop so the abort reaches a human. Argo Rollouts integrates with the notifications engine (the same one Argo CD uses) on triggers like on-rollout-aborted, on-analysis-run-failed, on-rollout-completed:
# A NotificationTemplate + subscription so an abort pings Slack with the failing metric
apiVersion: v1
kind: ConfigMap
metadata: { name: argo-rollouts-notification-configmap, namespace: argo-rollouts }
data:
  trigger.on-rollout-aborted: |
    - send: [rollout-aborted]
      when: rollout.status.abort == true
  template.rollout-aborted: |
    message: |
      🚨 Rollout {{.rollout.metadata.name}} ABORTED in {{.rollout.metadata.namespace}}.
      Reverted to stable. Check the failing AnalysisRun.
Traffic management: how the split is actually enforced
Argo Rollouts moves weights, not packets — it tells your data plane to send N% to the canary Service. The mechanism differs per provider, and the precision of your canary depends entirely on this choice. Without trafficRouting, the controller falls back to replica-count weighting: a 10% canary means roughly 1 canary pod for every 9 stable, which couples weight to scale and can’t do 5% on a 4-replica service. With trafficRouting, weights are exact and independent of pod counts.
The providers and what each requires:
| Provider | How it shifts traffic | Granularity | Prereq | Best for |
|---|---|---|---|---|
| None (replica) | Ratio of canary:stable pods | Coarse (≈ pod ratio) | Two Services | Quick start; no mesh |
| SMI | TrafficSplit CRD (Linkerd/others) |
Precise % | SMI-capable mesh | Mesh-agnostic via SMI |
| Istio | VirtualService (+ optional DestinationRule) weights |
Precise %; header/mirror routing | Istio | Rich routing, mirroring, header canaries |
| NGINX Ingress | Generates a -canary Ingress with canary-weight annotation |
Precise % | NGINX ingress controller | Ingress-only, no mesh |
| Gateway API | HTTPRoute backend weights (via plugin) |
Precise % | Gateway API + plugin | The vendor-neutral future |
| AWS ALB | ALB TargetGroup weights (Ingress) |
Precise % | AWS Load Balancer Controller | EKS with ALB |
| AWS App Mesh | App Mesh VirtualRouter routes |
Precise % | App Mesh | EKS with App Mesh |
| Apache APISIX / Kong / Traefik (plugins) | Route weights via plugin | Precise % | The respective controller + plugin | Those ingress stacks |
An Istio trafficRouting block (the controller writes weights into your VirtualService):
  strategy:
    canary:
      canaryService: checkout-canary
      stableService: checkout-stable
      trafficRouting:
        istio:
          virtualService:
            name: checkout-vsvc            # you provide it; Rollouts manages the weights
            routes: [primary]
          destinationRule:                 # optional: subset-based routing
            name: checkout-destrule
            canarySubsetName: canary
            stableSubsetName: stable
      steps:
        - setWeight: 5
        - pause: { duration: 5m }
The same shape for NGINX (the controller forks a <ingress>-canary Ingress and sets nginx.ingress.kubernetes.io/canary-weight):
      trafficRouting:
        nginx:
          stableIngress: checkout          # your existing Ingress; controller adds the canary copy
          additionalIngressAnnotations:
            canary-by-header: x-canary       # also allow header-based opt-in for testers
And Gateway API (the vendor-neutral path, via the argoproj-labs Gateway API plugin):
      trafficRouting:
        plugins:
          argoproj-labs/gatewayAPI:
            httpRoute: checkout-route        # an HTTPRoute whose backendRefs get weighted
            namespace: shop
Beyond simple weighting, two advanced traffic features are worth knowing because they change what a canary can validate:
| Feature | Providers | What it enables | Caveat |
|---|---|---|---|
| Header/cookie routing | Istio, NGINX, Gateway API | Route only x-canary: true (internal testers) to the new version first |
Real-user-% still needs setWeight |
| Traffic mirroring (shadow) | Istio | Send a copy of real traffic to the canary; responses discarded | Side effects (writes) must be idempotent/sandboxed |
setHeaderRoute step |
Istio, others | Programmatically add a header route mid-rollout | Provider-dependent support |
setMirrorRoute step |
Istio | Mirror a % of traffic to canary for a step | Great for read-path validation pre-exposure |
GitOps coexistence: stop the reconciler fighting the rollout
Everything so far works if Argo CD and Argo Rollouts respect each other’s territory. Out of the box there are sharp edges; here is the configuration that makes them coexist.
1. Health assessment. Argo CD must understand a Rollout’s health, or it reports the Application as Progressing/Unknown forever (and may behave oddly during a canary). Argo CD ships a built-in Lua health check for argoproj.io/Rollout that maps the Rollout’s phase to CD health (Healthy when fully promoted, Progressing mid-canary, Degraded on failure, Suspended at a manual pause). The Suspended mapping is what lets a pause: {} not look like a stuck sync. Verify it’s active; if you run an old CD, ensure the Rollout health Lua is present.
2. Self-heal and the paused canary. selfHeal: true makes Argo CD revert any cluster drift to Git. The risk: it could try to “correct” the traffic objects Rollouts is actively managing. The fix is that Rollouts owns those objects’ mutable fields, and CD should ignore them. CD ignores Rollout status by default; for the Services/VirtualService whose weights Rollouts mutates, either let Rollouts create them (so they’re not in Git) or add ignoreDifferences. The settings that matter:
| Argo CD setting | Effect | Recommendation with Rollouts |
|---|---|---|
syncPolicy.automated.selfHeal |
Revert drift to Git automatically | true is fine if traffic objects’ weights aren’t tracked in Git, or are ignored |
syncPolicy.automated.prune |
Delete resources not in Git | Ensure it doesn’t prune Rollouts-created AnalysisRun/Services |
ignoreDifferences |
Fields CD won’t diff | Add the VirtualService/Ingress weight fields if they’re in Git |
RespectIgnoreDifferences=true (sync option) |
Don’t sync ignored fields either | Set it so self-heal also skips them |
argocd.argoproj.io/compare-options: IgnoreExtraneous |
Don’t flag extra child resources | Annotate Rollouts-spawned resources |
A safe Application for a Rollout-managed service:
apiVersion: argoproj.io/v1alpha1
kind: Application
metadata:
  name: checkout
  namespace: argocd
spec:
  project: shop
  source:
    repoURL: https://git.shipfast.io/shop/deploy.git
    targetRevision: main
    path: apps/checkout/overlays/prod
  destination:
    server: https://kubernetes.default.svc
    namespace: shop
  syncPolicy:
    automated:
      prune: true
      selfHeal: true
    syncOptions:
      - RespectIgnoreDifferences=true
  ignoreDifferences:
    # Rollouts mutates the VirtualService weights; don't let CD fight it
    - group: networking.istio.io
      kind: VirtualService
      jsonPointers:
        - /spec/http/0/route/0/weight
        - /spec/http/0/route/1/weight
3. The argo-rollouts Argo CD extension. There is a UI/health extension that surfaces the Rollouts dashboard inside the Argo CD UI — you see canary steps, weights, and AnalysisRuns on the Application page, and can promote/abort from there. It’s optional but turns “two consoles” into one.
4. Sync waves vs rollout steps — don’t confuse them. Argo CD sync waves (argocd.argoproj.io/sync-wave) order resource creation within one sync (CRDs before CRs, namespaces before workloads). They are not the canary ramp. The canary ramp is Rollouts’ steps. Keep them mentally separate:
| Mechanism | Scope | Ordering of… | Owner |
|---|---|---|---|
| Argo CD sync wave | One Application sync | Resource apply order | Argo CD |
| Argo CD sync phase (PreSync/Sync/PostSync hooks) | One sync | Hook jobs around the sync | Argo CD |
| Rollouts steps | One release of one Rollout | Traffic ramp + analysis | Argo Rollouts |
| ApplicationSet progressive sync | Many Applications | Rollout across clusters/waves | ApplicationSet controller |
5. Flux variant. With Flux instead of Argo CD, the same split holds: Flux’s Kustomization/HelmRelease reconciles the Rollout and AnalysisTemplate from Git; Argo Rollouts (or Flagger, Flux’s sibling progressive-delivery controller) owns the mechanics. Flagger is the more common pairing with Flux; it uses a Canary CRD that references a Deployment and orchestrates the same canary/blue-green/A-B patterns with its own MetricTemplates. Argo Rollouts vs Flagger, briefly:
| Aspect | Argo Rollouts | Flagger |
|---|---|---|
| Primitive | Rollout CRD (replaces Deployment) |
Canary CRD (references a Deployment) |
| Pairs naturally with | Argo CD | Flux (also works standalone) |
| Strategies | Canary, blue-green, experiments | Canary, blue-green, A/B, blue-green-mirror |
| Analysis | AnalysisTemplate + many providers |
MetricTemplate + providers |
| Traffic | SMI, Istio, NGINX, Gateway API, ALB, App Mesh, plugins | Istio, Linkerd, App Mesh, NGINX, Gateway API, others |
| Migration cost | Convert Deployment→Rollout (or workloadRef) |
Keep Deployment; add a Canary CR |
Multi-cluster: ApplicationSets and progressive rollout across fleets
Single-cluster canary is table stakes; the senior problem is rolling a change across many clusters (regions, prod/staging pairs, per-tenant clusters) with progressive delivery at both layers — canary within each cluster, and a staged wave across clusters. Argo CD’s ApplicationSet templates one Application per target from a generator.
The generator types and what fans out:
| Generator | Produces an Application per… | Typical use |
|---|---|---|
| List | Hard-coded element | A few named clusters/envs |
| Cluster | Argo CD-registered cluster (by label) | “All prod clusters” |
| Git (files/directories) | File or dir in a repo | One app per directory/tenant |
| Matrix | Cross-product of two generators | Cluster × app combos |
| Merge | Merged params from multiple generators | Overlay per-cluster overrides |
| SCM Provider / PR | Repo or pull request | App-per-repo, preview envs |
| Cluster Decision Resource | An external placement CR | Advanced fleet placement |
A cluster generator that deploys the checkout Rollout to every cluster labeled env=prod:
apiVersion: argoproj.io/v1alpha1
kind: ApplicationSet
metadata: { name: checkout, namespace: argocd }
spec:
  generators:
    - clusters:
        selector:
          matchLabels: { env: prod }
  template:
    metadata: { name: 'checkout-{{name}}' }     # {{name}} = the cluster name
    spec:
      project: shop
      source:
        repoURL: https://git.shipfast.io/shop/deploy.git
        targetRevision: main
        path: apps/checkout/overlays/prod
      destination:
        server: '{{server}}'                      # the cluster's API server
        namespace: shop
      syncPolicy:
        automated: { prune: true, selfHeal: true }
The decisive feature is progressive syncs (the ApplicationSet strategy.rollingSync): roll the change across clusters in waves, gated by each wave reaching Healthy (which, thanks to the Rollout health check, means the canary in that cluster passed). Wave 1 might be one canary cluster; wave 2 the rest of a region; wave 3 the world:
  strategy:
    type: RollingSync
    rollingSync:
      steps:
        - matchExpressions:                  # wave 1: canary cluster only
            - { key: wave, operator: In, values: ["canary"] }
        - matchExpressions:                  # wave 2: region-1 prod
            - { key: wave, operator: In, values: ["region-1"] }
        - matchExpressions:                  # wave 3: everywhere else
            - { key: wave, operator: In, values: ["region-2", "region-3"] }
This composes the two layers cleanly. Within a cluster, Rollouts runs the 5%→100% canary with analysis. Across clusters, the ApplicationSet only advances to the next wave once the prior wave’s Applications are Healthy — i.e., their canaries succeeded. A regression in the canary cluster fails its Rollout, the Application stays Degraded, and the wave never advances, so the bad version never reaches the rest of the fleet. The two layers and their gates:
| Layer | Controller | Unit it advances | Gate to advance | Failure containment |
|---|---|---|---|---|
| Intra-cluster | Argo Rollouts | Traffic weight (5%→100%) | AnalysisRun success | Bad release stays at small weight in one cluster |
| Inter-cluster | ApplicationSet (RollingSync) | A wave of clusters | Prior wave Applications Healthy |
Bad release never reaches later waves |
Multi-cluster also raises where the controllers run. Two patterns:
| Topology | Argo CD | Argo Rollouts | Trade-off |
|---|---|---|---|
| Hub-and-spoke | One CD manages many clusters | Rollouts runs in each workload cluster | Central GitOps control; Rollouts must be installed per cluster |
| Standalone per cluster | CD per cluster | Rollouts per cluster | More autonomy/isolation; more to operate |
Rollouts is a workload-cluster controller — it must run where the pods and traffic plane are. Argo CD can be centralized. So a hub CD pushes the Rollout/AnalysisTemplate into each spoke, and each spoke’s local Rollouts controller executes the canary against that spoke’s Prometheus and mesh.
Architecture at a glance
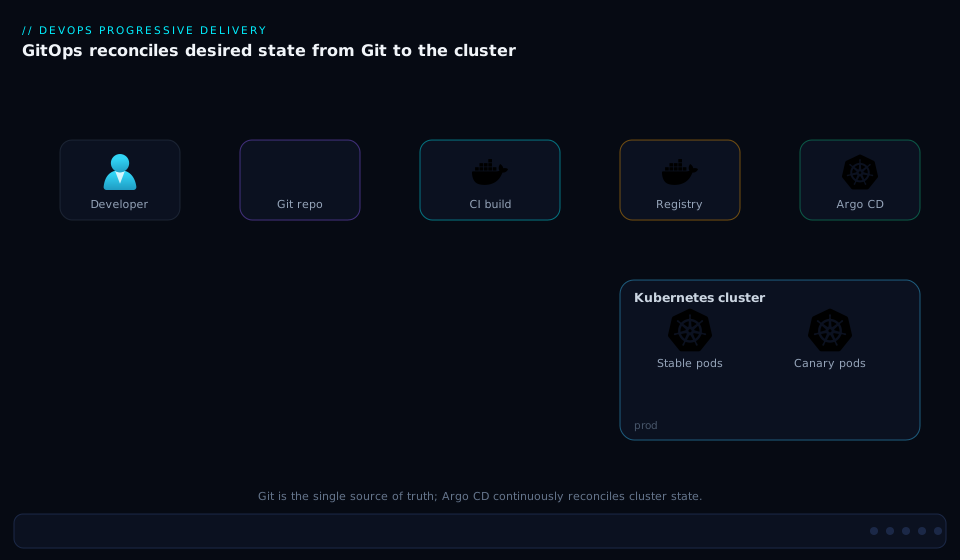
The system is three loops nested inside each other, and the first diagram traces the outer two. Read it left to right: a developer opens a pull request that bumps an image tag; on merge, the change lands in the Git repo, which is the single source of truth. Argo CD continuously reconciles that repo against the cluster — it pulls the desired Rollout and AnalysisTemplate and applies them. The moment the Rollout’s pod template changes (new image), control passes to Argo Rollouts, which creates the canary ReplicaSet alongside the stable ReplicaSet and instructs the traffic router (mesh/ingress) to send a small, growing slice of live traffic to the canary. The reconciler keeps the declared state true; the rollout controller owns the transient traffic state — the diagram’s two distinct loops.
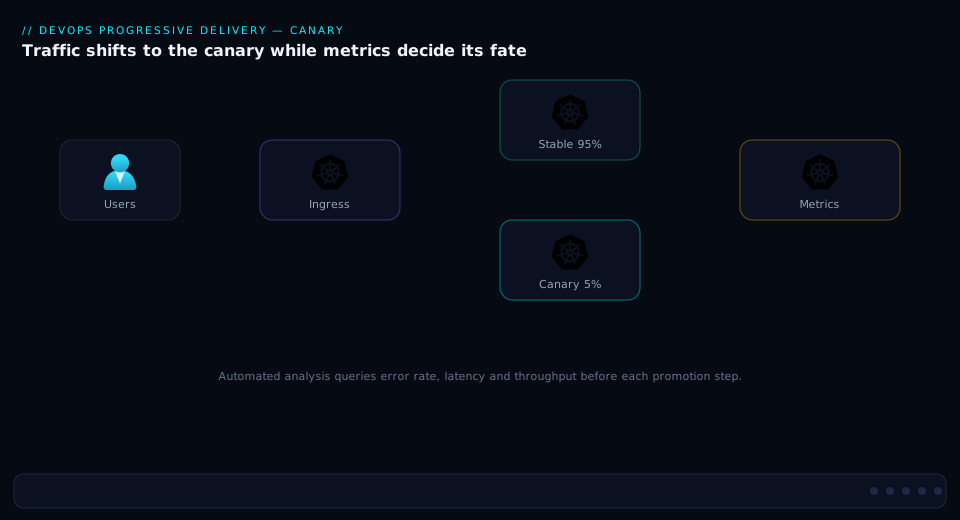
The second diagram zooms into the innermost loop — the canary’s measure-and-decide cycle that runs at each step. Trace it top to bottom: Rollouts sets the weight (say 5%) on the traffic router; a window of real traffic flows to the canary; an AnalysisRun queries the metric provider (Prometheus/Datadog) for error rate and latency; the successCondition is evaluated. On pass, the rollout promotes to the next weight; on fail, it aborts — traffic snaps back to stable in seconds and an alert fires. This promote-or-rollback fork, repeated at every step and continuously in the background, is the entire safety mechanism: no human decides whether the release is healthy; the metric does.
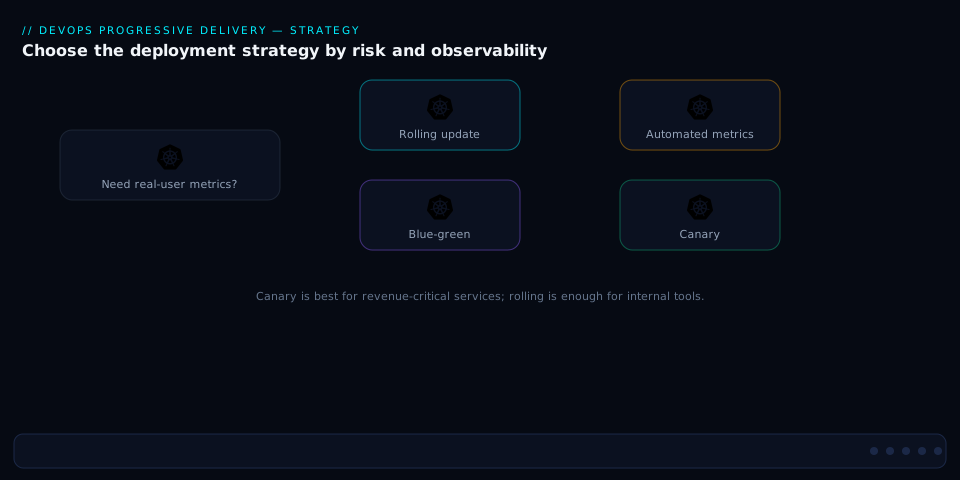
The third diagram is the decision that precedes all of this — choosing which strategy a given workload should use before you write a line of Rollout YAML. It branches on the questions that actually decide it: Do you have trustworthy production metrics? (No → rolling or a manual canary.) Do you need an instant, all-or-nothing flip with double capacity available? (Yes → blue-green.) Do you want to validate on real users with the smallest blast radius? (Yes → canary with analysis.) Is the change low-risk and stateless with no analysis worth wiring? (Yes → a plain rolling update.) The flow turns “which strategy?” from taste into a short, answerable checklist.
Real-world scenario
ShipFast runs an e-commerce platform on three EKS clusters — prod-canary (a tiny prod-traffic cluster taking ~3% of real users via global load balancing), prod-region-1 (Mumbai), and prod-region-2 (Singapore). They use Argo CD (hub-and-spoke, one CD in a management cluster) and Argo Rollouts installed in each workload cluster, with Istio for traffic and Prometheus + Thanos for cross-cluster metrics. The platform team is six engineers; the relevant monthly cloud spend across the three clusters is about ₹9,80,000, of which the progressive-delivery tooling overhead (extra canary capacity, Thanos, the rollouts controllers) is roughly ₹35,000.
Their old world: a Jenkins job ran helm upgrade against each cluster sequentially with a RollingUpdate. A bad checkout release in March took down all three regions in four minutes — rolling update replaced pods everywhere as fast as readiness probes passed; MTTD was eleven minutes (a support escalation), rollback was a frantic re-run of the old chart, and change-failure rate sat near 18%.
The integration they built: every service is a Rollout. CI builds and pushes the image and opens a PR that bumps the tag in the deploy repo’s prod overlay. On merge, an ApplicationSet with RollingSync fans the change out in three waves — prod-canary first, then region-1, then region-2 — advancing only when the prior wave’s Application is Healthy, which (via the Rollout health check) means that cluster’s canary passed. Within each cluster, the checkout Rollout ramps 5% → 25% → 50% → 100% with background analysis on error rate (< 0.5%) and p95 latency (< 300ms) against that cluster’s Prometheus.
In June they shipped checkout:1.9.0. In prod-canary, at 5% weight, background analysis caught p95 latency climbing to 680ms (a new N+1 query against the orders DB under real cart sizes). The AnalysisRun failed at minute three; Rollouts aborted — traffic back to 1.8.3 in ~40 seconds — and posted to #deploys naming the latency metric. Because the canary cluster’s Application went Degraded, the ApplicationSet never advanced to region-1 or region-2: the bad release was contained to ~3% of users in one cluster for under five minutes, touching maybe 1,400 sessions instead of every customer. A git revert of the tag bump reconciled 1.8.3 on the only cluster it had reached, and Git, cluster, and dashboards agreed again. The fix-forward (checkout:1.9.1, query batched) ran the same three-wave canary two hours later, every AnalysisRun passing, and reached all three regions in forty minutes with zero customer impact.
Over the next quarter their change-failure rate fell from 18% to 4%, MTTR dropped from eleven minutes to under two, and deployment frequency rose because engineers stopped fearing releases. The lesson on the wall: “The rollback wasn’t a heroic action — it was a metric crossing a threshold. The save was the wave gate that never opened.”
The incident as a timeline, because the containment is the lesson:
| Time | Event | Layer that acted | Effect |
|---|---|---|---|
| T+0 | PR merged: checkout:1.9.0 |
Git → Argo CD | ApplicationSet starts wave 1 (prod-canary) |
| T+1m | Canary RS at 5% in prod-canary |
Argo Rollouts | ~3% of one cluster’s users on new version |
| T+3m | p95 latency hits 680ms (N+1 query) | Prometheus | Background AnalysisRun measures a failure |
| T+3m20s | AnalysisRun Failed |
Argo Rollouts | Rollout Aborted; traffic → 1.8.3 |
| T+4m | Application Degraded |
Argo CD | ApplicationSet wave gate stays closed |
| T+4m | Slack alert with the metric | Notifications | On-call sees the exact cause |
| T+6m | git revert merged |
Git → Argo CD | Canary cluster reconciled to 1.8.3 |
| T+2h | checkout:1.9.1 PR |
Full flow | Three-wave canary, all green, full fleet |
Advantages and disadvantages
The integration is powerful precisely because the two controllers constrain each other — Git bounds what can run; analysis bounds how fast it gets there. Weigh it honestly:
| Advantages (why the integration wins) | Disadvantages (why it bites) |
|---|---|
Audit trail by construction — every deploy and rollback is a Git commit; git log is the deploy history |
Two controllers, two CRD sets, a mesh, and a metrics stack — large operational surface to learn and run |
| Rollback is math, not heroics — a metric crossing a threshold aborts; no human in the critical path | A canary is only as good as its query; a wrong successCondition or empty result gives false confidence or false aborts |
| Blast radius is bounded twice — by weight within a cluster, by wave across the fleet | Database/schema changes still expose two versions at once; analysis can’t save a destructive migration |
| Drift is detected and corrected — Argo CD continuously reconciles to Git | Misconfigured selfHeal/prune fights the rollout; the coexistence config is subtle |
| Strategy is declarative and reviewable — canary steps and thresholds live in YAML in PRs | Stateful services and long-lived connections (WebSockets, gRPC streams) complicate traffic shifting |
| Composes to multi-cluster — ApplicationSet waves gate on canary health automatically | Requires a real traffic plane (mesh/ingress) for precise weights; replica-count canaries are coarse |
| Metrics-driven culture — forces SLOs and good instrumentation before you can canary | Cultural shift: teams must trust automated rollback over “let me just restart it” |
The model is right for stateless services with meaningful traffic and trustworthy SLOs, deployed to Kubernetes, by teams who want releases to be routine. It is overkill for low-traffic internal tools (a rolling update is fine), and it is dangerous if applied to schema-coupled changes without separate migration discipline — neither canary nor blue-green makes “two database schemas live at once” safe; that needs expand/contract migrations regardless of strategy. The disadvantages are all manageable, but only if you know they exist — which is the point of the failure-mode tables below.
Hands-on lab
Stand up Argo Rollouts on a local cluster, run a canary with a Prometheus-driven analysis gate, deliberately trip the gate, watch the automated rollback, then drive a clean promotion — all GitOps-shaped. Uses kind/minikube (free) and the basic-canary sample style.
Step 1 — Cluster and Argo Rollouts.
kind create cluster --name rollout-lab
kubectl create namespace argo-rollouts
kubectl apply -n argo-rollouts \
  -f https://github.com/argoproj/argo-rollouts/releases/latest/download/install.yaml
# Install the kubectl plugin (macOS); Linux: download the matching binary
brew install argoproj/tap/kubectl-argo-rollouts || true
kubectl argo-rollouts version
Expected: the controller pod Running in argo-rollouts, and the plugin prints a version.
Step 2 — A namespace, two Services, and a canary Rollout. Create app.yaml:
apiVersion: v1
kind: Namespace
metadata: { name: demo }
---
apiVersion: v1
kind: Service
metadata: { name: rollouts-demo-stable, namespace: demo }
spec:
  selector: { app: rollouts-demo }
  ports: [{ port: 80, targetPort: 8080 }]
---
apiVersion: v1
kind: Service
metadata: { name: rollouts-demo-canary, namespace: demo }
spec:
  selector: { app: rollouts-demo }
  ports: [{ port: 80, targetPort: 8080 }]
---
apiVersion: argoproj.io/v1alpha1
kind: Rollout
metadata: { name: rollouts-demo, namespace: demo }
spec:
  replicas: 5
  selector: { matchLabels: { app: rollouts-demo } }
  template:
    metadata: { labels: { app: rollouts-demo } }
    spec:
      containers:
        - name: rollouts-demo
          image: argoproj/rollouts-demo:blue
          ports: [{ containerPort: 8080 }]
  strategy:
    canary:
      canaryService: rollouts-demo-canary
      stableService: rollouts-demo-stable
      steps:
        - setWeight: 20
        - pause: { duration: 30s }
        - setWeight: 50
        - pause: {}            # indefinite — you will promote manually
        - setWeight: 100
kubectl apply -f app.yaml
kubectl argo-rollouts get rollout rollouts-demo -n demo --watch
Expected: the initial rollout goes straight to Healthy at 100% (the first revision isn’t a canary — there’s nothing to canary against).
Step 3 — Trigger a canary by changing the image. In a second terminal:
kubectl argo-rollouts set image rollouts-demo \
  rollouts-demo=argoproj/rollouts-demo:yellow -n demo
Note: in production you bump the tag in Git and let Argo CD sync it.
set imagehere is purely to demonstrate the rollout mechanics locally; never use it against a GitOps-managed repo.
Watch the first terminal: the Rollout creates a canary ReplicaSet, sets weight 20%, pauses 30s, ramps to 50%, then Paused at the indefinite step. The --watch view shows the step index, weight, and both ReplicaSets.
Step 4 — Promote past the manual pause.
kubectl argo-rollouts promote rollouts-demo -n demo
Expected: it proceeds to setWeight: 100, the canary becomes the new stable, and the phase returns to Healthy.
Step 5 — Add an analysis gate and trip it. Create analysis.yaml (a Job-based “always fail” template to force a rollback deterministically without a metrics stack):
apiVersion: argoproj.io/v1alpha1
kind: AnalysisTemplate
metadata: { name: fail-check, namespace: demo }
spec:
  metrics:
    - name: fail
      provider:
        job:
          spec:
            backoffLimit: 0
            template:
              spec:
                restartPolicy: Never
                containers:
                  - name: fail
                    image: busybox:1.36
                    command: ["sh", "-c", "exit 1"]   # exit 1 = failed metric → abort
Patch the Rollout to run it as an inline step after the first weight, then deploy a new image to trigger it:
kubectl apply -f analysis.yaml
# Insert an analysis step (edit app.yaml's steps to add, after the first pause):
#   - analysis: { templates: [ { templateName: fail-check } ] }
kubectl apply -f app.yaml
kubectl argo-rollouts set image rollouts-demo \
  rollouts-demo=argoproj/rollouts-demo:red -n demo
kubectl argo-rollouts get rollout rollouts-demo -n demo --watch
Expected: the canary ramps to 20%, the inline AnalysisRun runs the Job, the Job exits 1, the run is Failed, and the Rollout Aborted — traffic snaps back to the previous stable (yellow). You just watched an automated rollback driven by a failing analysis.
Step 6 — Inspect the abort and recover.
kubectl argo-rollouts get rollout rollouts-demo -n demo     # phase: Degraded/Aborted
kubectl get analysisrun -n demo                              # the Failed run
kubectl describe analysisrun -n demo                         # see the failing metric/job
# Durable recovery in real life = git revert. Here, set the image back / retry after a "fix":
kubectl argo-rollouts undo rollouts-demo -n demo             # break-glass rollback of the cluster
Validation checklist. You installed Argo Rollouts, ran a stepped canary with weights and a manual pause, promoted it, then added an analysis gate, tripped it, and observed an automated abort with traffic returning to stable — and you saw why the durable rollback in a GitOps world is a git revert, not undo. What each step proved:
| Step | What you did | What it proves | Real-world analogue |
|---|---|---|---|
| 3–4 | Canary ramp + manual promote | The step/pause choreography is real and controllable | A human-gated big jump |
| 5 | Analysis gate fails | A failing metric/Job aborts the rollout automatically | A real error-rate breach |
| 6 | Aborted state + recovery | Abort is fast (status) but durability needs Git | The abort→revert sequence |
Cleanup.
kind delete cluster --name rollout-lab
Cost note. Entirely local and free — kind runs in Docker. The only “cost” is the CPU on your laptop; deleting the cluster reclaims everything.
Common mistakes & troubleshooting
The playbook — the part you bookmark. First a scannable table for mid-incident, then expanded reasoning for the entries that bite hardest. Symptom → cause → confirm → fix:
| # | Symptom | Root cause | Confirm | Fix |
|---|---|---|---|---|
| 1 | Canary “works” but the % isn’t precise (e.g., can’t do 5%) | No trafficRouting; weighting is by replica count |
kubectl argo-rollouts get rollout shows weight ≈ pod ratio |
Add trafficRouting (Istio/NGINX/Gateway API) for exact weights |
| 2 | Argo CD shows the app OutOfSync forever during a canary |
CD diffs the mesh weights Rollouts is mutating | argocd app diff shows VirtualService weight churn |
ignoreDifferences on the weight paths + RespectIgnoreDifferences=true |
| 3 | selfHeal resets the canary mid-ramp |
CD reverts “drift” that is actually Rollouts’ runtime state | CD sync events during the ramp | Let Rollouts own traffic objects; don’t track live weights in Git |
| 4 | AnalysisRun is always Inconclusive |
Prometheus query returns no series | kubectl describe analysisrun → empty result |
Fix the PromQL label match; raise inconclusiveLimit only after the query is right |
| 5 | Rollout stuck Paused and never promotes |
An indefinite pause: {} with no human/analysis to advance |
Phase Paused, step index at a pause: {} |
kubectl argo-rollouts promote; or replace with a timed pause/analysis |
| 6 | Rollout Degraded with “ProgressDeadlineExceeded” |
No progress within progressDeadlineSeconds (pods not ready, stuck pause) |
kubectl describe rollout condition |
Fix readiness/pods; raise the deadline for long canaries; check the pause |
| 7 | Rollback “didn’t stick” — bad version came back on next sync | Aborted the cluster but Git still holds the new tag | git show the prod overlay still = new image |
git revert the tag bump; reconcile; never rely on undo alone |
| 8 | prune deleted AnalysisRuns / the canary Service |
CD pruned Rollouts-created resources not in Git | CD shows them pruned; rollout errors | Mark them non-pruned or scope the Application; let Rollouts manage them |
| 9 | Blue-green flipped early to an untested green | CD re-labeled activeService selector before promote |
Service selector points to green pre-promote |
Let Rollouts own the active Service selector; CD ignores that field |
| 10 | Canary passes analysis but users still see errors | Query measures the wrong thing (e.g., gateway, not the canary Service) | The query’s label selector targets the wrong service | Point analysis at canaryService; align labels with the canary RS |
| 11 | ApplicationSet rolled the bad version to all clusters at once | RollingSync not configured (default = all in parallel) |
No strategy.rollingSync in the ApplicationSet |
Add RollingSync steps; gate waves on Healthy |
| 12 | Mesh weights set but traffic doesn’t actually split | Mesh sidecar not injected / route not matching | istioctl proxy-config routes; no sidecar on pods |
Enable injection; ensure the VirtualService route matches the host |
| 13 | retry re-runs the same broken image |
Git tag unchanged; retry restarts at the current desired version |
kubectl argo-rollouts get rollout shows same image |
Only retry after a real fix; otherwise git revert/fix-forward |
| 14 | Datadog/web analysis errors consecutiveErrorLimit |
API key/secret wrong, endpoint unreachable | describe analysisrun shows provider error, not metric failure |
Fix the Secret/URL; distinguish error from a failing metric |
The expanded form for the four that bite hardest:
Imprecise canary % (#1). Without trafficRouting, Rollouts weights by the ratio of canary to stable pods — on a 4-replica service the finest split is 25%, so “5%” is impossible and the actual weight tracks the pod ratio, not your setWeight. Fix: configure a trafficRouting provider so the data plane enforces weights independent of replica counts.
Argo CD fights the rollout (#2/#3). Rollouts mutates live traffic objects (e.g., VirtualService weights); if those are tracked in Git, CD sees the runtime weight as drift and either flags OutOfSync or (with selfHeal) re-applies Git, snapping weights back — visible as weight churn in argocd app diff and sync events during the ramp. Fix: let Rollouts create the traffic objects (so they aren’t in Git), or add ignoreDifferences on the weight jsonPointers with RespectIgnoreDifferences=true. CD ignores Rollout status by default — only the traffic objects need this.
The rollback didn’t stick (#7). abort/undo changes the cluster, but Git still holds the new tag (confirm with git show on the prod overlay), so the next reconcile re-applies it. Fix: git revert the tag-bump commit (or push a fix-forward tag) so Git, cluster, and dashboards agree. Treat Aborted as “Git needs a decision now,” not “done.”
The whole fleet got the bad version (#11). An ApplicationSet without strategy.rollingSync syncs all generated Applications in parallel, hitting every cluster at once and defeating the multi-cluster gate. Fix: add RollingSync steps that gate each wave on the prior wave’s Applications being Healthy (i.e., their canaries passed). Inconclusive-on-empty-query (#4) is covered under Quick check.
Best practices
- Keep the responsibility split sacred. Git owns intent (image, strategy, thresholds); Rollouts owns mechanics (steps, traffic, analysis). Never imperatively
set imagein a GitOps repo, and never track live traffic weights in Git. - Always add background analysis to a canary, not just step-gated inline analysis. Background analysis watches the entire ramp and aborts the instant a metric fails — between steps, not only at them.
- Write the analysis query first, in your dashboard, and prove it returns a number for the canary before wiring it into a
successCondition. A canary is only as trustworthy as its judge; an empty result is the #1 cause of false confidence and false aborts. - Use precise
trafficRouting(Istio/NGINX/Gateway API/ALB) for anything serious; replica-count weighting can’t do small percentages and couples weight to scale. - Set
scaleDownDelaySeconds(blue-green) andabortScaleDownDelaySeconds(canary) generously enough to inspect a failed version and to keep instant rollback available — a few minutes, not the 30s default, for critical services. - Make rollback durable with
git revert, notundo. Abort is the fast runtime save; the revert is what restores Git-as-source-of-truth and gives you a postmortem trail. Practice the abort→revert sequence until it’s muscle memory. - Gate multi-cluster rollouts with ApplicationSet
RollingSync, canary cluster first. The wave that never opens is your best containment — a regression in the canary cluster must not reach the rest of the fleet. - Configure coexistence explicitly:
RespectIgnoreDifferences=true,ignoreDifferenceson mutated traffic fields, ensure the Rollout health check (and the manual-pause→Suspendedmapping) is active, and protect Rollouts-created resources fromprune. - Wire notifications on
on-rollout-abortedandon-analysis-run-failedwith the failing metric in the message, so an automated rollback still reaches a human with the why. - Separate liveness from the analysis SLO. The canary’s analysis should reflect user-facing SLOs (error rate, latency, saturation) — not a deep health check that flaps on optional dependencies.
- Don’t canary schema-coupled changes without expand/contract migrations. Neither canary nor blue-green makes two live schemas safe; decouple the migration from the rollout (backward-compatible DB change first, code second).
- Keep canary steps few and bake times honest. Enough time at each weight to gather statistically meaningful metrics (minutes, tied to your traffic rate), but not so many steps that releases drag.
The leading indicators worth alerting on across this system — not just “rollout failed”:
| Alert on | Signal | Threshold (starting point) | Why it’s leading |
|---|---|---|---|
| AnalysisRun failures | on-analysis-run-failed events |
Any | The automated rollback’s trigger — know why |
Rollouts stuck Paused |
Phase Paused age |
> 30m unexpectedly | A manual gate nobody is advancing |
Rollouts Degraded |
Phase Degraded |
Any | A failed/stalled release needing a Git decision |
Argo CD OutOfSync during ramp |
App health vs sync | Sustained OutOfSync mid-canary |
The reconciler may be fighting the rollout |
| ApplicationSet wave stalled | Wave not advancing | Wave blocked > expected canary time | A canary failed; containment working — investigate |
| Provider errors in analysis | consecutiveErrorLimit hit |
Any | The judge can’t read metrics — false aborts loom |
Security notes
- The Git repo is the deploy control plane — protect it like one. Require PR review and branch protection on the deploy repo; a merge is a production change. Use signed commits and, ideally, policy-gated merges (OPA/Kyverno or an admission check) so only approved images/tags reach prod.
- Scope Argo CD
AppProjects tightly. Restrict which repos, clusters, and namespaces an Application may target, and which resource kinds it may manage, so a compromised or misconfigured Application can’t deploy arbitrary workloads fleet-wide. - Least-privilege the controllers. Argo Rollouts needs RBAC over
Rollout/AnalysisRun/Service/the traffic CRDs in its namespaces — not cluster-admin. Argo CD’s cluster credentials (especially hub-and-spoke) are high-value; store them as Secrets with the narrowest practical RBAC. - Guard the metric-provider credentials. Datadog/CloudWatch/web API keys live in Secrets the
AnalysisTemplatereferences — a leaked key can exfiltrate metrics or, worse, let an attacker forge a passing analysis. Rotate them; use IRSA/workload identity for cloud providers instead of static keys where possible. - Pin and scan images; verify provenance. The tag in Git should resolve to a scanned, signed image (cosign/Notation) — a canary that “passes” a tampered image is still a compromise. Pin by digest in prod overlays so a moved tag can’t swap the artifact.
- Don’t let analysis Jobs become a foothold. A
jobmetric runs an arbitrary Pod in your cluster; restrict its image source, run it non-root with a locked-down ServiceAccount, and never give the smoke-runner broad cluster permissions. - Lock down the traffic plane changes. The mesh/ingress objects Rollouts mutates are security-relevant (they route production traffic); ensure only the Rollouts controller (not random users) can write them, via RBAC.
- Audit aborts and promotes. Treat
on-rollout-aborted/on-rollout-completedevents and the corresponding Git history as a security-relevant audit trail — who promoted what, when, and what the analysis said.
Most of these controls pull double duty — they secure and stabilize. PR review and digest pinning stop both unreviewed changes and accidental bad-tag deploys; tight AppProject scoping prevents both lateral movement and misrouted deploys; secret-managed, rotated provider keys avoid both credential leaks and the stale-key analysis errors that cause false aborts. Security and reliability are the same investment here.
Cost & sizing
The cost of progressive delivery is mostly extra capacity during releases plus tooling overhead, and it is small relative to the revenue it protects.
- Canary capacity is cheap. A canary adds a small slice of extra pods (the canary ReplicaSet at the current weight); with
dynamicStableScale/setCanaryScaleyou can keep the total near baseline by scaling stable down as canary scales up. Budget a low single-digit percent capacity overhead during a release. - Blue-green is expensive during the flip window. It runs two full stacks while
scaleDownDelaySecondskeeps blue alive — effectively double capacity for that window. The longer your rollback window, the longer you pay double. Right-sizescaleDownDelaySecondsto your real rollback need (minutes), not hours. - Tooling overhead is modest and fixed. The Argo Rollouts controller is lightweight; Argo CD is a steady, small footprint; the real add is the metrics stack (Prometheus + Thanos/Mimir for multi-cluster) you likely run anyway for observability. Treat it as shared infra, not a per-service cost.
- The mesh has a cost. If you adopt Istio/Linkerd just for traffic shifting, the sidecars add CPU/memory per pod — weigh that against NGINX/Gateway-API canary routing, which avoids per-pod sidecars.
- The savings are in avoided incidents. A bounded canary that catches a regression at 5% in one cluster avoids the cost of a full-fleet outage during peak — for an e-commerce checkout, that’s the entire ROI in a single save.
A rough monthly picture for a mid-size platform (the ShipFast shape, three clusters), and what each line buys:
| Cost driver | What you pay for | Rough share | What it buys | Watch-out |
|---|---|---|---|---|
| Canary extra capacity | A few extra pods during releases | ~1–3% of compute | Bounded blast radius | Negligible with dynamicStableScale |
| Blue-green double stack | 2× capacity during flip windows | Spiky (per release) | Instant flip-back | Costly if scaleDownDelay is long |
| Metrics stack (Prometheus+Thanos) | Cross-cluster metrics retention | Shared observability cost | The judge for every canary | Cardinality/retention can balloon |
| Service mesh sidecars | CPU/RAM per pod (if Istio/Linkerd) | ~5–10% per-pod overhead | Precise weights, mirroring | Skip if NGINX/Gateway-API suffices |
| Controllers (CD + Rollouts) | Small fixed footprint | Minor | The whole automation | Largely fixed regardless of scale |
| Avoided-outage value | (negative cost) | — | Revenue protected per save | The actual ROI |
Sizing the analysis itself matters too: too-short bake times measure noise (false promotes/aborts); too-long ones make releases drag and double-capacity windows expensive. Tie count × interval to your traffic rate — enough requests through the canary for a statistically meaningful error-rate/latency estimate. A 1,000-rps service can bake meaningfully in a couple of minutes per step; a 10-rps internal service may need much longer (or shouldn’t canary at all — use a rolling update).
Interview & exam questions
1. Explain the division of responsibility between Argo CD and Argo Rollouts in a GitOps progressive-delivery setup. Argo CD reconciles declared state from Git into the cluster and detects drift — it owns the image tag, strategy, and analysis thresholds because those live in Git. Argo Rollouts owns the lifecycle of the change: creating canary/stable ReplicaSets, manipulating traffic weights, running AnalysisRuns, and deciding promote/abort. The intermediate traffic state (5%, 25%) is runtime status Rollouts owns and is correct to not be in Git. Blurring this (tracking live weights in Git, or set image imperatively) makes the reconciler fight the rollout.
2. A canary passes its analysis but users still report errors. What’s the most likely cause? The analysis query is measuring the wrong thing — typically it targets the gateway or the stable Service rather than the canary Service/ReplicaSet, so it never sees the canary’s errors. Confirm by checking the query’s label selector against the canary RS labels; fix by pointing analysis at canaryService and aligning labels so the metric reflects only canary traffic.
3. How does automated rollback actually work, and why isn’t kubectl argo-rollouts abort the whole rollback in GitOps? A failed AnalysisRun (or manual abort) sets the Rollout to Aborted and the traffic router sends 100% back to the stable ReplicaSet in seconds — fast because stable is still running. But Git still holds the new tag, so the abort is a runtime status, not a durable fix; the next reconcile could re-apply the bad version. The durable rollback is git revert of the tag bump, which restores Git-as-source-of-truth agreement and records the rollback in history. Abort then revert.
4. Difference between inline, background, and pre/post-promotion analysis? Inline analysis is a canary step — it gates that ramp and blocks until it passes. Background analysis runs continuously across the whole canary (no count), aborting the instant any metric fails — the safety net between steps. Pre-promotion (blue-green) runs against the preview Service before the flip to catch a bad green; post-promotion runs after the flip on live green and can flip back. Same AnalysisTemplate, three placements.
5. Without a service mesh or trafficRouting, how does Argo Rollouts implement a canary, and what’s the limitation? It approximates the weight by the ratio of canary to stable pods (replica-count weighting) — 1 canary + 9 stable ≈ 10%. The limitation is coarse granularity (you can’t do 5% on a 4-replica service) and coupling of weight to scale. With trafficRouting (Istio/NGINX/Gateway API/ALB), weights are enforced by the data plane independent of replica counts, enabling precise small percentages.
6. How do you stop Argo CD’s selfHeal from resetting a canary mid-ramp? Rollouts mutates the live traffic objects (e.g., VirtualService weights); if those are tracked in Git, selfHeal sees the runtime weight as drift and re-applies Git, snapping it back. Fix: let Rollouts create the traffic objects (so they’re not in Git), or add ignoreDifferences on the weight jsonPointers and set RespectIgnoreDifferences=true so self-heal also skips them. CD ignores Rollout status by default, so only the traffic objects need this care.
7. What makes an AnalysisRun Inconclusive versus Failed, and how does each affect the rollout? A measurement is Failed if successCondition is false; the run Fails (and the rollout aborts) once failures exceed failureLimit. A measurement is Inconclusive if it’s neither clearly success nor failure — most commonly an empty metric result (bad query) — and exceeding inconclusiveLimit makes the run Inconclusive, which pauses the rollout for a human rather than promoting. A provider error (unreachable backend) beyond consecutiveErrorLimit is treated as failure → abort.
8. How do you roll a change across many clusters with progressive delivery at both layers? Use an Argo CD ApplicationSet with a cluster/Git generator to template one Application per cluster, and configure strategy.rollingSync to advance in waves (canary cluster first), gating each wave on the prior wave’s Applications being Healthy. Within each cluster, the Rollout runs the canary with analysis. Because Healthy (via the Rollout health check) means that cluster’s canary passed, a regression fails the canary cluster’s Application and the wave never advances — containing the bad version to one cluster.
9. Walk through a blue-green release with Argo Rollouts, including the analysis timings. A new image creates the green ReplicaSet; previewService points at green so testers/synthetic traffic can hit it without affecting users. Pre-promotion analysis runs against the preview (smoke + SLO). On pass and a promote (or autoPromotionEnabled), the controller re-labels activeService to green — an atomic 100% flip. scaleDownDelaySeconds keeps blue alive for instant flip-back; post-promotion analysis verifies real traffic on green and aborts (flips back) if it fails.
10. Why is retry dangerous after an analysis-driven abort, and what should you do instead? kubectl argo-rollouts retry restarts the canary at the current desired version, which — in GitOps — is still the bad tag in Git, so it re-runs the same broken image and likely aborts again. Instead, either git revert to the known-good tag (durable rollback) or push a fix-forward tag (:1.9.1); only retry after the underlying issue is actually fixed.
11. Argo CD sync waves vs Argo Rollouts steps — what’s the difference? Sync waves (argocd.argoproj.io/sync-wave) order resource creation within a single Application sync (e.g., CRDs before CRs) — they are not a traffic ramp. Rollouts steps are the canary choreography (setWeight/pause/analysis) for a single release of one Rollout. ApplicationSet RollingSync is yet a third thing: ordering the rollout of many Applications across clusters. Three distinct ordering mechanisms at three scopes.
12. When should you NOT use canary or blue-green, even with this stack? When the change is schema-coupled (a destructive DB migration) — neither strategy makes two live schemas safe; you need expand/contract migrations decoupled from the rollout. Also when traffic is too low for meaningful analysis (a 10-rps internal tool can’t produce a statistically valid canary signal — use a rolling update), or for batch/stateful workloads where traffic-shifting doesn’t apply.
These map to CKAD/CKA-adjacent Kubernetes delivery skills and, on the certification side, to vendor GitOps tracks (Argo CD/Argo Rollouts and Flux/Flagger): the responsibility split and coexistence settings show up in Argo CD operations/troubleshooting, the AnalysisTemplate/provider and traffic-routing material in the Argo Rollouts and service-mesh (Istio/Linkerd, CKS) tracks, and automated rollback in SRE and platform-design interviews.
Quick check
- In a GitOps + Argo Rollouts setup, the cluster is at 25% canary weight but that 25% is not in Git. Is that a bug? Who owns that state?
- A canary’s AnalysisRun keeps coming back
Inconclusiveand the rollout won’t promote. What’s the single most likely cause and how do you confirm it? - You ran
kubectl argo-rollouts abortand traffic returned to stable — but an hour later the bad version is back. Why, and what should you have done? - You need a precise 5% canary on a service with only 4 replicas. What must you configure?
- An ApplicationSet pushed a bad release to all three prod clusters simultaneously. What was missing?
Answers
- Not a bug. The 25% is transient runtime state that Argo Rollouts owns; Git holds the intent (“get to the new version via canary”), not the live weight. It is correct that Git doesn’t track intermediate weights — and tracking them would make Argo CD fight the rollout.
- An empty metric result — the Prometheus/Datadog query returns no series (wrong label match, service-name typo, not-yet-scraped metric), which counts as inconclusive; exceeding
inconclusiveLimitpauses (doesn’t promote). Confirm withkubectl describe analysisrun(empty measurement) and by running the query directly in your metrics backend. Fix the query, don’t raise the limit. - Because
abortchanges the cluster but Git still holds the new tag — the next reconcile re-applies the bad version. You should have followed the abort with agit revertof the tag bump (or a fix-forward tag) so Git, cluster, and dashboards agree. Abort is the fast save; revert is the durable fix. - A
trafficRoutingprovider (Istio/NGINX/Gateway API/ALB). Without it, weighting is by replica-count ratio, so a 4-replica service can’t do finer than 25%; withtrafficRouting, the data plane enforces an exact 5% independent of pod count. strategy.rollingSyncon the ApplicationSet. Without it, the ApplicationSet syncs all generated Applications in parallel, hitting every cluster at once.RollingSyncwith waves (canary cluster first, gated on the prior wave beingHealthy) is the containment that keeps a bad release from reaching the whole fleet.
Glossary
- Progressive delivery — shipping changes in small, observable increments (canary/blue-green) with metric-gated promotion and automated rollback, to bound blast radius.
- GitOps — a model where Git is the single source of truth for desired state, and a controller continuously reconciles the cluster to it (pull-based).
- Argo Rollouts — a Kubernetes controller providing a
RolloutCRD (drop-in forDeployment) with canary/blue-green strategies, traffic management, and analysis. - Argo CD — a GitOps reconciler that syncs
Applications (Git path → cluster) and detects/corrects drift. - Flux / Flagger — the CNCF GitOps reconciler (Flux) and its progressive-delivery sibling (Flagger, a
CanaryCRD); the common alternative to Argo CD/Rollouts. Rollout— the Argo Rollouts CRD that manages two ReplicaSets (stable + canary/preview) and a release strategy.- Stable / canary ReplicaSet — the known-good version serving most traffic, and the new version under test, respectively.
AnalysisTemplate/AnalysisRun— a reusable spec of metric gates, and one execution of it that yields a pass/fail verdict.- Metric provider — the backend an analysis metric queries: Prometheus, Datadog, CloudWatch, New Relic, a Kubernetes Job, a web endpoint, Graphite/InfluxDB, Kayenta, etc.
successCondition/failureLimit/inconclusiveLimit— the boolean a measurement must satisfy, and how many failing/inconclusive measurements are tolerated before the run fails/becomes inconclusive.trafficRouting— the integration that lets Rollouts set precise traffic weights via SMI, Istio, NGINX, Gateway API, ALB, or App Mesh; without it, weighting is by replica count.setWeight/pause/analysis(steps) — the canary choreography: move N% to canary, hold (timed or manual), and run an analysis gate.activeService/previewService— the blue-green Service handles for the live version and the pre-flip green version.autoPromotionEnabled/scaleDownDelaySeconds— blue-green knobs to flip automatically and to keep the old stack alive for instant rollback.- Abort — the Rollout state where traffic returns to stable after a failed analysis or manual abort; fast, but a runtime status, not a Git change.
git revert(as rollback) — reverting the tag-bump commit so Argo CD reconciles the known-good version; the durable rollback that restores Git-as-source-of-truth.selfHeal/prune— Argo CD sync-policy options that revert drift and delete extraneous resources; must be configured so they don’t fight Rollouts.ignoreDifferences/RespectIgnoreDifferences— Argo CD controls to exclude fields (e.g., mesh weights Rollouts mutates) from diffing and syncing.Application/ApplicationSet— an Argo CD unit of sync (Git → cluster), and a controller that templates many Applications from a generator for multi-cluster fan-out.RollingSync(progressive sync) — an ApplicationSet strategy that advances a change across clusters in waves, gating each wave on the prior wave’s health.- Expand/contract migration — a backward-compatible, two-phase database change pattern that makes schema changes safe regardless of deployment strategy.
Next steps
You can now design a release system where Git is the intent, Rollouts is the executor, metrics are the judge, and humans approve a PR or read a postmortem. Build outward:
- Foundations to revisit: Deployment Strategies: Blue-Green, Canary and Rolling Updates — the strategies this article integrates, in isolation.
- Related: GitOps with Argo CD and Flux: Deliver from Git — the reconciliation half of the integration, in depth.
- Related: Progressive Delivery and Feature Flags: Release Without Fear — flags as the in-process complement to infra-level traffic shifting.
- Related: DevOps Observability: Logs, Metrics, Traces and SLOs — the SLOs and queries that make your canary analysis trustworthy.
- Related: CI/CD Pipelines Explained: From Code Commit to Production — the build-and-push-and-bump-the-tag half that feeds this flow.
- Related: DORA Metrics and Platform Engineering: Measure and Scale Delivery — how this pushes change-failure rate down and deployment frequency up at once.
- Related: Git Branching Strategies: Trunk-Based, GitFlow and Feature Branches — the branching model behind the PR-driven deploy repo.