There is a specific moment, familiar to everyone who has run production Linux, where the incident stops being about commands and starts being about thinking. The website is throwing 503s, so a junior restarts the web server — and it works, for ninety seconds, then the 503s come back. They restart it again. They bump the upstream timeout. They add a replica. Each “fix” buys minutes because none of them touch the actual fault, which is three layers down: a runaway cron job has filled /var, and every service that needs to write a file is now failing. The restart was never a fix. It was a reset button on a countdown timer.
This is the capstone of the troubleshooting track, and it teaches the one skill that separates a senior operator from a fast typist: the symptom and the root cause almost always live in different layers of the stack, and the entire job is tracing the causal chain from the visible symptom down to the invisible cause. You already have the method — define, reproduce, isolate the layer, hypothesise, change one thing, verify, document — from the systematic troubleshooting lesson. Here we apply it to the incidents that method exists for: hard, multi-layer failures where the tempting fix is wrong, where the evidence is scattered across five different logs on five different clocks, and where the only way through is correlation. We will build an incident timeline, we will work five fully-realistic case studies end to end, and we will close by turning each fix into a detection so it never pages you twice.
Why this matters: the symptom is a pointer, not the cause
Everything earlier in this course taught you how a subsystem works — how the kernel boots, how systemd orders units, how the page cache and the OOM killer manage memory, how the network stack moves a packet. Root-cause analysis is where all of it collides at once. A real incident does not respect your mental boundaries between “storage” and “networking” and “the app.” It hands you one symptom — a slow page, a killed process, a 503 — and the fault that produced it could be anywhere below.
The reason juniors get stuck is that a failure at a low layer masquerades as a failure at every layer above it. When the disk fills, the service looks broken (it won’t start), the app looks broken (it 500s), and the user sees an error — but every one of those is a symptom, and the cause is storage. Reacting to the symptom you can see is like taking painkillers for appendicitis: the pain is real, the pain is where it hurts, and the pain is not the problem. The senior’s instinct is the opposite of the junior’s: the more obvious the symptom, the more suspicious they are that the cause is somewhere else entirely.
The good news is that Linux is extraordinarily diagnosable — but multi-layer incidents demand one thing single-layer ones did not: correlation across sources. No single log holds the whole story. The app log says “database write failed,” journald says nginx returned 502, the kernel says No space left on device, and metrics say /var crossed 100% at 02:12 — only laid on one timeline does the chain snap into focus. Correlation, the relentless “what changed?” question, and a disciplined five-whys are the whole capstone: the layer method finds where, correlation finds when, five-whys finds why. And carry this through every case — the fix that makes the symptom vanish is rarely the fix that stops it recurring: truncating the giant log frees the disk and the 503s stop, for an hour, until the still-running cron refills it. You are not done until you have fixed the bottom of the chain and added the detection that catches it next time.
The disciplined method, recast for cross-layer incidents
The loop does not change for a hard incident — but three of its steps carry almost the entire weight, so we sharpen them here rather than repeat the basics. (The full eight-step loop and the 60-second first-five triage live in the methodology lesson; run that triage first, every time, before anything below.)
| Loop step | In a simple incident | In a multi-layer incident (the hard part) |
|---|---|---|
| Observe / reproduce | Trigger the failure once | Reproduce and capture the exact timestamp so you can anchor a timeline |
| Blast radius | One host or the fleet? | Which layer’s blast radius matches? One app = app/config; every app on the host = a shared lower layer (disk, kernel, NIC) |
| Hypothesise | One testable cause | One testable cause and which layer it lives in — name the layer explicitly |
| Bisect / isolate | Walk the stack, stop at first wrong layer | Correlate across sources by timestamp to find which layer broke first in time |
| Change ONE thing | Fix it | Fix the lowest cause in the chain, not the highest symptom |
| Verify | Re-run the failing check | Re-run it and confirm the whole chain above it clears |
| Document | Note cause + fix | Write the causal chain (five-whys) + add a detection at the cause layer |
The heart of a cross-layer investigation is the mapping between the layer where the symptom appears and the layer where the cause lives. Internalise this table — it is the entire thesis of the lesson, and it will make you suspicious of the obvious in exactly the right way:
| Reported symptom (top layer) | Appears in layer | Where the cause often actually lives | The causal chain |
|---|---|---|---|
| Web app 503 / 5xx | App / load balancer | Storage — a full /var |
log fills /var → app write fails (ENOSPC) → 5xx |
| Intermittent p99 latency | App (tail latency) | Network or kernel | flapping NIC → TCP retransmits → request stalls |
| Process killed “randomly” | Service / app | Kernel (OOM), triggered by another service | batch leaks RAM → OOM killer → kills the innocent big process |
| Can’t SSH after a reboot | Network / service | Storage / config | bad fstab line → emergency mode → sshd never starts |
| DNS “works then doesn’t” | App (resolution) | Network infra + resolver cache | dead secondary DNS + TTL expiry → intermittent SERVFAIL |
| “The database is slow” | App (query time) | Storage I/O / memory / CPU steal | noisy neighbour or swap → high I/O await → slow queries |
| Host CPU pinned at 100% | Host (CPU) | Kernel (softirq, khugepaged, compaction) | THP compaction stalls → high sys CPU → everything slow |
| Logins hang for 30s | User / auth | Storage (full /) or network (LDAP/SSSD) |
full / → PAM can’t write session → hang |
Notice the pattern: the symptom is almost always higher in the stack than the cause, because higher layers depend on lower ones and inherit their failures. That single asymmetry is why the method says walk the stack downward and stop at the first layer that is provably wrong — the first broken layer, reading top to bottom, is the cause; everything above it is an echo.
The five case studies ahead each follow this asymmetry, and each tempts you toward a specific wrong fix at the symptom layer. Keep this roadmap in view — the tempting fix is the exact trap the rest of the lesson trains you to resist:
| # | Reported symptom | The tempting (wrong) fix | Why it fails | The real root cause (lower layer) |
|---|---|---|---|---|
| 1 | Web app 503s | restart the app / bump timeouts | frees nothing; the writer refills the disk | runaway cron fills /var (storage) |
| 2 | p99 latency spikes | profile the app / scale out | every replica sits on the same broken layer | flapping NIC → TCP retransmits (network) |
| 3 | Process killed nightly | raise its memory / Restart=always |
it is the victim, not the culprit | another service leaks → OOM killer (kernel) |
| 4 | No SSH after a reboot | reboot again / rebuild the box | re-enters emergency mode; destroys evidence | bad fstab → emergency mode (config) |
| 5 | DNS works then doesn’t | add the IP to /etc/hosts |
papers over it; breaks on the next IP change | dead secondary DNS + cache (network) |
The tools that span layers
Simple incidents are solved by single-layer tools (systemctl status, ip a). Cross-layer incidents need tools that tie two layers together — a socket to a PID, a syscall to a file, a spike to a kernel event. This is the toolbox for correlation, and the right column — the correlation trick — is what turns each one from a status command into a timeline entry:
| Tool | Ties together | Answers | The correlation trick |
|---|---|---|---|
journalctl -o short-iso --since --until |
every systemd source | “everything in this 5-minute window” | -o short-iso gives sortable timestamps; bound with --since/--until; add -k to fold in the kernel |
dmesg -T / journalctl -k |
kernel ↔ hardware | “did the kernel log an event at time T?” | -T for human timestamps; join OOM / I/O-error / link-flap lines to the app’s spike |
ss -tiepm |
network ↔ process | “which socket, owned by whom, is retransmitting?” | per-socket retrans/rtt; -p names the PID so a network fault points at an app |
iostat -xz 1 / sar -d |
storage ↔ app | “is the disk the stall, and since when?” | %util and await as a live timeline; sar replays it from history |
/proc/pressure/* (PSI) |
cpu·mem·io ↔ everything | “which resource is under pressure, and when did it start?” | some/full averages are a ready-made pressure timeline per resource and per cgroup |
pidstat 1 / top -H |
resource ↔ process/thread | “which process or thread is burning it?” | pidstat -d for I/O, -r for memory faults, -t for threads |
lsof / /proc/PID/fd/ |
process ↔ file/socket | “what is this PID actually holding open?” | +L1 finds deleted-but-open files; fd/ maps a number to a real path or socket |
strace -tt -T -p PID |
app ↔ kernel (syscalls) | “what syscall is it stuck in right now?” | -tt timestamps align each syscall to the incident timeline |
perf / bpftrace |
app ↔ kernel (functions) | “where in the kernel is the time actually going?” | off-CPU time and latency histograms — the last resort when logs run dry |
nstat -az / /proc/net/snmp |
network stack counters | “are retransmits or drops accumulating?” | take a delta across the window: counter at T2 minus T1 |
ausearch -ts / auditd |
security ↔ filesystem | “who or what touched this, and when?” | -ts recent bounds it; AVC lines catch SELinux denials in the same window |
The deep-dive lessons behind these are worth a detour when a case demands them: performance tuning: CPU, memory & I/O for PSI, iostat and THP, and observability with eBPF, bpftrace, perf & ftrace for when you need to see inside the kernel path. You will reach for strace and /proc (covered in the methodology lesson) constantly, and processes, jobs, signals & kill for the OOM and signal mechanics in Case 3.
The correlation mindset: building an incident timeline
When a single command answers the question, you do not need a timeline. Multi-layer incidents are exactly the ones where no single command answers it — so you build a timeline: one chronological list of events, pulled from every source, expressed in one timezone, that lets you see cause precede effect. The moment two events that live in different logs line up on the same timeline — the 503 wave beginning the same second the kernel logs No space left — the causal chain is no longer a theory, it is a picture.
The walkthrough is left to right in the diagram below: a symptom in the top layer, an investigator correlating evidence across every layer on a shared clock, tracing down to a root cause in a lower layer, then fixing that and adding the detection that catches it next time.
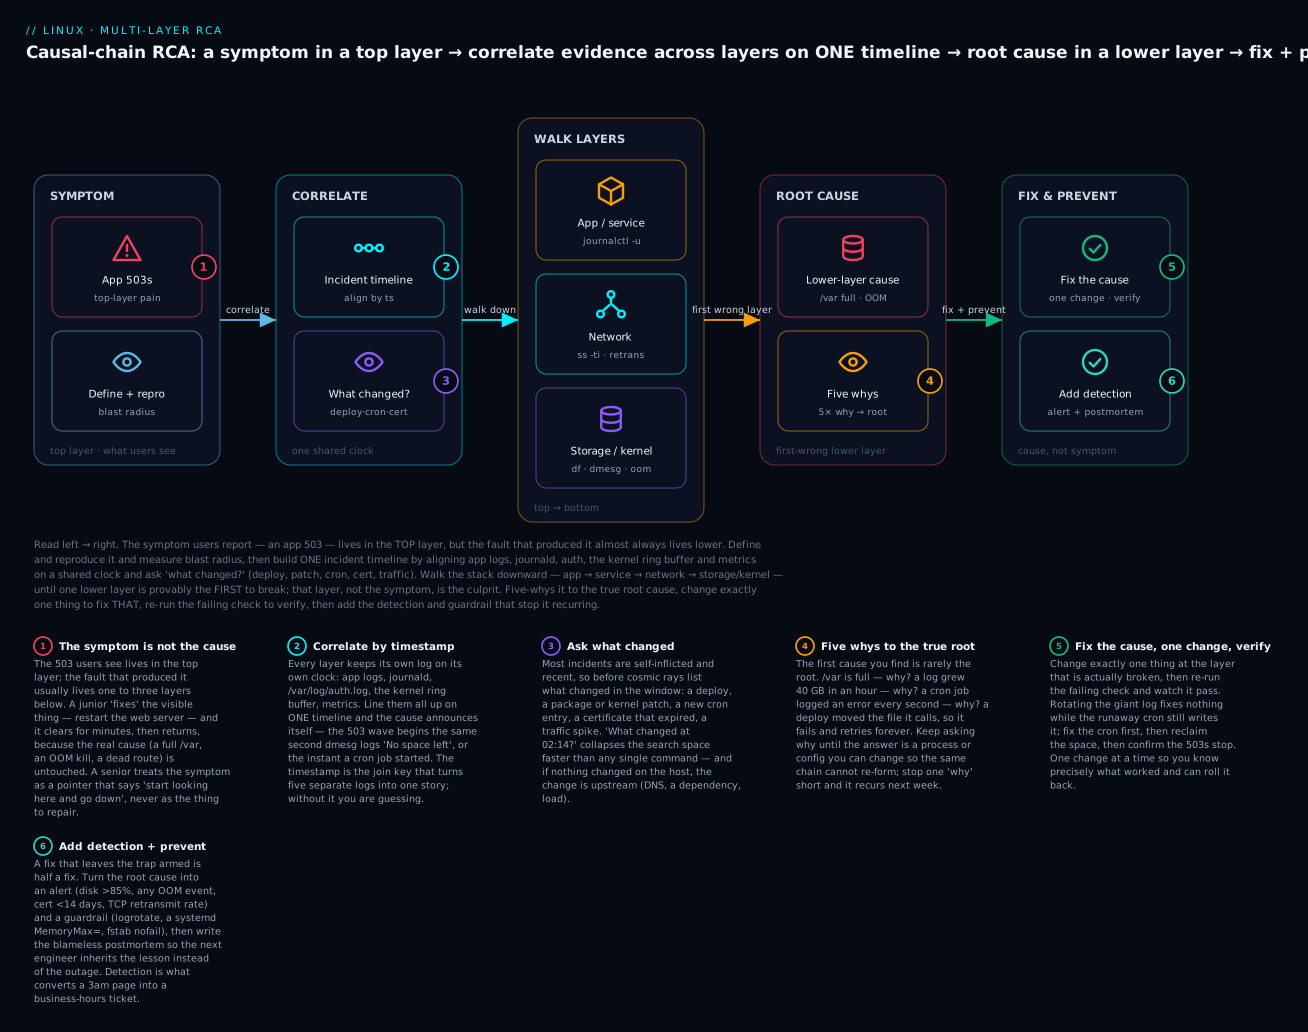
The sources you pull onto the timeline
Every layer keeps its own log, and the great secret of correlation is that they all record time — you just have to normalise it. The single most common mistake is comparing a log in local time against one in UTC and “proving” the effect came before the cause. Set your investigation to one timezone (journalctl -o short-iso emits ISO-8601; add TZ=UTC if your app logs UTC) and everything sorts. Here are the sources, where they live, and what each one uniquely contributes:
| Source | Where it lives | Pull it with | What it uniquely contributes |
|---|---|---|---|
| App logs | the app’s own file or stdout | journalctl -u app -o short-iso / tail -F |
request errors, stack traces, the exact user-visible failure |
| systemd journal | journald | journalctl -o short-iso --since --until |
service starts/stops/crashes, restart loops, exit codes |
| Kernel | ring buffer | journalctl -k -o short-iso / dmesg -T |
OOM kills, I/O errors, filesystem remounts, NIC link flaps, segfaults |
| Auth / sudo | journal (_COMM=sshd,sudo) or /var/log/auth.log |
journalctl -t sudo -t sshd -o short-iso |
who logged in and what they changed — the human “what changed?” |
| Cron / scheduler | journal (_COMM=CROND/crond) |
journalctl -t CROND -o short-iso |
which scheduled job started at time T — the non-human “what changed?” |
| Metrics | Prometheus / node_exporter / sar |
sar -r/-d/-n DEV, dashboards |
the shape of the spike and the resource curves between log lines |
| Package / patch log | /var/log/dpkg.log, dnf history |
grep <date>, dnf history |
a package or kernel update as the change that started it |
| Audit | auditd | ausearch -ts recent |
file changes, SELinux AVC denials, privileged syscalls |
A worked micro-example: to reconstruct a 5-minute window you interleave the sources into one stream, kernel included, bounded to the window, in sortable order:
# One merged, sortable, bounded timeline across app + service + kernel
journalctl -o short-iso --since "2026-07-09 02:07:00" --until "2026-07-09 02:16:00"
# Add the kernel ring buffer to the same view (OOM, I/O errors, link flaps)
journalctl -k -o short-iso --since "02:07" --until "02:16"
# What scheduled jobs fired in the window? (the non-human "what changed")
journalctl -t CROND -o short-iso --since "02:00"
# Who was on the box and what did they run? (the human "what changed")
journalctl -t sudo -o short-iso --since "yesterday"
last -F | head        # login/logout sessions with full timestamps
The “what changed?” question
Most outages are self-inflicted and recent. Before you theorise about cosmic rays or a subtle kernel bug, spend thirty seconds listing what changed in the incident window — because the answer is usually right there. This checklist is worth more than any single command:
| “What changed?” candidate | How to check it | Why it is a prime suspect |
|---|---|---|
| A deploy / release | CI/CD log, git log, artifact mtime |
New code is the #1 cause of new failures |
| A package or kernel patch | dnf history, grep '/var/log/dpkg.log', uname -r vs previous |
A patch can change a default, a driver, or an ABI |
| A new cron / timer | journalctl -t CROND, systemctl list-timers |
A job that runs “at 02:00” explains a 02:00 incident |
| A certificate expiry | openssl x509 -enddate, openssl s_client |
Certs expire at a precise instant — a hard edge, not a ramp |
| A traffic / load change | metrics, ss -s, access-log rate |
A spike exposes a latent limit (connections, memory, FDs) |
| A config edit | ls -lt /etc, auditd, .bak files, last |
A fat-fingered fstab/sshd_config/resolv.conf |
| A disk filling slowly | df -h trend, du, journal size |
The change is time itself — a slow leak that crossed a threshold |
| Nothing on the host | rule the above out | Then the change is upstream: DNS, a dependency, a provider |
If nothing changed on the host, the change is somewhere you do not control — an upstream API, a DNS server, a dependency, the network — and your investigation moves off-box. That negative result is itself progress: it eliminates the entire host.
Blast radius: which layer’s fingerprint matches?
Blast radius is not just “one host or the fleet” — in a cross-layer incident it tells you which layer by matching the shape of the damage to the shape of the layer:
| What is affected | The cause almost certainly lives in… |
|---|---|
| One app, one host | that app’s config / code / data |
| Every app on one host | a shared lower layer on that host — disk, memory, kernel, NIC |
| One app, across many hosts | that app’s shared dependency — a database, a DNS name, a certificate |
| Every host in one rack / AZ | shared infrastructure — a switch, a power/cooling event, a DHCP/DNS server |
| Everything, everywhere, at once | a global dependency — DNS, auth, a CDN, a routing change |
“Every service on this one box is unhappy” is the loudest possible signal that the cause is a shared lower layer — and it is exactly the signal a junior misses when they tunnel on the one service that happened to page first.
Five whys: from the first cause to the true root
The first cause you find is almost never the root — it is just the first layer that broke. Five-whys is the discipline of not stopping there. You ask “why?” of each answer until the answer is a process or configuration you can change so the chain cannot re-form. Here is the canonical example, the one we work in full in Case 1:
| Why # | Question | Answer (the next layer down) |
|---|---|---|
| — | Symptom | The web app is returning 503s |
| 1 | Why 503s? | The load balancer evicted the app; its health checks were failing |
| 2 | Why did health checks fail? | The app’s workers crashed writing to disk — [Errno 28] No space left on device |
| 3 | Why no space? | /var was 100% full |
| 4 | Why was /var full? |
/var/log/sync.log had grown to 43 GB |
| 5 | Why did it grow? | A cron job hit a moved API, failed, and its retry loop logged an error every few milliseconds — with no backoff and no log rotation |
| Root | Stop here | An unbounded retry loop writing to an unrotated log, triggered by yesterday’s vendor API path change |
Watch what stopping too early would have cost. Stop at why-3 (“disk full”) and you rm the log — the 503s clear and return in an hour. Stop at why-4 (“the log is huge”) and you add logrotate — better, but the cron still writes gigabytes a minute and rotation just shreds them faster. Only why-5 names something you can fix so it never recurs: bound the retry, fix the script, and the log stops growing. The root cause is the deepest answer that is still actionable — one “why” further and you would be blaming the vendor for moving an endpoint, which you cannot control (but can defend against, which is prevention).
Case study 1 — “The web app is throwing 503s”
The symptom. At 02:14 the on-call phone goes off: the customer-facing app is returning 503s. Some requests succeed, most fail. The load balancer dashboard shows the app instance flapping in and out of the healthy pool.
The wrong-but-tempting fix. The instinct is to restart the app, or nginx, or both — and it works, for about ninety seconds, then the 503s resume. So you restart again, then you start bumping proxy_read_timeout and adding a second app replica. Every one of these is a symptom-layer action, and the tell that you are on the wrong layer is precisely that the fix keeps working and un-working — a real fix works once, permanently.
The actual dig. Stop restarting and read down the stack. Start at the app the load balancer is calling, not the load balancer:
# The app's own journal — read the actual error, not the 5xx
journalctl -u app -e -o short-iso --no-pager | tail -n 20
# 2026-07-09T02:13:58 app[2143]: OSError: [Errno 28] No space left on device
# 2026-07-09T02:13:58 app[2143]: worker exiting (pid: 2143)

# nginx only relays the failure — its error log shows the upstream dying
sudo tail -n 5 /var/log/nginx/error.log
# 2026/07/09 02:14:03 [error] upstream prematurely closed connection while
#   reading response header from upstream, request: "GET /api/orders"

# Errno 28 is ENOSPC. Go to storage immediately.
df -h
# Filesystem      Size  Used Avail Use% Mounted on
# /dev/mapper/vg-var  20G   20G     0 100% /var     <-- there it is
Errno 28 / No space left on device is the whole game — the app-layer 503 was a full-disk failure wearing an application costume. Now find what filled /var, staying on the one filesystem (-x), and when it started:
# WHAT is eating /var — biggest offenders, one filesystem only
sudo du -xh -d2 /var 2>/dev/null | sort -rh | head -5
# 43G   /var/log/sync.log        <-- a single 43 GB log file
# 512M  /var/lib/postgresql
# ...

# WHEN did it start? Correlate the file's growth with what ran
ls -l --time-style=full-iso /var/log/sync.log      # note mtime = still being written
journalctl -t CROND -o short-iso --since "02:00" | head
# 2026-07-09T02:07:11 CROND[2098]: (root) CMD (/usr/local/bin/sync-data.sh)
sudo tail -n 3 /var/log/sync.log
# 2026-07-09T02:13:59 ERROR: GET https://vendor.example/v1/sync -> 404; retrying
# 2026-07-09T02:13:59 ERROR: GET https://vendor.example/v1/sync -> 404; retrying
# 2026-07-09T02:13:59 ERROR: GET https://vendor.example/v1/sync -> 404; retrying
The timeline. Laid on one clock, the chain is undeniable — cause precedes effect by six minutes:
| Time (ISO) | Source | Event |
|---|---|---|
| 2026-07-09T02:07:11 | cron (journald) | sync-data.sh starts |
| 2026-07-09T02:07:12 | sync.log |
first 404; retrying — endpoint returns 404, retry loop begins |
| 2026-07-09T02:07–02:13 | metrics | /var free space falls from 6 GB to 0 in six minutes |
| 2026-07-09T02:13:58 | app journal | OSError: [Errno 28] No space left on device; workers crash |
| 2026-07-09T02:14:03 | nginx | upstream connection failures → 502/503 to clients |
| 2026-07-09T02:14:05 | load balancer | health checks fail → instance evicted → users get 503 |
The five whys run exactly as the canonical table above: 503 → LB eviction → worker crash → ENOSPC → 43 GB log → unbounded retry loop with no log rotation, triggered by yesterday’s vendor API change (the “what changed” — the endpoint moved from /v1/sync to /v2/sync).
The correct fix — bottom of the chain, one change at a time. Fix the cause, then reclaim the space, then verify:
# 1. Stop the runaway job FIRST — or the disk refills as you clean it
sudo systemctl stop sync-data.timer 2>/dev/null || sudo crontab -e   # comment the line
# 2. Reclaim the space. Truncate rather than rm (a rm on a held-open file
#    frees nothing — the classic deleted-but-open trap):
sudo truncate -s 0 /var/log/sync.log
df -h /var                      # space back
# 3. NOW fix the script: point it at /v2/sync, add exponential backoff,
#    and make it exit non-zero after N failures instead of looping forever.
# 4. Verify with the FAILING check, not a proxy — watch the 503s stop:
for i in $(seq 20); do curl -s -o /dev/null -w "%{http_code}\n" https://app.example/health; sleep 1; done
# expect: twenty 200s
Prevention. The fix above stops this incident; prevention stops the class. Add a logrotate rule for sync.log (rotation is covered in the logging: journald, rsyslog & logrotate lesson), alert on /var usage crossing 85%, cap the journal, and put a hard retry limit in the script. The deepest prevention is a disk-usage SLO: no filesystem should ever be allowed to reach 100% silently. A full disk is very often a logging problem wearing a storage costume — see the storage: disks, partitions, filesystems & fstab lesson for durable /var sizing.
Case study 2 — “Intermittent latency spikes”
The symptom. The app’s p50 latency is a flat 12 ms, but p99 spikes to 600–900 ms every few minutes. It is not constant, it is not correlated with request volume, and it never shows up in a single-request test. Users report “the site is occasionally slow.”
The wrong-but-tempting fix. Intermittent tail latency screams “the app,” so the team profiles the app, blames garbage-collection pauses, and scales out. More replicas do nothing — because the fault is not in the app at all, it is below it, and every replica sits on the same broken lower layer.
The actual dig — a differential across three lower-layer suspects. Intermittent p99 latency has three classic cross-layer causes, and the skill is telling them apart. Reproduce first: run a tight probe and watch for the spike, then check all three suspects during a spike.
# Reproduce: hammer the endpoint and print any slow response
while true; do curl -s -o /dev/null -w "%{time_total}\n" https://app.local/api; done \
  | awk '$1>0.3{print strftime("%FT%T"), $1" SLOW"}'
| Suspect (lower layer) | Fingerprint | Confirm it with | Fix |
|---|---|---|---|
| TCP retransmits (flapping bonded NIC) | spikes align with brief packet loss; retrans climbs |
ss -ti, nstat -az | grep -i retrans, /proc/net/bonding/bond0, dmesg link flaps |
replace the bad transceiver/cable; pull the slave from the bond |
| Noisy-neighbour cgroup (CPU throttling) | spikes when another container is busy; throttled climbs |
cat <cgroup>/cpu.stat (nr_throttled), /proc/pressure/cpu |
raise the cgroup’s CPU quota; pin/limit the neighbour |
| THP compaction stalls | periodic sys CPU bursts; khugepaged active |
grep compact_stall /proc/vmstat, perf top |
set transparent_hugepage=never for the DB |
Here the fingerprint points at the network. During a spike, per-socket stats show retransmissions, and the stack counters are climbing:
# Per-socket TCP info — look at 'retrans' and the RTT
ss -ti dst 10.0.5.20
# ESTAB ... cubic wscale:7,7 rtt:210/180 ... retrans:0/47 lost:12
#   ^ retrans 47 and rtt jumping to 210ms on a LAN peer = packet loss, not the app

# Are retransmits accumulating stack-wide? (delta across the window)
nstat -az | grep -iE 'TcpRetransSegs|TCPLostRetransmit'
# TcpRetransSegs   18234   <- growing every read = ongoing loss

# The bond tells the truth: a slave is flapping
cat /proc/net/bonding/bond0
# Slave Interface: eth1
# MII Status: down            <-- down now; was up seconds ago
sudo dmesg -T | grep -i bond | tail
# [Thu Jul  9 02:03:11 2026] bond0: link status down for interface eth1, disabling it
# [Thu Jul  9 02:03:19 2026] bond0: link status up again after 8000 ms for eth1
Read each output against its healthy baseline — every one of these fields has an unambiguous “trouble” value:
| Signal | Command | Healthy | Trouble |
|---|---|---|---|
| TCP retransmits | ss -ti |
retrans:0/0, stable rtt |
retrans climbing, rtt spiking |
| Retransmit counters | nstat -az |
flat TcpRetransSegs |
rising on every read |
| Bond slave state | /proc/net/bonding/bond0 |
all slaves MII Status: up |
a slave flapping up/down |
| CPU throttling | <cgroup>/cpu.stat |
nr_throttled flat |
nr_throttled/throttled_usec rising |
| Compaction stalls | /proc/vmstat |
compact_stall flat |
rising, with sys-CPU bursts |
The timeline. The p99 spikes at 02:03, 02:09, 02:14 line up exactly with dmesg bond link-down events — every time eth1 drops, in-flight segments on connections pinned to it are lost and must retransmit (an RTO of ~200 ms per loss), which is the latency the app “sees” as a slow response.
The five whys. Latency spike → TCP retransmits → packet loss → bond slave eth1 flapping → a failing SFP transceiver on eth1 → no alert on bond slave state, so a bottom-of-stack hardware fault was invisible to every layer above. Root cause: failing hardware at the very bottom of the stack, symptom at the very top — the purest example of symptom ≠ cause in the whole lesson.
The correct fix + prevention. Pull the flapping slave so the bond runs clean on the healthy link, then schedule the transceiver swap:
sudo ip link set eth1 down                 # take the flapping slave out
cat /proc/net/bonding/bond0 | grep -A1 eth0   # confirm eth0 carries all traffic
watch -n1 'nstat -az | grep TcpRetransSegs'   # retrans rate flattens = fixed
Prevention: alert on bond slave MII Status: down transitions and on TCP retransmit rate, not just absolute count. The bonding mechanics — active-backup vs 802.3ad, miimon, arp monitoring — are covered in advanced networking: bonding, VLANs, bridges & namespaces; if the fingerprint had pointed at compaction or throttling instead, the performance tuning lesson covers THP and cgroup limits, and eBPF/bpftrace/perf gives you off-CPU and retransmit tracing to nail it without guesswork.
Case study 3 — “A process is being killed at random”
The symptom. Every night, some time after 03:00, the payments service dies. systemd restarts it (Restart=on-failure), it recovers, and on-call gets paged. It leaves no crash in its own logs — it just vanishes mid-request.
The wrong-but-tempting fix. “The payments app has a memory leak — raise its memory limit / add Restart=always and move on.” Both are wrong: payments is the victim, not the culprit, and Restart=always just automates papering over a nightly outage.
The actual dig. A process that dies with no log of its own, on a schedule, is a signature. Check how it died — systemd records the signal:
journalctl -u payments -o short-iso | grep -i 'killed\|main process' | tail
# 2026-07-09T03:04:12 systemd[1]: payments.service: Main process exited,
#   code=killed, status=9/KILL
# 2026-07-09T03:04:12 systemd[1]: payments.service: Failed with result 'signal'.
code=killed, status=9/KILL means something sent SIGKILL — the app did not crash, it was executed. On a healthy box the only thing that hands out unsolicited SIGKILLs at 03:00 is the kernel OOM killer. Read the kernel’s report:
journalctl -k -o short-iso --since "03:00" | grep -iE 'oom|killed process'
# 2026-07-09T03:04:12 kernel: report-generator invoked oom-killer:
#   gfp_mask=0x..., order=0, oom_score_adj=0
# 2026-07-09T03:04:12 kernel: Tasks state (memory values in pages):
# 2026-07-09T03:04:12 kernel: [ pid ]  uid  tgid total_vm   rss ... oom_score_adj name
# 2026-07-09T03:04:12 kernel: [ 2143 ] 1001  2143   405076 378221 ...        0 payments
# 2026-07-09T03:04:12 kernel: [ 4501 ] 1002  4501  1620304 1512884 ...       0 report-generator
# 2026-07-09T03:04:12 kernel: Out of memory: Killed process 2143 (payments)
#   total-vm:1620304kB, anon-rss:1512884kB
Read this report like a detective — every field is a clue, and the crucial insight is that the process that invoked the OOM killer, the process that got killed, and the process that caused the exhaustion can be three different processes:
| OOM report field | What it means | The subtlety |
|---|---|---|
X invoked oom-killer |
the process whose allocation triggered reclaim | usually not the leaker — just whoever asked for the last page |
order=0 |
allocation size (2⁰ pages) | order=0 = normal pressure; high order = fragmentation |
Tasks state table |
every process with rss and oom_score_adj |
scan the rss column — the biggest is the likely victim |
Killed process N (name) |
the victim the kernel chose | chosen by highest oom_score, ~ proportional to RSS + oom_score_adj |
anon-rss |
the victim’s resident anonymous memory | how much was reclaimed by killing it |
In the Tasks state table, report-generator is holding 1.5 GB anonymous RSS at 03:04 — but so is payments. The kernel killed payments because at that instant it scored highest, even though report-generator is the one whose growth pushed the box into OOM. Confirm the culprit by watching the memory climb and reading the live OOM scores:
# Live OOM score of each process (0-1000; higher = killed sooner)
cat /proc/$(pgrep -f report-generator)/oom_score
cat /proc/$(pgrep -f payments)/oom_score
# What is memory pressure doing at 03:00? (PSI — a pressure timeline)
cat /proc/pressure/memory
# some avg10=41.20 avg60=38.05 ...   <- sustained memory stall = real pressure
The timeline. report-generator starts at 03:00 (a nightly batch), its RSS climbs steadily from 200 MB to 6 GB over four minutes, the box exhausts RAM + swap at 03:04, and the kernel fires the OOM killer, which kills payments — an innocent, steadily-large process — 0.2 seconds later. The nightly batch, in a completely different service, killed the payments API.
The five whys. payments killed → SIGKILL from the kernel OOM killer → RAM + swap exhausted → report-generator RSS grew to 6 GB → it accumulates every row of a nightly report into one list instead of streaming → and the kernel killed payments rather than the leaker because OOM selects by oom_score, not by guilt. Root cause: unbounded memory growth in a different service’s batch job.
The correct fix + prevention. Fix the leak (stream the report instead of buffering it) — that is the bottom of the chain. Until the code ships, contain the blast radius so the leaker can only kill itself, and make payments the last thing the kernel ever picks:
# Contain the leaker within its own cgroup so it OOMs itself, not the host
sudo systemctl edit report-generator     # add:  [Service]\nMemoryMax=2G
# Make payments the LAST victim the kernel considers
sudo systemctl edit payments              # add:  [Service]\nOOMScoreAdjust=-800
sudo systemctl daemon-reload
# Detect any future OOM kill immediately (cgroup v2 counter)
cat /sys/fs/cgroup/system.slice/report-generator.service/memory.events
# oom_kill 0    <- alert on any increase
Each knob targets a different part of the OOM problem — learn which does what so you contain the leaker without hiding the leak:
| Knob | Scope | What it does | Use it to |
|---|---|---|---|
MemoryMax= |
cgroup (unit) | hard ceiling; OOMs the unit inside its own cgroup | stop a leaker starving the host |
MemoryHigh= |
cgroup (unit) | soft cap; throttles reclaim before the hard max | slow a grower without killing it |
OOMScoreAdjust= |
process | biases oom_score (−1000…1000) |
make a critical service the last victim |
memory.events oom_kill |
cgroup (unit) | counter of in-cgroup OOM kills | alert on any increase |
systemd-oomd |
userspace + PSI | kills on memory pressure before kernel OOM | pre-empt a hard kernel OOM |
| swap sizing | host | absorbs spikes, buys reclaim time | smooth transient peaks (not leaks) |
The signal, kill and process mechanics are in processes, jobs, signals & kill, and cgroup memory limits + PSI in the performance tuning lesson. ⚠️ Never “fix” a repeating OOM by disabling swap or raising limits blindly — you remove the kernel’s shock absorber and move the crash somewhere less predictable.
Case study 4 — “I can’t SSH in after the reboot”
The symptom. During a maintenance window you patched a box and rebooted it. It never came back — SSH connections time out (or are refused), and the service it hosts is down. From your laptop the box is simply gone.
The wrong-but-tempting fix. “Reboot it again,” or “the patch broke sshd — rebuild the box.” Rebooting a box stuck in emergency mode just puts it back in emergency mode, and rebuilding destroys the evidence (and any un-backed-up data) for a problem that is a two-line fix.
The actual dig — you must get a console. SSH is a service, and a service that never started cannot be debugged over the network it needs. Get out-of-band access: a cloud serial console, IPMI/iDRAC, or the hypervisor’s console. What greets you tells the story:
You are in emergency mode. After logging in, type "journalctl -xb" to view
system logs, "systemctl reboot" to reboot, or "exit" to continue booting.
Give root password for maintenance (or press Control-D to continue):
The box booted the kernel fine and then stopped before reaching multi-user.target — which is why sshd (ordered long after) never started. Find what stalled it:
systemctl --failed
#   UNIT               LOAD   ACTIVE SUB    DESCRIPTION
#   data.mount         loaded failed failed /data
#   local-fs.target    loaded failed failed Local File Systems
journalctl -xb -p err | tail
# Timed out waiting for device dev-disk-by\x2duuid-9f3c...device.
# Dependency failed for /data.
# Dependency failed for Local File Systems.
# Dependency failed for Multi-User System.   <- and so sshd never ran
local-fs.target failed because a mount timed out waiting for a device that never appeared — a bad /etc/fstab entry. This is the single most common self-inflicted “box won’t come back” incident. The variants are worth knowing because the console banner differs:
| What you see on the console | Likely cause | The tell | The fix |
|---|---|---|---|
“You are in emergency mode” + a failed .mount |
Bad /etc/fstab (typo’d UUID, removed disk) |
systemctl --failed names the mount; journalctl “Timed out waiting for device” |
comment/fix the line, mount -a, systemctl default |
| Boot hangs at “A start job is running for /data (1min 30s)” | fstab device slow/absent, no nofail |
the 90 s countdown, then emergency | add nofail + x-systemd.device-timeout= |
Very slow boot, then works; or sshd fails to bind |
SELinux relabel / mislabel | /.autorelabel present, or ls -Z on host keys wrong |
let the relabel finish; restorecon -Rv /etc/ssh |
Login prompt but sessions drop / sshd errors |
Full / or /var |
df -h shows 100%; PAM/utmp write fails |
free space; then durable log/space fix |
The correct fix. Remount root writable, correct the offending line, and — the step that prevents a second outage — validate the file with mount -a before you reboot:
mount -o remount,rw /             # emergency mode mounts / read-only
vi /etc/fstab                     # fix or comment the bad UUID line
mount -a                          # MUST return clean — an error means it's still wrong
systemctl daemon-reload
systemctl default                 # continue to multi-user without rebooting; sshd starts
⚠️ Never reboot a box with a /etc/fstab you have not validated with mount -a. That one command finds the mistake before the reboot instead of after — the entire reason fstab errors are so painful is that they only bite at boot.
The timeline & five whys. The fstab was edited at 21:55 during the maintenance change; the reboot at 22:00 hit the bad line; the device unit timed out at 22:01 (90 s); local-fs.target failed → emergency mode → sshd never started. Five whys: no SSH → sshd never started → boot stopped at emergency.target → local-fs.target failed → the /data device never appeared → a UUID copy-pasted from another host and never validated with mount -a. Root cause: an unvalidated config edit — a storage/config-layer fault presenting as a network/service-layer symptom.
Prevention. Always keep console access configured before you need it, and validate every fstab change with mount -a in the same session you make it. Beyond that, a handful of fstab options turn this class of outage into a non-event:
fstab option |
Effect | When to use |
|---|---|---|
nofail |
boot continues even if the device is absent | any non-critical / data mount |
x-systemd.device-timeout=10s |
shorten the 90 s wait for a missing device | avoid long boot hangs |
_netdev |
wait for the network before mounting | NFS / iSCSI / network filesystems |
x-systemd.automount |
mount lazily on first access, not at boot | rarely-used mounts |
x-systemd.requires=<unit> |
order the mount after a specific unit | mounts needing a service first |
The full boot sequence — firmware → GRUB → initramfs → systemd targets, and where emergency vs rescue fit — is in the boot process lesson; the fstab syntax and mount options are in the storage lesson.
Case study 5 — “DNS works, then it doesn’t”
The symptom. The app intermittently fails to reach a vendor API with Temporary failure in name resolution. Retry, and it works. It fails maybe one request in eight, with no pattern the app team can find — the very definition of a flaky, un-reproducible bug.
The wrong-but-tempting fix. “Just add the IP to /etc/hosts.” This papers over the symptom and creates a time bomb: when the vendor changes the IP, that host silently talks to the wrong (or dead) endpoint forever. Restarting the app and bumping timeouts are equally symptom-layer.
The actual dig. “Intermittent” is the clue — intermittent DNS almost always means some queries take a different path than others. Reproduce in a loop to make the flaky failure a reliable one:
# Make the intermittent failure reproducible — hammer resolution
for i in $(seq 40); do getent hosts api.vendor.example >/dev/null \
  && echo "$i ok" || echo "$i FAIL"; done | grep -c FAIL
# 5        <- ~1 in 8 fails, consistently

# What resolver is in play, and what are its servers?
resolvectl status | grep -A4 'Current DNS'
#   Current DNS Server: 10.0.0.53
#          DNS Servers: 10.0.0.1 10.0.0.53
resolvectl statistics
#   Cache ... Current Cache Size: ... Hits/Misses
#   Transactions ... Failed: 137        <- failures are real and counted
Two DNS servers are configured. The mechanism of “works then doesn’t” is the interaction of caching and a failing secondary: while an answer is cached (within its TTL) every lookup is instant and succeeds; when the TTL expires, systemd-resolved re-queries, and if that query lands on the dead secondary (10.0.0.53) it times out → SERVFAIL → the app’s Temporary failure in name resolution. The next query may hit the healthy primary or a fresh cache and succeed. The four outcomes of a single lookup explain the whole “works then doesn’t” pattern:
| A lookup that… | Path it takes | Outcome |
|---|---|---|
| hits a fresh cache entry | resolved answers from cache |
instant success |
| misses → the primary | query → 10.0.0.1 (healthy) |
success, and re-caches |
| misses → the dead secondary | query → 10.0.0.53 (down) |
times out → SERVFAIL → app error |
finds a stale /etc/hosts line first |
files wins before resolve |
wrong / dead IP, silently |
Prove which server is bad by querying each directly, and prove the caching angle by flushing:
# Query each configured server directly — one of them is dead
dig +short +time=2 +tries=1 @10.0.0.1  api.vendor.example    # returns an A record
dig +short +time=2 +tries=1 @10.0.0.53 api.vendor.example    # times out -> the culprit

# Prove caching hides it: flush, then the very next miss is more likely to fail
resolvectl flush-caches
journalctl -u systemd-resolved -o short-iso --since "-10min" | grep -i 'server\|switch'
# systemd-resolved[]: Server 10.0.0.53 is not responding, switching to 10.0.0.1.
There is a second, related trap worth checking: the nsswitch.conf hosts: order decides whether resolved is even consulted, and in what order sources are tried:
grep '^hosts:' /etc/nsswitch.conf
# hosts: files resolve [!UNAVAIL=return] myhostname dns
#   files   -> /etc/hosts first (this is why a stale /etc/hosts entry wins silently)
#   resolve -> systemd-resolved (127.0.0.53 stub)
#   dns     -> classic /etc/resolv.conf path if resolve is UNAVAIL
If someone had “fixed” an earlier incident by adding a line to /etc/hosts, files wins before resolve ever runs — a different flavour of the same class of bug. And if the hosts: line reads files dns (no resolve), the app bypasses resolved’s cache entirely and hits /etc/resolv.conf, which may list the same dead secondary.
The commands that turn “flaky DNS” into a named dead server:
| Command | What it proves |
|---|---|
resolvectl status |
which servers are configured, and the current one |
resolvectl statistics |
the real failure count (transactions failed) |
dig +time=2 +tries=1 @SERVER name |
tests one server directly — finds the dead one |
resolvectl query --cache=no name |
forces a fresh lookup, bypassing the cache |
resolvectl flush-caches |
clears the cache to expose the failing path |
grep '^hosts:' /etc/nsswitch.conf |
the source order (files / resolve / dns) |
The timeline & five whys. Resolution failures scatter across the day with no load correlation, but every failed query in the journal shows a transaction to 10.0.0.53 timing out; successful ones are cache hits or primary hits. Five whys: intermittent resolution failures → only cache-miss queries fail → those queries hit the secondary 10.0.0.53 → 10.0.0.53 is not answering (decommissioned but never removed from the config) → no per-resolver health probe existed, and the primary + cache masked it most of the time. Root cause: a dead DNS server left in the resolver list, its failures hidden intermittently by caching.
The correct fix + prevention. Remove or replace the dead secondary at the source of the resolver config (NetworkManager, systemd-networkd, or DHCP — not by hand-editing the generated /etc/resolv.conf, which is overwritten), then verify with the same loop that reproduced it:
# Example: fix it in NetworkManager, then re-apply
sudo nmcli con mod "wired" ipv4.dns "10.0.0.1"      # drop the dead 10.0.0.53
sudo nmcli con up "wired"; resolvectl flush-caches
for i in $(seq 40); do getent hosts api.vendor.example >/dev/null \
  && echo ok || echo FAIL; done | grep -c FAIL      # expect 0
Prevention: health-check every DNS server independently, not just “DNS” as a whole — a redundant resolver that is silently dead is worse than no redundancy, because caching hides it until the worst moment. Alert on resolved’s failed-transaction rate, and prefer a local caching resolver with real health checks over a hand-maintained server list.
Post-incident: from a fix to prevention
An incident is not over when the symptom clears — it is over when it cannot recur unnoticed. The gap between “restarted the service” and “closed the class of bug” is where senior operators live, and it has four parts: a blameless postmortem, a written RCA, new detections, and the guardrail that turns the fix into prevention.
The blameless postmortem
“Blameless” is not politeness — it is accuracy. The instant a postmortem is about who to blame, people stop telling you what actually happened, and you lose the very information you need to prevent recurrence. The discipline:
| Do | Don’t |
|---|---|
| Ask “what made this failure possible?” | Ask “who broke it?” |
| Treat human error as a system that permitted it | Treat human error as the root cause |
| Write down the timeline and the causal chain | Write down a single culprit |
| Produce concrete action items with owners | Produce “be more careful” |
| Share it widely so others inherit the lesson | Bury it so it looks like it never happened |
“The engineer typed the wrong UUID” is never a root cause — the root cause is that the system let an unvalidated fstab reach a reboot. The fix is a mount -a gate or a canary, not a stern word. Every “human error” is a missing guardrail.
The RCA write-up
A short, structured write-up is what makes an incident an asset — searchable, so the next person who sees these symptoms finds your five-minute answer instead of spending three hours. Use this checklist as the template; each row is a heading in the document:
| RCA section | What goes in it | Why it matters |
|---|---|---|
| Summary | one sentence: symptom, impact, root cause | the searchable headline (503s → /var full from runaway cron) |
| Impact | who/what, how long, how bad (users, revenue, SLO burn) | scopes the incident honestly |
| Timeline | the correlated, one-clock event list | the evidence — this is the RCA’s spine |
| Root cause | the five-whys chain to the deepest actionable cause | so the fix targets the bottom of the chain |
| Symptom vs cause | which layer each lived in | teaches the reader the cross-layer lesson |
| Resolution | the one change that actually fixed it, and how it was verified | the reproducible fix |
| Detection gap | why it wasn’t caught sooner; time-to-detect | drives the new alerts |
| Action items | prevention + detection, each with an owner and date | the part that stops recurrence |
| Lessons | what generalises beyond this one incident | compounds across the team |
Detections and guardrails: turn each fix into prevention
For every case above, the fix stopped one incident; a detection stops the class. The rule is simple: whatever you had to discover manually should have alerted you automatically. If you found it with a command, that command’s output is a metric you can alert on.
| Root cause (from the cases) | Detection to add | Guardrail (prevention) |
|---|---|---|
Full /var from a runaway log (Case 1) |
alert: any filesystem >85%; journal size cap | logrotate rule; bounded retry; disk SLO |
| TCP retransmits from a flapping NIC (Case 2) | alert: bond slave down transitions; retransmit rate |
redundant path monitoring; scheduled transceiver checks |
| OOM killing the wrong process (Case 3) | alert: any oom_kill event / high memory PSI |
MemoryMax= per service; OOMScoreAdjust= on critical ones |
Unvalidated fstab → emergency mode (Case 4) |
alert: boot reached emergency/degraded; a reboot canary |
nofail + x-systemd.device-timeout=; mount -a gate in change process |
| Dead DNS server hidden by cache (Case 5) | probe each resolver independently; alert on failed-transaction rate | remove stale resolvers; local caching resolver with health checks |
Those detections fall into a few types, and a mature system uses all of them rather than leaning on thresholds alone:
| Detection type | Fires on | Example from the cases |
|---|---|---|
| Threshold | a level crossed | disk >85% (Case 1) |
| Rate-of-change | a slope, not a level | TCP retransmit rate (Case 2) |
| Event | a discrete log line | any oom_kill (Case 3) |
| State | a bad status value | boot reached emergency (Case 4) |
| Synthetic probe | an active health check | per-resolver DNS probe (Case 5) |
| Absence | an expected signal missing | a heartbeat or metric gap |
The through-line: an alert on the cause layer (disk %, OOM events, bond state, boot target, per-resolver health) would have caught every one of these incidents before the symptom-layer page — turning a 3am “site is down” into a business-hours “disk is filling on host-7.” That conversion is the entire economic argument for doing RCA properly, and it is the last badge on the diagram: fix the cause and add the detection.
Hands-on lab
⚠️ Run this on a throwaway VM, WSL instance, or container you can destroy — it deliberately breaks things and fills a (small, loopback) disk. Snapshot first; every step cleans up after itself.
We will manufacture a genuine two-layer incident — a runaway writer fills a filesystem, and a service on top fails — then diagnose it by correlation, building a timeline instead of guessing.
Step 1 — Baseline. Know healthy before you break it.
mkdir -p /tmp/rca && dd if=/dev/zero of=/tmp/rca/disk.img bs=1M count=64 status=none
mkfs.ext4 -q /tmp/rca/disk.img
sudo mkdir -p /mnt/rca && sudo mount -o loop /tmp/rca/disk.img /mnt/rca
df -h /mnt/rca            # ~60M free — this is our tiny "/var"
What just happened: you built an isolated 64 MB filesystem so the lab cannot touch your real disk. This is the “storage” layer we will exhaust.
Step 2 — Start a “service” on top, then a runaway writer below it. Two layers, two clocks.
# The "app": writes a heartbeat only while it can write to the FS
( while true; do echo "$(date -Is) heartbeat" >> /mnt/rca/app.log 2>/mnt/rca/app.err \
   || echo "$(date -Is) APP DOWN: $(tail -c80 /mnt/rca/app.err)"; sleep 1; done ) &
APP=$!
# The "runaway cron": fills the filesystem fast, logging as it goes
( logger -t sync-lab "sync-lab starting"; \
  dd if=/dev/zero of=/mnt/rca/sync.log bs=1M count=200 status=none 2>/dev/null; \
  logger -t sync-lab "sync-lab done" ) &
What just happened: the app is happily writing heartbeats; the runaway job is racing to fill the 60 MB filesystem. Within seconds the app will start failing — the symptom.
Step 3 — Observe the symptom, then diagnose down the layers. Do not fix yet.
sleep 8
jobs                      # the app job is still "running" but…
# symptom: the app is now logging APP DOWN — read WHY, don't assume
df -h /mnt/rca            # 100% — the storage layer is the first provably-wrong one
sudo du -xh -d1 /mnt/rca | sort -rh | head    # sync.log is the offender
What just happened: the app “failed” (top layer) but df proved the cause is storage (lower layer). You isolated the first-wrong layer instead of restarting the app.
Step 4 — Build the timeline by correlation. Prove cause preceded effect.
# Pull both sources onto one clock: the cron marker and the app's first failure
journalctl -t sync-lab -o short-iso --since "-2min"
#   ...T..:..:.. sync-lab starting        <- CAUSE begins here
grep -m1 'APP DOWN' <(tail -n50 /dev/stdin) 2>/dev/null   # (or read the terminal)
What just happened: the sync-lab starting timestamp comes before the first APP DOWN line — the timeline shows the runaway writer started first and the app failed as a consequence. That ordering is the root-cause proof.
Step 5 — Fix the cause (not the symptom), then verify + clean up.
sudo truncate -s 0 /mnt/rca/sync.log     # reclaim space at the CAUSE
sleep 3
tail -n2 /mnt/rca/app.log                # heartbeats resume = verified via the failing check
# cleanup
kill %1 %2 2>/dev/null; sudo umount /mnt/rca && sudo rmdir /mnt/rca && rm -rf /tmp/rca
What just happened: clearing the cause (the runaway file) let the symptom (the app) recover on its own — you never touched the app. That is the entire lesson in five steps: the symptom and the cause were in different layers, and correlation on one timeline is what connected them.
Common mistakes and troubleshooting
| Symptom / mistake | Cause | Fix |
|---|---|---|
| The fix “works” then un-works every few minutes | You treated the symptom; the cause is still active (log refilling, NIC still flapping) | Trace down to the first-wrong layer; fix the bottom of the chain |
| Restarted the service; it dies again nightly on a schedule | A scheduled other process (batch/cron) is the real cause | Correlate the death timestamp with journalctl -t CROND / metrics |
| “Proved” the effect happened before the cause | Two logs in different timezones | Normalise: journalctl -o short-iso, one TZ, then sort |
| Killed the OOM’d process’s “leak” but OOM continues | You blamed the victim; a different service is the leaker | Read the OOM Tasks state table + oom_score; fix the actual grower |
df says full but du can’t find the space |
A process holds a deleted-but-open file | lsof +L1; restart the holder or truncate its fd |
rm’d the giant log, disk still full |
The writer had it open; rm freed nothing |
truncate -s 0, and stop the writer first |
Added the IP to /etc/hosts to “fix DNS” |
Papered over a dead resolver; files wins in nsswitch |
Remove the hosts hack; fix/remove the dead DNS server |
| Rebooted a box that won’t come back — twice | It’s in emergency mode from a bad fstab; reboot re-enters it |
Console in, fix fstab, mount -a, systemctl default |
| Scaled out to fix p99 latency; no change | The fault is in a shared lower layer, not the app | Match blast radius to layer; check NIC/cgroup/THP |
The three nastiest, spelled out. First, the timezone trap — a timeline that “proves” the effect preceded its cause sends you chasing a phantom for an hour, until you notice one log is UTC and the other local; force one timezone (-o short-iso, TZ=UTC) before concluding anything from ordering. Second, blaming the victim — the OOM killer chooses by oom_score, not guilt, so the process that dies is often not the one that leaked; “fix” the victim and the leaker returns tomorrow with a new victim, so always ask which process’s growth preceded the kill. Third, fixing the highest layer you can see — under pressure the pull to act on the visible symptom is strongest, and every case here is the same shape (symptom high, cause low); the discipline that beats it is mechanical: first-five triage, correlate onto one timeline, walk down to the first-wrong layer, and only then touch anything.
Cheat-sheet
| Command | What it does |
|---|---|
journalctl -o short-iso --since T1 --until T2 |
Bounded, sortable timeline across all systemd sources |
journalctl -k -o short-iso |
Kernel ring buffer on the same clock (OOM, I/O, link flaps) |
journalctl -t CROND -t sudo -o short-iso |
The non-human + human “what changed?” |
dmesg -T | grep -iE 'oom|i/o error|bond|ext4-fs' |
Low-layer events, human timestamps |
df -h / df -i |
Free space / inodes — the #1 impersonator |
du -xh -d1 /var | sort -rh |
What filled a filesystem, staying on it |
lsof +L1 / truncate -s 0 FILE |
Deleted-but-open files / reclaim without rm |
ss -ti dst HOST |
Per-socket TCP: retrans, rtt, congestion |
nstat -az | grep -i retrans |
Retransmit counters (delta over the window) |
cat /proc/net/bonding/bond0 |
Bond slave up/down state (flapping NIC) |
cat /proc/pressure/{cpu,memory,io} |
PSI — which resource is stalled, since when |
cat <cgroup>/cpu.stat |
nr_throttled — noisy-neighbour CPU throttling |
grep compact_stall /proc/vmstat |
THP compaction stalls (periodic sys CPU) |
journalctl -k | grep -i 'killed process' |
The OOM report + chosen victim |
cat /proc/PID/oom_score / oom_score_adj |
Live OOM score / its bias |
systemctl edit UNIT → MemoryMax= / OOMScoreAdjust= |
Cgroup memory cap / OOM victim bias |
systemctl --failed / journalctl -xb |
Failed units / this boot’s story (emergency mode) |
mount -a |
Validate /etc/fstab before rebooting |
resolvectl status / statistics / flush-caches |
Resolver servers / failure counts / clear cache |
dig +time=2 +tries=1 @SERVER name |
Test one DNS server directly (find the dead one) |
grep '^hosts:' /etc/nsswitch.conf |
Resolution source order (files resolve dns) |
Interview and exam questions
Q: A web app is throwing 503s. You restart it and the 503s stop for two minutes, then return. What does that behaviour tell you, and what do you do next?
A: A fix that repeatedly works and un-works is the signature of a symptom-layer action against a still-active lower-layer cause — the restart bought time (e.g. before a log refilled the disk) but didn’t touch the fault. Stop restarting; read the app’s own error (journalctl -u app), and if it’s [Errno 28] No space left on device, drop to storage: df -h, then du -xh to find what’s filling it and journalctl -t CROND/mtimes to find when and what started it. Fix the cause (the runaway writer), then reclaim space, then verify the 503s stop.
Q: How do you build an incident timeline across app logs, journald, the kernel, and auth, and what is the most common mistake?
A: Pull each source in a sortable, bounded, single-timezone format and interleave them: journalctl -o short-iso --since --until, add -k for the kernel, -t CROND/-t sudo for scheduled and human changes, plus metrics for the spike shape. The most common mistake is mixing timezones — one log in UTC and one local “proves” the effect preceded the cause. Normalise the clock (-o short-iso, TZ=UTC) before drawing any ordering conclusion.
Q: A process dies nightly with code=killed, status=9/KILL and no error in its own log — diagnose it, and explain why the victim is often not the culprit.
A: SIGKILL with no self-logged crash, on a schedule, on a healthy box, is the OOM killer. Read journalctl -k for the report: the X invoked oom-killer line, the Tasks state table (scan rss), and Killed process N. The kernel frees the most memory with one kill, so it picks the highest oom_score (≈ RSS + oom_score_adj) — a steadily-large legitimate service can outscore a smaller leaker, so an innocent bystander takes the bullet. Find the process whose memory grew before the kill (correlate with metrics/PSI), fix that leaker, contain it with MemoryMax=, bias the kernel off the critical service with OOMScoreAdjust=-800, and alert on memory.events oom_kill.
Q: p99 latency spikes intermittently while p50 is flat. Name three cross-layer causes and how you’d tell them apart.
A: (1) TCP retransmits from a flapping NIC — ss -ti shows rising retrans, /proc/net/bonding/bond0 shows a slave down, dmesg shows link flaps; spikes align with the flaps. (2) Noisy-neighbour cgroup CPU throttling — <cgroup>/cpu.stat nr_throttled climbs and /proc/pressure/cpu shows CPU stall when a neighbour is busy. (3) THP compaction stalls — grep compact_stall /proc/vmstat rises with periodic sys-CPU bursts and khugepaged activity; fix with transparent_hugepage=never for databases. All three are below the app, which is why scaling the app does nothing.
Q: (RHCSA-style) After a reboot you can’t SSH to a box. It pings intermittently or not at all. Walk through recovery.
A: SSH is a service ordered late in boot, so if it never started the box likely stalled before multi-user.target. Get a console (serial/IPMI/hypervisor). If it’s in emergency mode, systemctl --failed and journalctl -xb — a failed .mount + local-fs.target + “Timed out waiting for device” means a bad /etc/fstab. mount -o remount,rw /, fix the line, mount -a to validate, systemctl daemon-reload, systemctl default. Prevent with nofail, x-systemd.device-timeout=, and never rebooting on an un-mount -a’d fstab.
Q: DNS “works then doesn’t” — one in eight lookups fails with Temporary failure in name resolution. Root-cause it.
A: Intermittent resolution means some queries take a different path. Reproduce in a loop; resolvectl status shows the configured servers and resolvectl statistics counts failures. The mechanism is caching + a failing secondary: cached answers succeed until TTL expiry, then a re-query that lands on the dead server times out. Prove it with dig @each-server (one times out) and resolvectl flush-caches (failures rise right after). Fix by removing/replacing the dead resolver at its config source (NetworkManager/networkd/DHCP), not /etc/hosts. Also check the nsswitch.conf hosts: order.
Q: What is the difference between the layer a symptom appears in and the layer its cause lives in, and why does it almost always run one direction? A: The symptom appears where a human or a monitor observes the pain — usually high in the stack (the app, the request). The cause lives wherever the fault actually is — usually lower, because higher layers depend on lower ones and inherit their failures (a full disk breaks the service which breaks the app which the user sees). So the asymmetry runs one way: symptom high, cause low. That’s why the method walks the stack downward and stops at the first provably-wrong layer.
Q: What does “what changed?” buy you, and what does it mean if the answer is “nothing on this host”? A: Most outages are self-inflicted and recent, so listing changes in the incident window — deploy, package/kernel patch, new cron/timer, cert expiry, traffic spike, config edit — usually points straight at the cause and collapses the search space faster than any command. If nothing changed on the host, the change is upstream (DNS, a dependency, a certificate you consume, a provider), so the investigation moves off-box — and ruling out the host is itself real progress.
Q: Why is a five-whys the right depth — not three, not ten? A: You stop at the deepest cause that is still actionable — a process or config you can change so the chain can’t re-form. Too shallow (stop at “disk full”) and you fix a symptom of the real cause and it recurs; too deep (blame the vendor for moving an endpoint) and you’ve left the boundary of what you control. The right root cause is the last “why” whose answer you can turn into a fix or a guardrail.
Q: What makes a postmortem “blameless,” and why is that a technical requirement rather than a courtesy?
A: Blameless means the question is “what made this failure possible?” not “who did it?” — human error is treated as a system that permitted the mistake, so the fix is a guardrail (a mount -a gate, a MemoryMax=) not a reprimand. It’s technical, not social: the moment a postmortem assigns blame, people stop sharing what actually happened, and you lose the exact information you need to prevent recurrence. Accuracy requires safety.
Q: For each incident you resolve, what should you add so it can’t page you the same way twice?
A: A detection at the cause layer and a guardrail. Whatever you discovered by hand becomes an alert (disk >85%, any oom_kill, bond-slave down, boot reached emergency, per-resolver health) and a preventive control (logrotate, MemoryMax=, nofail, remove the dead resolver). The goal is to convert the next occurrence from a 3am symptom-layer page (“site down”) into a business-hours cause-layer ticket (“disk filling on host-7”) — that conversion is the whole return on doing RCA properly.
Key takeaways
- The symptom and the root cause live in different layers. The symptom appears high (the app, the request); the cause lives low (disk, memory, kernel, NIC), because higher layers inherit the failures of the ones beneath them. Walk the stack downward and stop at the first provably-wrong layer — everything above it is an echo.
- A fix that works then un-works is a symptom fix. A real fix works once, permanently. If restarting keeps buying minutes, the cause is still active one or more layers below — stop treating the symptom and trace the chain to the bottom.
- Correlate everything onto one timeline, on one clock. No single log holds the whole story; the causal chain only becomes visible when app logs, journald, auth, the kernel, and metrics are interleaved in one sortable timezone (
journalctl -o short-iso). Mixed timezones are the fastest way to “prove” a false cause. - Always ask “what changed?” Deploy, patch, new cron/timer, cert expiry, traffic, config edit — most outages are self-inflicted and recent. If nothing changed on the host, the change is upstream, and ruling out the host is progress.
- Five-whys to the deepest actionable cause. The first cause you find is the first broken layer, not the root. Keep asking why until the answer is a process or config you can change so the chain can’t re-form — the OOM victim is not the leaker, the full disk is not the runaway writer, the 503 is not the bug.
- Fix the cause with one change, then verify with the failing check. Change one thing at the layer that is actually broken and re-run the exact thing that failed until it passes — clearing the cause lets the symptom recover on its own.
- An incident isn’t over until it can’t recur unnoticed. Write the blameless postmortem and the structured RCA, then add a detection at the cause layer and a guardrail — converting the next 3am “site is down” into a business-hours “disk filling on host-7” is the entire point of root-cause analysis.